22institutetext: European Southern Observatory, Garching b. Munchën, Germany
Molecular Disks in Radio Galaxies
Abstract
Context. It has recently been proposed that the jets of low-luminosity radio galaxies are powered by direct accretion of the hot phase of the IGM onto the central black hole. Cold gas remains a plausible alternative fuel supply, however. The most compelling evidence that cold gas plays a role in fueling radio galaxies is that dust is detected more commonly and/or in larger quantities in (elliptical) radio galaxies compared with radio-quiet elliptical galaxies. On the other hand, only small numbers of radio galaxies have yet been detected in CO (and even fewer imaged), and whether or not all radio galaxies have enough cold gas to fuel their jets remains an open question. If so, then the dynamics of the cold gas in the nuclei of radio galaxies may provide important clues to the fuelling mechanism.
Aims. The only instrument capable of imaging the molecular component on scales relevant to the accretion process is ALMA, but very little is yet known about CO in southern radio galaxies. Our aim is to measure the CO content in a complete volume-limited sample of southern radio galaxies, in order to create a well-defined list of nearby targets to be imaged in the near future with ALMA.
Methods. APEX††thanks: This publication is based on data acquired with the Atacama Pathfinder Experiment (APEX). APEX is a collaboration between the Max-Planck-Institut fur Radioastronomie, the European Southern Observatory, and the Onsala Space Observatory. has recently been equipped with a receiver (APEX-1) able to observe the 230 GHz waveband. This allows us to search for CO() line emission in our target galaxies.
Results. Here we present the results for our first three southern targets, proposed for APEX-1 spectroscopy during science verification: NGC 3557, IC 4296 and NGC 1399. The experiment was successful with two targets detected, and possible indications for a double-horned CO line profile, consistent with ordered rotation. These early results are encouraging, demonstrating that APEX can efficiently detect CO in nearby radio galaxies. We therefore plan to use APEX to obtain CO spectroscopy for all our southern targets.
Key Words.:
galaxies:active – radio lines: galaxies1 Introduction
It is generally thought (see e.g. Heckman et al. Hetal86 (1986); Baum et al. Betal92 (1992)) that powerful radio galaxies (typically Fanaroff-Riley type II or FR II, Fanaroff & Riley FR74 (1974)) are triggered by mergers or collisions with gas-rich galaxies. During the merger event, part of the gas can be transported to the central region of the merging system, where it may trigger a starburst, and, if it loses sufficient angular momentum, feed the AGN. The radio jets may then be powered either from the gravitational energy released during the accretion process, or by electromagnetic extraction of the spin energy of the black hole (Blandford & Znajek BZ (1977)), which also requires an accretion flow to anchor a magnetic field.
On the other hand, it has been suggested recently that accretion in low luminosity (or more generally low excitation) radio galaxies, often, but not exclusively, Fanaroff-Riley type I or FR I, may occur directly from the hot phase of the interstellar medium (Allen et al. Alletal06 (2006); Evans et al. Evetal08 (2008)). Hot ( K) plasma is observed to be ubiquitous in radio-galaxy nuclei, and Evans et al. (Evetal08 (2008)) suggest that the gravitational energy released if accretion occurs at the Bondi rate may be sufficient to power the jets in FR I radio galaxies. It is unclear whether this rate is relevant, however, since it assumes spherically symmetric accretion and takes no account of the need for angular momentum loss. The accretion rate in the vicinity of the black hole cannot be estimated directly and may be much lower. In any case, McNamara et al. (McN2010 (2010)) find that accretion at the Bondi rate is generally unable to power the jets in brightest cluster galaxies and argue that electromagnetic extraction of the black hole spin energy is required.
An alternative fuel source is cold gas, which is often present in large amounts, and is detectable via emission and absorption by dust, HI and CO. This cold gas quite often comes in the form of dusty disks, as can be clearly seen in high resolution HST images (Capetti et al. Cetal00 (2000); Verdoes-Kleijn VK99 (1999); de Ruiter et al. deRetal02 (2002)). Dust is observed in 53% of the B2 sample of nearby radio galaxies (mostly FR I) and the dust mass is correlated with radio power (de Ruiter et al. deRetal02 (2002)). Similar results have been found for a sample of nearby 3CR radio galaxies. At least 30% of the sources show evidence for dust absorption. Dust in FR I radio galaxies is generally situated in well defined disks on small ( kpc) scales, and the radio source axis tends to lie nearly perpendicular to the dust disk. Very interestingly FR I galaxies have derived dust masses that are typically larger than the dust masses found in a matched sample of radio-quiet ellipticals (de Koff et al. deK00 (2000)). If the mass of dust and cold gas are also correlated, as seems plausible, then this association argues that accretion of cold gas may indeed power the radio jets.
If accretion of (initially) cold gas is the dominant fuelling mechanism, then we should be able to detect the gas in every low-excitation radio galaxy. In normal, extended, FR I sources very little HI gas is found close to the nucleus (certainly no more than in early-type galaxies of similar mass selected without reference to radio emission); in most cases only upper limits M are available (Emonts et al. Emetal10 (2010)). On the other hand, we know from several observing programmes that CO observations of nearby radio galaxies produce a high detection rate (see e.g. Prandoni et al. Pretal07 (2007); Ocaña Flaquer et al. Ocetal10 (2010)). Lim et al. (Letal00 (2000)) detected 12CO() and 12CO() emission from the FR I radio galaxies 3C 31 and 264 with the IRAM 30m Telescope and established that the line profiles indicate disk rotation; this appears to be a common property (Prandoni et al. Pretal07 (2007)).
The derived masses of molecular gas are certainly adequate to power the jets in at least some cases. For example, the well-studied FR I radio galaxy 3C 31 has an estimated jet power erg s-1 (Laing & Bridle LB (2002)), while the lifetime of the source must be years, where is the advance velocity of the tails. This suggests that the lifetime of 3C31 may be appreciably longer than those of FR II sources ( years; Blundell & Rawlings BR00 (2000)) and therefore that a higher molecular gas mass may be needed to fuel it, despite its lower radio luminosity. For an assumed conversion efficiency from the rate of gravitational energy release to jet power, the required mass accretion rate for 3C 31 is if and the molecular gas mass needed to fuel the AGN for years would be (assuming a constant accretion rate). The mass of molecular gas associated with 3C 31 is (Lim et al. Letal00 (2000)). This implies that, even if the efficiency is significantly smaller or the advance speed is , there is ample fuel for any reasonable source lifetime. 3C 31 is a luminous FR I radio galaxy, and correspondingly smaller amounts of cold gas would be required to fuel less powerful sources, assuming efficient accretion. Current mass upper limits (of the order of ; e.g. Fig. 3) do not rule out the possibility that cool gas is the dominant fuelling mechanism in low luminosity radio galaxies, as well as in their brighter counterparts. If this is the case, we expect to detect CO in virtually all radio galaxies, provided that CO spectroscopy goes deep enough.
Only high-resolution imaging of CO or other molecular lines would allow us to probe the dynamics of the cool gas directly, to determine if and how much of it is infalling, and what kind of motions (rotation, non-circular, radial in- or out-flows) are present. Interferometry at mm wavelengths is challenging with current instrumentation, and has been possible for only a few objects. Interferometric observations of 3C 31 by Okuda et al. (Oetal05 (2005)) showed that the CO coincides spatially with the dust disk observed by HST (Martel et al. Metal99 (1999)) and is in ordered rotation. These authors suggest that the cold gas is in stable orbits, in which case the actual accretion rate may be very low.
ALMA, thanks to its combination of angular resolution and sensitivity, will give us a unique opportunity to assess the cold accretion scenario in low luminosity radio galaxies, by directly imaging the gas on scales 10 – 100 pc and determining its dynamical state. Very little is known about cold gas in Southern galaxies, however, with very few objects observed in CO.
In this paper we report the results of pilot APEX-1 CO line observations of Southern radio galaxies. In Sect. 2 the Southern radio galaxy sample is presented with particular emphasis on the three sources discussed in this paper. In Sect. 3 the APEX line measurements are described, while in Sect. 4 a brief discussion of the results is reported. In the following we assume a standard -CDM cosmology with km s-1 Mpc-1.
2 Sample Description
| Source | vres | v | vFWHM | |||||||
|---|---|---|---|---|---|---|---|---|---|---|
| (min) | (K) | (km s-1) | (mK) | (K km s-1) | (km s-1) | (M) | ||||
| PKS0336-35 | [NGC 1399] | 0.0048 | 108.2 | 272 | 40 | 1 | 0.20 | 127 | 2.1 | 7.47 |
| 120 | 0.35 | 0.39 | 365 | 3.3 | 7.75 | |||||
| PKS1107-372 | [NGC 3557] | 0.0102 | 18.4 | 316 | 40 | 2 | 1.52 | 248 | 3.5 | 9.02 |
| PKS1333-33 | [IC 4296] | 0.0125 | 37.4 | 315 | 40 | 1 | ||||
The primary radio-galaxy samples (3C, B2) for which CO observations have been made are difficult to observe from the ALMA site. We have therefore built a volume limited sample of low luminosity radio galaxies in the Southern sky, for which we intend to obtain complete single-dish CO coverage in order to prepare for ALMA imaging. This sample has been defined in a very similar way to the Northern sample we extracted from the B2 radio-source catalogue and followed up in CO with the IRAM 30m telescope (Prandoni et al. Pretal07 (2007)).
The parent sample is selected from the Parkes 2.7-GHz survey, in the declination range , as described by Ekers et al. (Eketal89 (1989)). It has a radio flux-density limit of 0.25 Jy at 2.7 GHz and an optical limit of , and consists of 191 radio galaxies. We extracted those sources with redshifts which are associated with elliptical galaxies. The resulting 11 objects thus form a small, but volume-limited and complete subset of the Ekers et al. (Eketal89 (1989)) sample. All eleven sources of the volume-limited sample are of the FR I type. The subset is quite similar to the sample of 3C and B2 radio galaxies in the Northern Hemisphere, which consists of 23 low luminosity radio sources associated with elliptical galaxies at ; 16 of these have been observed in CO with the IRAM 30m telescope (Prandoni et al. Pretal07 (2007)).
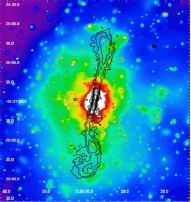
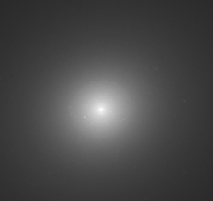
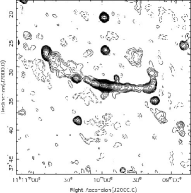
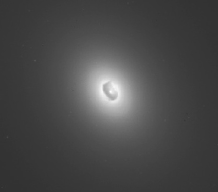
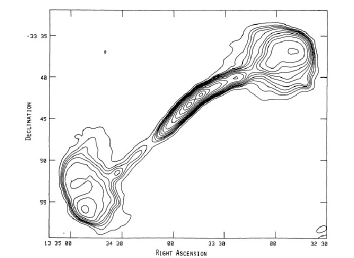
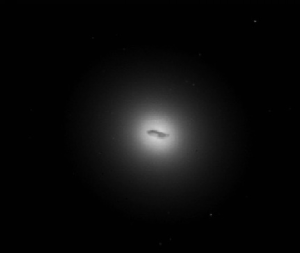
As part of the science verification programme of the APEX-1 receiver, three of the eleven sources in our subsample were selected for observation in the 12CO() line. They were: PKS0336-35 (NGC 1399), PKS1107-372 (NGC 3557), and PKS1333-33 (IC 4296). All three are radio sources with twin radio jets (see Fig. 1, left panels), and had been observed with the WPFC2 of the Hubble Space Telescope (Lauer et al. Lauetal05 (2005)). While no trace of dust was found in the nucleus of NGC 1399, the other two show prominent dusty disks around their respective nuclei (see Fig. 1, right panels).
A fourth sample member, PKS0320-37 (Fornax A) was imaged in 12CO() and 12CO() by Horellou et al. (Horetal01 (2001)); it shows a complex dust structure in HST observations (Grillmair et al. Gretal99 (1986)).
No CO imaging is available for the remaining sample members.

3 Line Observations and Measurements
We used the APEX-1 SHeFI receiver connected to the FFTS backend to search for emission in the (2-1) transition of 12CO. Low luminosity radio galaxies have 12CO() line widths typically spanning km s-1 FWHM (Prandoni et al. Pretal07 (2007)) and are therefore fully sampled by a 1-GHz wide individual unit of the FFTS backend (covering a total velocity range of 1300 km s-1 at 230 GHz). The 30 arcsec FWHM beam probes the presence of molecular gas in the galaxy cores (the inner 3 – 7 kpc, depending on the redshift), allowing a direct comparison with dust structures on similar scales imaged with HST.
The observations were carried out in Summer 2008 and the data were reduced with the CLASS package. Scans severely affected by ripples and/or noisy baselines were removed and first-order baselines were subtracted. The noise levels obtained were typically mK () at a reference smoothing width of v km s-1. Line fluxes were measured by numerically integrating over the channels in the line profile. Line widths were measured as full widths at half power. A source was considered detected when the 12CO() emission line had , and tentatively detected when . In case of non detections, upper limits were calculated, following Evans et al. (Eetal05 (2005)), through the relation
| (1) |
where is the mean FWHM line width for radio galaxies (in our case assumed equal to 500 km s-1 , see Prandoni et al. Pretal07 (2007), Evans et al. Eetal05 (2005)); is the velocity resolution (in our case km s-1 after smoothing) and
| (2) |
where is the channel width ( MHz, after smoothing) in Hz and is the on-source integration time in seconds.
H2 molecular masses were derived using the same relation as used by Gordon et al. (GBC92 (1992)) and later by Lim et al. (Letal00 (2000)), but modified for a -CDM cosmology and km s-1 Mpc-1. We assumed an aperture efficiency for 230-GHz APEX observations.
A summary of our CO line measurements is given in Table 1, where, for each source, we list the source redshift (); the on-source integration time (), after flagging data affected by poor baselines and/or ripples; the mean system temperature during the observations (); the channel width after smoothing (vres) and the corresponding noise level in the line spectra (); the line integrated flux (); the FWHM line width (); the line signal to noise () and the molecular gas mass (). The final CO line spectra are shown in Fig. 2.
NGC 3557 was easily detected at a channel resolution of v km s-1, while for IC 4296 (the source at highest redshift) only an upper limit could be derived. In the case of NGC 1399 only the higher of the two peaks in the spectrum (Fig. 2, top left) has a signal-to-noise ratio and can be considered tentatively detected. However the systemic velocity of the galaxy falls between the two peak. By increasing the smoothing to v km s-1 (Fig. 2, top right), we can reduce the noise level to mK and get a clear detection over a wider velocity range. In this case we obtain K km s-1, km s-1, and (see Table 1). NGC 1399 does not show detectable dust features in the HST image, and the presence of CO is particularly interesting in this case. There is some evidence for a double-horned structure in the spectrum of NGC 3557, although the statistical significance is low (Fig. 2, bottom left). If confirmed, the presence of CO in ordered rotation would be consistent with the strong dusty disk seen in HST observations (see Fig. 1). A very marked dusty disk is present even in IC4̇296 (see Fig. 1) and we suspect that a longer observation ( min), possibly with better weather conditions ( K), will lead to a detection.
4 Discussion and Conclusions

The H2 masses of the four low-luminosity southern radio galaxies observed so far (including Fornax A) are plotted against redshift as magenta symbols in Fig. 3, together with the 23 B2 radio galaxies (blue symbols, Prandoni et al. Pretal07 (2007)), the brighter 3C radio galaxies studied by Lim et al. (Letal03 (2003); green symbols) and the UGC galaxies with radio jets studied by Leon et al. (Leonetal03 (2003); red symbols). We note that the three northern samples are partially overlapping and that some upper limits have have been updated using recent measurements by Ocaña Flacquer et al. (Ocetal10 (2010)). The deepest CO line observations with existing facilities have detection limits mK, as indicated by the solid lines in Fig. 3. CO detection rates vary between 45% and 65% for the three samples, but these differences are not significant once account is taken of the relative sensitivities and redshift distributions. We find that molecular gas masses are very similar over the full range of redshift (and, implicitly, radio power) for the combined samples, spanning the range M⊙, with upper limits varying from M⊙ to M⊙, depending on distance. These values are consistent with the hypothesis that the jets of low-luminosity (FR I) radio galaxies can be powered by accretion of cold gas, but there is a large scatter in molecular gas mass at a given radio luminosity, as also found by McNamara et al. (McN2010 (2010)) for brightest cluster galaxies.
Seven examples of CO detections without visible dust, including NGC 1399, are plotted in Fig. 3. The inferred masses range from to (Ocaña Flaquer et al. Ocetal10 (2010); this paper). It is therefore not yet clear whether there is a significant difference between the masses of radio galaxies with and without dust. Nevertheless CO line detections are frequent in radio galaxies with dust, even more when the dust is in form of nuclear disks. In the sample of 23 elliptical B2 radio galaxies with (Prandoni et al. Pretal07 (2007)), seventeen objects have detailed optical imaging (mostly with HST), and ten show clear dusty disks. CO line observations are available for nine of these objects, and (7/9) were detected. We also find that almost one half of the objects with dusty disks detected in CO have double-horned line profiles. The double-horned CO line profiles characteristic of ordered rotation (indicated by the crosses in Fig.3) occur over a wide range of molecular gas masses. Since many of the other detections are still marginal, it is possible that the molecular gas in the majority of low-luminosity radio galaxies is in the form of kpc-scale nuclear disks or rings, cospatial with the dust and in ordered rotation. There are exceptions, however: Fornax A represents a more complex case where the CO shows a multi-component line profile associated with the complex dust structures visible in HST images. The most probable scenario is that the gas comes from the accretion of one or more small gas-rich galaxies (Horellou et al. Horetal01 (2001)). The fact that we are finding CO in radio galaxies with no detectable dust may suggest that in (at least some) objects the bulk of the gas is in a cold (molecular) phase, supporting the idea that virtually all radio galaxies may be fuelled by cold gas.
These results raise a number of questions which can be answered by observations at optical, mid-infrared and mm wavelengths, and in particular by sensitive, high-resolution imaging with ALMA, as follows.
-
1.
Is the molecular gas in disks or in rings with well-defined inner edges?
-
2.
Is the majority of the gas in stable orbits?
-
3.
What is the evidence for non-circular motions, especially infall?
-
4.
Where does the gas come from: is its angular momentum consistent with that of the stellar population or different, indicating an external origin?
-
5.
Do the molecular and ionized gas distributions have the same spatial distributions and kinematics? Does the gas become progressively hotter and then ionized closer to the nucleus?
-
6.
Is there evidence for ongoing or recently-completed star formation?
In conclusion, we have shown that observations with APEX in the 230-GHz band can efficiently detect CO in low-luminosity radio galaxies. We plan to use APEX to obtain CO spectroscopy for the entire southern sample and to build up a target list for imaging with ALMA.
Acknowledgements.
The authors thank the APEX team, which successfully overcame a number of technical obstacles to obtain the APEX-1 science verification observations presented here. The authors would like to thank the referee, whose suggestions significantly improved the quality of the paper.References
- (1) Allen, S.W., Dunn, R.J.H., Fabian, A.C., Taylor, G.B., Reynolds, C.S. 2006, MNRAS, 372, 21
- (2) Baum, S.A., Heckman, T.M., & van Breugel, W. 1992, ApJ, 389, 208
- (3) Blandford, R. D., & Znajek, R. 1977, MNRAS, 179, 433
- (4) Blundell, K.M., & Rawlings, S. 2000, AJ, 119, 1111
- (5) Capetti, A., de Ruiter, H.R., Fanti, R., et al. 2000, A&A, 362, 871
- (6) Condon, J. J., Cotton, W. D., Greisen, E. W., et al. 1998, AJ, 115, 1693
- (7) de Koff, S., Best, P., Baum, S.A., et al. 2000, ApJS, 129, 33
- (8) de Ruiter, H.R., Parma, P., Capetti, A., Fanti R., & Morganti R. 2002, A&A, 396, 857
- (9) Ekers, R.D., Wall, J.V., Shaver, P.A., et al. 1989, MNRAS, 236, 737
- (10) Emonts, B.H.C., Morganti, R., Struve, C. et al. 2010, MNRAS, 406, 987
- (11) Evans, A.S., Mazzarella, J.M., Surace, J.A., et al. 2005, ApJS, 159, 197
- (12) Evans, D.A., Hardcastle, M.J., & Croston, J.H. 2008, ASPC, 386, 161
- (13) Fanaroff, B.L., & Riley, J.M. 1974, MNRAS, 167, 31P
- (14) Gordon, M.A., Baars, J.W.M., & Cocke, W.J. 1992, A&A, 264, 337
- (15) Grillmair, C.J., Forbes, D.A., Brodie, J.P., & Elson, R.A.W 1999, AJ, 117, 167
- (16) Heckman, T.M., Smith, E.P., Baum, S.A., et al. 1986, ApJ, 311, 526
- (17) Horellou, C., Black, J.H., van Gorkom, J.H., et al. 2001, A&A, 376, 837
- (18) Killeen, N.E.B., Bicknell, G.V., & Ekers, R.D. 1986, ApJ, 302, 306
- (19) Laing, R. A., & Bridle, A. H. 2002, MNRAS, 336, 1161
- (20) Lauer, T.R., Faber, S.M., Gebhardst, K., et al. 2005, AJ, 129, 2138
- (21) Leon, S., Lim, J., Combes, F., & van-Trung, D. 2003, ASP Conf. Series, 290, 525
- (22) Lim, J., Leon, S., Combes, F., & van-Trung, D. 2000, ApJ, 545, L93
- (23) Lim, J., Leon, S., Combes, F., & van-Trung, D. 2003, ASP Conf. Ser., 290, 525
- (24) Martel, A.R., Baum S.A., Sparks W.B., et al. 1999, ApJS, 122, 81
- (25) McNamara, B. R., Rohanizadegan, M., & Nulsen, P. E. J. 2010, ApJ (submitted), arXiv:1007.1227
- (26) Ocaña Flaquer, B., Leon, T.S, Combes, F., & Lim, J. 2010, A&A, in press (astroph.1001.5009)
- (27) Okuda, T., Kohno, K., Iguchi, S., & Nakanisji, K. 2005, ApJ, 620, 673
- (28) Prandoni, I., Laing, R.A., Parma, P., et al. 2007, NewAR, 51, 43
- (29) Shurkin, K., Dunn, R.J.H., Gentile, G., Taylor, G.B., & Allen, S.W. 2008, MNRAS, 383, 923
- (30) Verdoes-Kleijn, G. 1999, AJ, 118, 259