Two distinct quasiparticle inelastic scattering rates in the model and their relevance for high- cuprates superconductors
Abstract
The recent findings about two distinct quasiparticle inelastic scattering rates in angle-dependent magnetoresistance (ADMR) experiments in overdoped high- cuprates superconductors have motivated many discussions related to the link between superconductivity, pseudogap, and transport properties in these materials. After computing dynamical self-energy corrections in the framework of the model the inelastic scattering rate was introduced as usual. Two distinct scattering rates were obtained showing the main features observed in ADMR experiments. Predictions for underdoped cuprates are discussed. The implicances of these two scattering rates on the resistivity were also studied as a function of doping and temperature and confronted with experimental measurements.
pacs:
74.72.-h, 71.10.Fd, 74.25.F-, 75.47.-mI Introduction
The way in which superconductivity (SC) occurs in high- cuprates challenges old concepts in condensed matter physics. The puzzling doping dome-shape for the superconducting critical temperature () is tied to the anomalous properties observed in the normal state. In underdoped (UD) the decay of with decreasing doping is correlated to the increasing pseudogap (PG) feature observed above . The so-called PG phase shows properties which are not expected to occur in Fermi liquids.timusk99 The anomalous properties observed in UD weaken with increasing doping towards overdoped (OD); however whether the conventional Fermi liquid (FL) applies in this doping region is controversial. Recent angle-dependent magnetoresistance (ADMR) experiments in OD Tl2201 brought insights to this discussion.abdel06 ; abdel07 ; french09 These experiments, differently to the resistivity, have the advantage to separate the scattering rate () in two distinct components. While one component is isotropic () on the Fermi surface (FS) and rather constant with doping, the other one is strongly anisotropic () and resembles the anisotropy of the PG showing maximum values near the antinode. Moreover, decreases with increasing doping and vanishes in highly OD samples. These and others experiments have been recently interpreted (see Ref.[taillefer10, ] and references therein) in terms of that the PG phase is distint to SC, ended at the quatum critical point (QCP), and its fluctuations as the responsible for pairing and transport properties. The present paper shows that two scattering rates, with similar characteristics to those observed in ADMR experiments, are obtained from the model.
The paper is organized as follows. In Sec. II, a summary of the method is given. The relationship between dynamical self-enegry contributions and the two inelastic scattering rates is shown. Sec. III contains the results. In subsection A results for high doping values are presented and compared with available experiments in this doping region. In subsection B predictions for low doping are studied and discussed. In subsection C the implications of the two obtained scattering rates on the resistivity are studied and confronted with measurements. Discussion and conclusion are given in Sec. IV.
II Summary of the formalism: Inelastic scattering rate
In leading order of large expansion ( is the number of spin components) the model predicts a phase diagram with close similarities to the phase diagram of hole doped cuprates.cappelluti99 The pseudogap, which is associated to the flux-phase (FP),affleck88 competes and coexists with SC. The large- mean-field treatment of the model yields a quasiparticle (QP) dispersion
where the parameters , and are the hopping between nearest-neighbor, next nearest-neighbor and the nearest-neighbor Heisenberg coupling respectively. The contribution to the mean-field band and the chemical potential must be obtained self-consistentlygreco04 from
| (2) |
and
| (3) |
where is the Fermi function, the doping away from half-filling and, the number of sites.
Hereafter, , , suitable for cuprates, are used and the lattice constant of the square lattice is considered as length unit.
In this approach, the mean-field homogeneous state becomes unstable when the static () flux susceptibility
| (4) |
diverges.greco08 In Eq.(4) is an electronic polarizability calculated with a form factor .
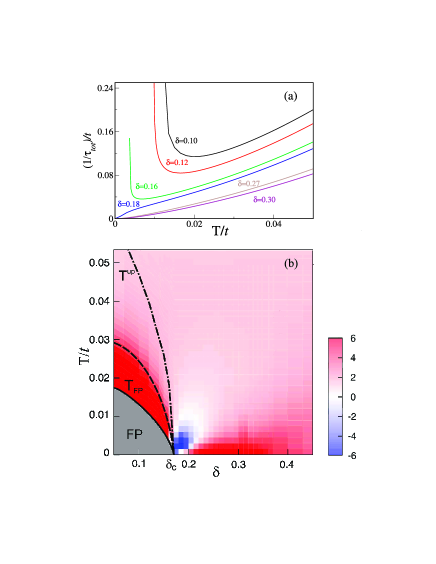
In Fig.5(b), disregarding SC, the solid line shows, in the doping-temperature () plane, the temperature which indicates the onset of FP instability. At a flux-mode () reaches freezing the FP.greco08 At a phase transition occurs at the QCP placed at the critical doping (Fig.5(b)). Since the instability takes place at the form factor transforms into which indicates the -wave character of the FP. Although the relevance of the FP for the physical case , for instance in the form of a phase without long-range but strong -wave short-range order, is under dispute,leung00 the FP scenario possesses the main properties to be identified with the phenomenological CDW proposal.chakravarty01
For discussing the quasiparticle inelastic scattering rate it is necessary to calculate self-energy corrections collecting fluctuations beyond mean field. As showed in Ref.[bejas06, ] the self-energy contains contributions from six different channels and their mixing: The usual charge channel named , a non-double-occupancy channel named and, four charge channels driven by . However, as discussed in Ref.[greco08, ] and summarized below, the relevant contributions to can be written as
| (5) |
where
| (6) | |||||
and
| (7) | |||||
In the above expressions, and is the Bose function.
The physical meaning of Eq.(5) is as follows. corresponds to the usual charge () sector, non-double-occupancy () sector and the mixing of both. For there is no important influence of -contributions in showing that the usual charge sector is weakly coupled to the -channels. On the other hand, -channels play an important role at low energy and low doping in the proximity to the flux phase instability. (Eq.(7)) is obtained after projecting the self-energy on the eigenvector corresponding to the flux instability. Eq.(7) shows the coupling between carriers and FP fluctuations. For the explicit expressions of , and see Ref.[bejas06, ].
Motivated from above discussion and the results presented below the two scattering rates and (discussed in the introduction) are associated to and , respectively, as follows
| (8) |
| (9) |
where is a momentum on the FS.
III Results
III.1 Overdoped results: Comparison with ADMR experiments
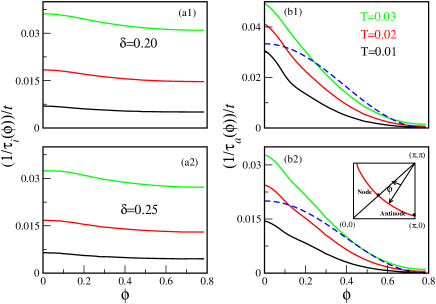
Fig.1 shows, for two dopings and different temperatures, and on the FS labeled by the angle ranging from the antinode () to the node () (see inset in panel (b2)). Note that and lay in OD as the samples studied in ADMR experiments. Similarly to the behavior observed in ADMRabdel06 ; abdel07 is very isotropic on the FS and is strongly anisotropic showing the maximum near the antinode. Note that follows, approximately, the proposedabdel06 ; abdel07 shape (dashed line in panels (b1) and (b2)). Ossadnik et al. (Ref.[ossadnik08, ]) have shown similar results for moderate onsite Coulomb repulsion on the Hubbard model in one loop renormalization group approximation.
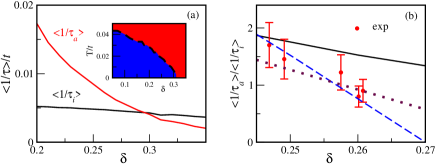
In Fig.2(a), and (where means the average on the FS) are plotted as a function of doping for a fixed temperature . This temperature is close to the reported in Fig.2 of Ref.[abdel07, ] if the accepted value is considered. As in the experiments, is only weakly doping dependent and, is strongly decreasing with increasing doping. Inset of Fig.2(a) shows, in the plane, that dominates over at low doping and low temperatures (blue region) while, dominates on the red region. In Fig.2(b), the ratio at is plotted as a function of doping (solid line) and compared with the experimental data (solid circles) taken from Ref.[abdel07, ]. Although the experimental data seem to decay faster than in the theory, both results show a similar trend with increasing doping. Note that while theory predicts that becomes smaller than for (see also Fig.2 (a)), the same occurs in the experiment for . Beyond a quantitative comparison it is important to discuss about the physical interpretation. In Refs.[abdel07, ; taillefer10, ] it was claimed that vanishes just at the doping value where SC emerges from OD following dashed line in Fig.2(b), concluding that the source for SC and for the anisotropic scattering rate is the same and associated to PG fluctuations. In present case is caused by the scattering between carriers and short-range FP fluctuations. Thus, since proves the proximity to the PG via the coupling between carriers and the soft flux-mode of momentum , is strongly anisotropic on the FS and decreases with increasing doping beyond the QCP. However, SC comes from the instantaneous (no bosonic glue) short-range antiferromagnetic exchange cappelluti99 ; anderson07 leading to a different origin for SC and the scattering rate. Finally, it is worth to mention that considering the error bars (Fig.2(b)) could also decay following, for instance, dotted line which is nearly paralel to the theoretical predicted solid line.
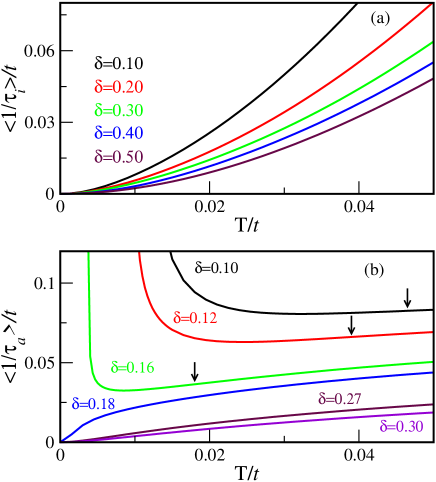
In Fig. 3 the temperature behavior of both scattering rates is shown. At low temperature with (Fig. 3(a)) for all dopings. A similar quadratic temperature behavior for was observed for the isotropic scattering rate in OD Tl2201.abdel06 ; french09 In contrast, (Fig. 3(b)) shows, at high dopings (see results for and ), a different behavior: At low temperature, with which is close to the -linear law discussed in Refs.[abdel06, ; french09, ] for similar dopings. Therefore, it is concluded that, besides the anisotroy on the FS, at high doping the temperature dependence for both, and , agrees also, qualitatively, with the experiment.
III.2 Underdoped results: Possible predictions
To the knowledge of the authors there are no ADMR experiments in the UD region, however for low doping () the present approach shows predictions which in principle can be tested by ADMR experiments if they are possible. With decreasing temperature shows an upturn below a given temperature () indicated by arrows (see results for , and, in Fig.3(b)). increases with decreasing doping following the same trend (see dotted-dashed line in Fig.5(b)) than . Interestingly, although marks a smooth crossover and not a true phase transition, dotted-dashed line terminates at the QCP.
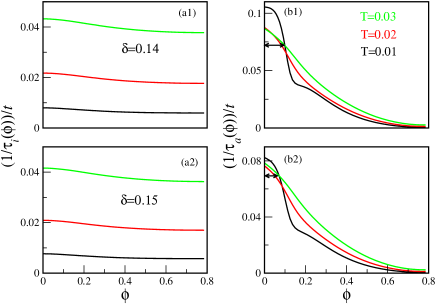
While for large dopings decreases with decreasing temperature (panels (b1) and (b2) in Fig.1), for (Fig. 4(b1)) and (Fig. 4(b2)), shows a reentrant behavior near the antinode. It is important to mention that the length from the antinode of the re-entrant (marked in Fig. 4(b1) and (b2)) expands with decreasing temperature and doping resembling the behavior of the Fermi-arcs observed in angle-resolved photoemission spectroscopynorman98 (ARPES), i.e., when larger is the re-entrant length shorter the arcs. See last section for further discussion about a possible link between ADMR and ARPES experiments.
Finally, Fig.4 (a1) and (a2) together with results for in Fig. 3(a) show that the evolution of from UD to OD is rather smooth.
III.3 Resistivity
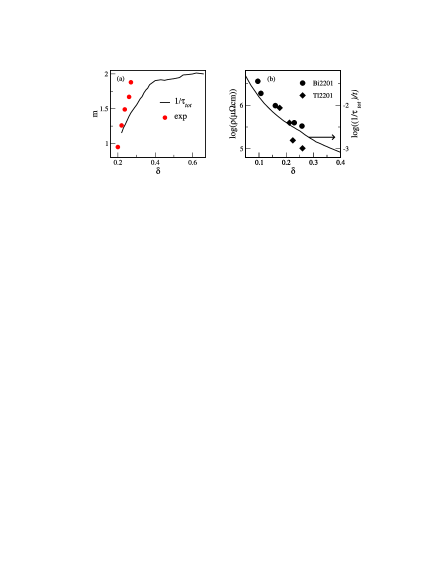
In spite of intense studies the origin of the resistivity in cuprates is far from closed. Whether the resistivity is composed by two different contributions with different temperature and doping dependence,cooper09 or a single contribution is currently under dispute.hussey08 Therefore, based on present results, it is worth to discuss a possible connection between the two scattering rates observed in ADMR and resistivity measurements. In first approximation where and is the plasma frequency. Using the obtained results for as a function of temperature (Fig.5(a)) a curvature mapping () in the plane is presented in Fig.5(b) where positive (negative) curvature is indicated in red (blue). It is possible to divide the behavior of in two regimes. (a) : since at low temperatures dominates (inset in Fig. 2(a)), an upturn also occurs for (Fig. 5(a)). Note that for the upturn is shifted to lower temperatures respect to the upturn of the isolated being more pronounced below dashed line in Fig. 5(b). A similar upturn for the resistivity was found experimentally.ando04 ; daou09 While Ando et al., for BSLCO, LSCO, and YBCO found a weak and negative curvature above the upturn temperature, Daou et al., reported a -linear law for Nd-LSCO. In present case with indicates a weak positive curvature (light red region) closer to the results of Ref.[daou09, ]. At this point it is important to make the following remark. As discussed above the upturn is caused by the interaction between quasiparticles and short-range fluctuations of the FP. If long-range order sets in at , in the context of present approximation is expected to diverge at . This divergence is due to the fact that FP fluctuations were not self-consistently included in .note The inclusion of these fluctuations would weaken the upturn leading, for , to a CDW metal. (b) : close to and at low temperature shows a downturn (blue region in Fig. 5(b)) which fades out, with increasing temperature and doping, faster than in experiment.ando04 For larger dopings shows a positive -curvature. For low temperature could be approximated by a single power law . With increasing doping increases from near to at high doping (solid line in Fig. 6(a)). Similar behavior is widely discussed in the literature hussey08 and interpreted as the emergence of the FL in OD. The experimental values for (solid circles) taken from Ref.[kubo91, ] were included for comparison, showing a rather good agreement between theory and experiment (see also Ref.[naqib03, ]).
The doping dependence of the resistivity is also important. In Fig.6(b) the for Bi2201kondo06 (circles) and for Tl2201ma06 (diamonds) is plotted as a function of doping (left axis) together with (right axis) at . This figure shows that both, and , follow similar doping dependence suggesting that the scattering rate is the main cause for the doping behavior of the resistivity. Comparing the scales of right and left axis it is possible to see that they are shifted by a constant , since , then which is somewhat lower but on the order of the experimenttimusk99 and also consistent with present dispersion (Eq.(1)).
Finally, the resistivity for the high doping case is estimated. Using , has the following similarities with measurements in high OD LSCO:nakamae03 (a) For , with , while for higher temperatures . (b) The quadratic coefficient is which is on the order of magnitude reported in Ref.[nakamae03, ]. This high value of , which is about two orders of magnitude larger than the expected value for conventional metals, supports the interpretation that, even at very high dopings, cuprates must be considered in the strong-coupling regime.nakamae03
In summary, considering that the experimental behavior of the resistivity is rather controversialhussey08 and no existing theory describing systematically all observed features, present results can be considered satisfactory.
IV Discussion and conclusion
In the framework of the model in large approximation, dynamical self-energy corrections were computed beyond mean field. The existence of two distinct components for the quasiparticle inelastic scattering rate was shown. While one component is very anisotropic on the FS and disappears at high dopings, the other component is isotropic on the FS and rather constant with doping. In OD, the two components behave qualitatively similar to those observed in ADMR experiments. In addition, predictions for UD region which, in principle, can be tested in ADMR experiments were discussed.
The doping and temperature behavior of the estimated resistivity has similarities with the corresponding transport measurements concluding that the picture presented here may contribute on discussions about the origin of the resistivity and its possible link to the findings observed in ADMR experiments.
It is known that the large- expansion weakens antiferromagnetic fluctuations respect to charge fluctuations. However, it is important to mention that ADMR experiments were performed in the OD region where the large- approach is expected to be more reliable. The observed agreement between experiments and theory is interpreted here as indication that, at least, part of the physics is captured by present theory. For instance, for high doping present calculation predicts as observed in the experiments. Importantly, besides the temperature behavior, an unusual high value for the coefficient is obtained in agreement with measurements. This is interpreted as an indication that, even in OD, strong coupling effects occur in cuprates.
Before closing, a possible link between ADMR and ARPES experiments is discussed. It was recently shown that (a) , which proves the proximity to the PG, dominates at low doping and low energy leading to Fermi-arcs effects.greco09 (b) , which contains non-double-occupancy effects of the model, dominates at high energy leading to high energy featuresfoussats08 which resemble the waterfall effects observed in ARPES.graf07 Thus, present paper suggests also a possible common origin for the features seen in ADMR and ARPES experiments.
Acknowledgments
The authors thank to M. Bejas, A. Foussats, and H. Parent for valuable discussions.
References
- (1) T. Timusk and B. Statt, Rep. Prog. Phys. 62, 61 (1999).
- (2) M. Abdel-Jawad et al., Nature Phys. 2, 821 (2006).
- (3) M. Abdel-Jawad et al., Phys. Rev. Lett. 99, 107002 (2007).
- (4) M.M. J. French et al, New J. Phys. 11, 055057 (2009).
- (5) L. Taillefer, Annual Review of Condensed Matter Physics 1, 51 (2010).
- (6) E. Cappelluti and R. Zeyher, Phys. Rev. B 59, 6475 (1999).
- (7) I. Affleck and J.B. Marston, Phys. Rev. B 37, 3774 (1988).
- (8) A. Foussats and A. Greco, Phys. Rev. B 70, 205123 (2004).
- (9) A. Greco, Phys. Rev. B 77, 092503 (2008).
- (10) P. W. Leung, Phys. Rev. B 62, R6112 (2000). A. Macridin, M. Jarrell, and Th. Maier, Phys. Rev. B 70, 113105 (2004).
- (11) S. Chakravarty, R. B. Laughlin, D.K. Morr, and C. Nayak, Phys. Rev. B 63, 094503 (2001).
- (12) M. Bejas, A. Greco, and A. Foussats, Phys. Rev. B 73, 245104 (2006).
- (13) M. Ossadnik, C. Honerkamp, T. M. Rice, and M. Sigrist, Phys. Rev. Lett. 101, 256405 (2008).
- (14) P.W. Anderson, Science 316, 1705 (2007).
- (15) M.R. Norman et al., Nature 392, 157 (1998). A. Kanigel et al., Nat. Phys. 2, 447 (2006).
- (16) R.A. Cooper et al., Science 323, 603 (2009).
- (17) N.E. Hussey, J. Phys.: Condens. Matter 20, 123201 (2008).
- (18) Y. Ando et al., Phys. Rev. Lett. 93,267001 (2004).
- (19) R. Daou et al., Nature Phys. 5, 31 (2009).
- (20) In , (Eq.(7)) proves the instability only via the flux-mode which reaches at . In this order, does not contain, self-consistently, self-energy effects which are beyond the scope of -expansion. As discussed in text these effects are expected to play a role only near .
- (21) Y. Kubo, Y. Shimakawa, T. Manako, and H. Igarashi, Phys. Rev. B 43, 7875 (1991).
- (22) S.H. Naqib, J.R. Cooper, J.L. Tallon, and C. Panagopoulos, Phys. C 387, 365 (2003).
- (23) T. Kondo, T. Takeuchi, S. Tsuda, and S. Shim, Phys. Rev. B 74, 224511 (2006).
- (24) Y.C. Ma and N.L. Wang, Phys. Rev. B 73, 144503 (2006)
- (25) S. Nakamae et al., Phys. Rev. B 68, 100502 (2003)
- (26) A. Greco, Phys. Rev. Lett. 103, 217001 (2009).
- (27) A. Foussats, A. Greco, and M. Bejas, Phys. Rev. B 78, 153110 (2008)
- (28) J. Graf et al., Phys. Rev. Lett. 98, 067004 (2007). W. Zhang el al., Phys. Rev. Lett. 101, 017002 (2008).