Modeling Dynamical Influence in Human Interaction111This research was sponsored by AFOSR under Award Number FA9550-10-1-0122 and ARL under Cooperative Agreement Number W911NF-09-2-0053. The views and conclusions contained in this document are those of the authors and should not be interpreted as representing the official policies, either expressed or implied, of AFOSR, ARL or the U.S. Government.
Abstract
How can we model influence between individuals in a social system, even when the network of interactions is unknown? In this article, we review the literature on the “influence model,” which utilizes independent time series to estimate how much the state of one actor affects the state of another actor in the system. We extend this model to incorporate dynamical parameters that allow us to infer how influence changes over time, and we provide three examples of how this model can be applied to simulated and real data. The results show that the model can recover known estimates of influence, it generates results that are consistent with other measures of social networks, and it allows us to uncover important shifts in the way states may be transmitted between actors at different points in time.
1 Introduction
The concept of influence is extraordinarily important in the natural sciences. The basic idea of influence is that an outcome in one entity can cause an outcome in another entity. Flip over the first domino, and the second domino will fall. If we understand exactly how two dominoes interact — how one domino influences another — and we know the initial state of the dominoes and how they are situated relative to one another, then we can predict the outcome of the whole system.
For decades, social scientists have also been interested in analyzing and understanding who influences whom in social systems [1, 2]. But the analogue with the physical world is not exact. In the social world, influence can be more complicated because internal states are often unobservable, intentional behavior can be strategic, and the situational context of specific interactions can change the effect one actor has on another. And even more challenging, actors can choose with whom they interact, which can confound efforts to infer influence from correlated behaviors between actors [3]. As a consequence, there has been tremendous interest in developing methods for better understanding the effect that networked interactions have on the spread of social behaviors and outcomes.
Social scientists have already carefully studied communication settings like group discussions to better understand the causal mechanisms that underlie influence [4], but recent advances in modern sensing systems such as sociometric badges [5] and cell phones [6] now provide valuable social behavioral signals from each individual at very high resolution in time and space. The challenge for those of us interested in signal processing is how to use this data to make better inferences about influence within social systems.
In this article we describe the “influence model” first articulated in [7] and the subsequent literature that has refined this approach. Similar definitions on influence in other literature include research on voting models in physics [8], cascade models in epidemiology [1], attitude influence in psychology [9] and information exchange models in economics [10]. The influence model is built on an explicit abstract definition of influence: an entity’s state is influenced by its network neighbors’ states and changes accordingly. Each entity in the network has a specifically defined strength of influence over every other entity in the network, and, equivalently, each relationship can be weighted according to this strength.
We believe that the influence model is a unique tool for social scientists because it can be applied to a wide range of social systems (including those where aggregates like organizations, states, and institutions can themselves be thought of as “actors” in a network). The influence model also enables researchers to infer interactions and dynamics when the network structure is unknown—all that is needed is information about time series signals from individual observations. And although this method is subject to the same limitations as any observational network study [11], the ordering of behaviors in time and social space makes it less likely that alternative mechanisms like selection effects and contextual heterogeneity can explain the patterns of influence ascertained by the model.
The rest of this article is organized in the following way. We first describe the influence model in Section 2 and previous works in Section 3. In Section 4 we introduce the dynamical influence model, a generalization of the influence model for changing network topology. We then discuss the inference algorithms in Section 5. In Section 6, we give specific examples of its ability to recover plausible and known influence pathways between entities in a network with real and artificial data.
2 Overview for the Influence Model
2.1 Entities in a Social System
We describe the influence model here, followed by a review on its history in Section 3. The model starts with a system of entities. We assume that each entity is associated with a finite set of possible states . At different time , each entity is in one of the states, denoted by . It is not necessary that each entity is associated with the same set of possible states. Some entities can have more or less states. However, to simplify our description, we assume that each entity’s latent state space is the same without loss of generality.
The state of each entity is not directly observable. However, as in the Hidden Markov Model (HMM), each entity emits a signal at time stamp based on the current latent state , following a conditional emission probability . The emission probability can either be multinomial or Gaussian for discrete and continuous cases respectively, exactly as in HMM literature [12].
It is important to note here that entities can be anything that has at least one state. For example, they could be people in group discussions who are in a “talking” state or a “silent” state. Or they could be geographical districts with variation in flu incidence that yields some in a “high incidence” state or a “low incidence” state. The fundamental question remains in any situation, does the state in one entity influence (cause a change) the state in another entity? It is therefore possible to apply the influence model to a wide range of contexts.
2.2 Influence between Entities
The influence model is composed of entities interacting and influencing each other. “Influence” is defined as the conditional dependence between each entity’s current state at time and the previous states of all entities at time . Therefore, intuitively, is influenced by all other entities.
An important implication of this Markovian assumption is that all effects from states at times earlier than are completely accounted for by incorporating all information from time . This does not mean that earlier times had no effect or were unimportant – it just means that their total effect is felt in the immediately-previous time period. And even path dependent processes (of which there are many in the social sciences) can operate this way, one time period at a time.
We now discuss the conditional probability:
| (1) |
Once we have , we naturally achieve a generative stochastic process. As in the coupled Markov Model [13], we can take a general combinatorial approach Eq. 1, and convert this model to an equivalent Hidden Markov Model (HMM), in which each different latent state combination of is represented by a unique state. Therefore, for a system with interacting entities, the equivalent HMM will have a latent state space of size , exponential to the number of entities in the system, which generates insurmountable computational challenges in real applications.
The influence model, on the other hand, uses a much simpler mixture approach with far fewer parameters. Entities influence the state of in the following way:
| (2) |
where is a matrix. ( represents the element at the -th row and the -th column of the matrix ) is row stochastic, i.e., each row of this matrix sums up to one. is modeled using a row stochastic matrix , so that , where represents the element at the -th row and -th column of matrix . The row stochastic matrix captures the influence from over , and is very similar to the transition matrix in the HMM literature [12].
Eq. 2 can be viewed as follows: all entities’ states at time will influence the state of entity at time . However, the strength of influence is different for different entities: the strength of over is captured by . As a result, the state distribution for entity at time is a combination of influence from all other entities weighted by their strength over . Such definition of influence from neighbor nodes is not unique, and it has been well studied in statistical physics and psychology as well[8, 9]. Because captures influence strength between any two entities, we refer to as the Influence Matrix.
Generally, for each entity , there are different transition matrices in the influence model to account for the influence dynamics between and . However, it can be simplified by replacing the different matrices with only two matrices and : , which captures the self-state transition; Empirically, in many systems an entity may influence other entities in the same manner. For instance, a strong politician always asks everyone to support his political view no matter who they are. Therefore, sometimes we can simplify the system by assuming .
2.3 Inference
The influence model is a generative model defined by parameters and the emission probabilities . As in most generative machine learning models, these parameters are not set by users, but they are automatically learned from observations . The inference algorithms for learning these parameters will be discussed in Section 4.
The influence model has two key advantages over other machine learning approaches. First, the number of parameters grows quadratically with the latent space size and linearly to the number of entities . As a result, the influence model is resistant to overfitting when training data is limited compared with other approaches [14].
Second, the model captures the tie strength between entities using a matrix . inferred by our model can be naturally treated as the adjacency matrix for a directed weighted graph between nodes. This key contribution connects the conditional probabilistic dependence to a weighted network topology. In fact, the most common usage for the influence model in the literature is to use to infer social structure [15, 16] .
3 Previous Applications of the Influence Model
The influence model has been applied to various social systems, particularly those that have been monitored by sociometric badges like those shown in Fig. 1. These badges are personal devices that collect individual behavioral data including audio, location, and movement. Early attempts to analyze data from these badges focused on questions revolving around group interaction and interpersonal influence.

The first application of the influence model [7] attempted to infer influence networks from audio recordings of a group discussion session with five individuals. The reseachers used audio features as observations and modeled the latent state space to be either “speaking” or “non-speaking”. They then used the model to infer the underlying pattern of interpersonal influence from the noisy signals measured directly from each individual and their interactions on turn taking.
An important question about these inferences relates to their validity: how do we know that the measure of influence is real? Another set of researchers applied the influence model to conversation data from sociometric badges on 23 individuals and showed that the influence strength between individuals learned by the model correlated extremely well with individual centrality in their social networks(with ) [16]. This evidence suggests that the influence matrix defined as the weights in the conditional dependence on states of other entities is an important measure for the social position of the individuals in real interaction data. In other words, even more abstract concepts related to influence like status or social hierarchy might be captured by the inferences of the influence model.
The model has also been applied to many other human interaction contexts [15]. For instance, researchers have used the influence model to understand the functional role (follower, orienteer, giver, seeker, etc) of each individual in the mission survival group discussion dataset[17]. They found that the inferred influence matrix helped them to achieve better classification accuracy compared with other approaches. The model has also been applied to the Reality Mining[6] cellphone sensor data. Using information from 80 MIT affiliates as observations and constraining the latent space of each individual to be binary “work” and “home”, researchers found that the influence matrix learned from this data matches well with the organizational relationship between individuals[14].
Recently the influence model has been extended to a variety of systems, including traffic patterns [18] and flu outbreaks [19]. But more importantly, there have been methodological advances that allow the model to incorporate dynamic changes in the influence matrix itself[19]. This new approach, the Dynamical Influence Model, is a generalization of the inference model, and is discussed in the following section.
Related approaches have utilized Bayesian networks to understand and process social interaction time series data. Examples include coupled HMM [13], dynamic system trees [7] and interacting Markov chains [20]. The key difference between these approaches and the influence model is that the influence matrix connects the real network to state dependence.
4 The Dynamical Influence Model
Above, we introduced the influence model, where the influence strength matrix remains the same for all . However, there is extensive evidence leading us to think that influence is indeed a dynamical process[21]. This can also be seen from many real-world experiences: Friendship is not static; In negotiations, your most active opponent may change due to shifts in topics or strategies over time. Therefore, we believe that the influence between subjects may fluctuate as well in many social system.
Here, we demonstrate how the influence model can be extended to the dynamical case, and we call this generalization the Dynamical Influence Model. Instead of having one single influence strength matrix, , we consider a finite set of different influence strength matrices, , each representing a different pattern between entities. is a hyperparameter set by users to define the number of different interaction patterns. Our approach is basically a switching model, and we also introduce the switching latent state , which indicates the current active influence matrix at time . Therefore, Eq. 2 turns into the following:
| (3) |
As switches to different values between to at different times , the dynamics are then determined by different influence matrices .
As shown in Section 6.1, we note that it is very important to constrain the switching of for two reasons: a) In many social systems, the change of influence patterns changes slowly and gradually. b) A prior eliminates the probability of overfitting. Therefore we introduce the following prior for :
| (4) |
where is a system parameter matrix constrained by another hyperparameter . The prior is shown in Eq. 4.
This prior provides a better control of the process . When , the Dirichlet prior turns to a uniform distribution. However, the higher gets, the more likely and will be the same.
Given the model description and hyperparameters and , we can then write the likelihood function:
| (7) | |||||
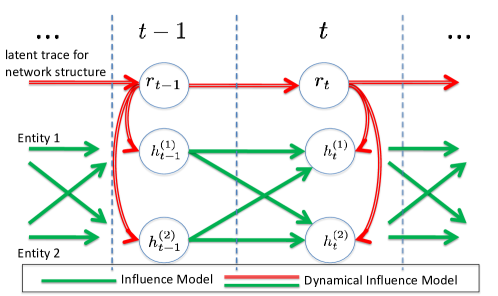
To demonstrate the difference between the static influence model and the dynamical influence model, we illustrate the Bayesian graph for both models in Fig. 2.
Researchers have been studying a variety of alternative time-varying network models: from EGRM [22] to TESLA [23]. EGRM computes a set of features from networks and how they change, and models the distribution of network evolution as the distribution of feature evolution. TESLA uses changing network edges to capture correlations in node observations with constraints on edges to ensure sparsity. Another recent version also learns network topology from cascades [24]. Compared with these models, the dynamical influence model serves as a unique generative approach for modeling noisy signals from a dynamical network.
5 Inference
In signal processing applications, we are given the observation time series signals , and based on these observations we need to learn the distributions of underlying latent variables and system parameters for the dynamical influence model. The inference process for our model is discussed here. Since the dynamical influence model is a generalization of the influence model, the following description is applicable to both models.
Previously, researchers started with a standard exact inference algorithm (Junction Tree) with exponential complexity, and then moved to an approach based on optimization[16]. Other scholars gradually moved to an approximation approach based on the Forward-Backward algorithm and variational-EM [25, 19]. The influence model can also be trained via other approximations like the mean field method[26].
Here we show some key steps for the variational E-M approach, which has been developed and applied successfully in many datasets. We refer readers to Pan et al [19] for detail. We denote definition by , and same distribution by , but the right hand side of all equations should be normalized accordingly.
E-Step: We adopt a procedure similar to the forward-backward procedure in the HMM literature. First, we define the following forward parameters for .:
| (8) |
where denotes . However, complexity for computing given grows exponentially with respect to , so we adopt the variational approach[27], and E-M is still guaranteed to converge under variational approximation[27]. We proceed to decouple the chains by:
| (9) |
and naturally:
| (10) |
The approximation adopted here enables us to run inference in polynomial time. Based on this approximation, starting with and , we can compute and , step by step in a forward manner.
Using the same idea, we can compute the following backward parameters for all in the backward order (i.e. start with , then compute and for ):
| (11) |
M-step: With and , we can estimate:
| (12) | ||||
| (13) | ||||
and update by:
| (14) |
where if , otherwise.
We then compute the joint distribution , and update parameters such as influence matrices , and by marginalizing this joint distribution.
6 Applications
6.1 Toy Example: Two Interacting Agents
In this example, we demonstrate how the dynamical influence model can be applied to find structural changes in network dynamics. As a tutorial, we also explain how readers should adjust two hyperparameters and in using this model.
From a dynamical influence process composed of two interacting entities, we sample two binary time series of 600 steps. Each chain has two hidden states with a random transition biased to remain in the current state. We sample binary observations from a randomly-generated multinomial distribution. To simulate a switch in influence dynamics, we sample with influence matrix (shown in Table 1) in the first 200 frames, and later on we sample with influence matrix . We purposely make the two configuration matrices different from each other. Partial data are shown in Table 1 (left). We use the algorithm in Section 5 to infer the dynamical influence model’s parameters . All parameters (including the emission distribution) are initialized randomly, and they are estimated automatically during the E-M process.
| SEQ. NO. | DATA(PARTIALLY) |
|---|---|
| 1 | 221111121212212… |
| 2 | 112111212121122… |
| True | ||
|---|---|---|
| Learned |
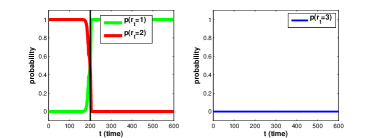
Choosing hyperparameters: We now discuss the selection of hyperparameters and . For the number of active influence matrices , we illustrate their characteristics by running the same example with . We show the poster distribution of (calculated in Eq. 32) in Fig. 3. The dynamical influence model discovers the sudden change of influence weights accurately at . Since the toy process only has two true configuration matrices, the posterior probability of the rd configuration being active is almost zero for any . The system properties are fully captured by the other two configuration matrices during the training. The learned configuration matrices (shown in Table 1) are correctly recovered. Based on Fig. 3 and experiments with other values for (which we cannot show here due to the space limitation), we suggest that readers should gradually increase until the newly added configuration matrices are no longer useful in capturing additional dynamical information from the data, by ensuring there is no constant zero posterior probability as in the right plot in Fig. 3.
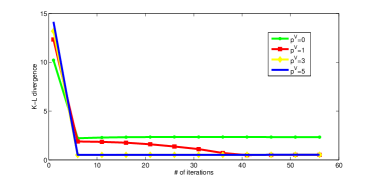
We also demonstrate convergence of the K-L Divergence between the true distributions of the transition probability and the learned distributions in Fig. 3 with different values of . As can be seen in Fig. 3, the algorithm converges quickly within 50 iterations. However, when is small, we may encounter over-fitting where the learned model rapidly switches between different configurations to best suit the data. Therefore, in Fig. 3, the divergence for remains higher than other values at convergence. In conclusion, we advise users to increase gradually until the posterior of does not fluctuate.
6.2 Modeling Dynamical Influence in Group Discussions
6.2.1 Dataset Description and Preprocessing
Researchers in [5] recruited 40 groups with four subjects in each group for this experiment. During the experiment, each subject was required to wear a sociometric badge on their necks for audio recording, illustrated in the right picture in Fig. 1, and each group was required to perform two different group discussion tasks: a brainstorming task (referred as BS) and a problem solving task (referred as PS). Each task usually lasted for 3 to 10 minutes. We refer readers to the original paper[5] for details on data collection and experiment preparations.
The groups were asked to perform these tasks in two different settings: one in which people were co-located in the same room around a table (referred as CO), and one in which two pairs of people were placed in two separate rooms with only audio communication available between them (referred as DS). The badges are deployed in both cases for audio collecting. We separated all samples according to their tasks (BS/PS) and their settings (CO/DS), and we ended up with four categories: DS+BS, DS+PS, CO+BS, CO+PS. Since discussions were held in four-person groups, each sample for a discussion session is composed of four sequences collected by the four badges on participants’ chests. The audio sequence picked up by each badge was split into one-second blocks. Variances of speech energy were calculated for each block. We then applied a hard threshold to convert them into binary sequences. In all experiments, we only used binary sequences as data input.
6.2.2 Predicting Turn Taking in Discussion
We here explain an application of the dynamical influence model to predict turn taking, and we show that it is possible to achieve good accuracy in prediction given only the audio volume variance observations, with no information from the audio content.
Ten occurrences of turn taking behavior from each sample are selected for prediction purposes. “Turn taking” here is defined as incidences in which the current speaker ceases speaking, and another speaker starts to speak.
For the dynamical influence model, we model each person as an entity , and the observed audio variances at time as . Each person also has two hidden states, representing speaking or not speaking. The hidden layer eliminates error due to noise and non-voicing speaking in audio signals[16]. Therefore, influence here is set to capture how each person’s speaking/non-speaking hidden states dynamically change other people’s speaking/non-speaking states (i.e., how people influence each others’ turn taking). All parameters are initialized randomly and learned by the E-M inference algorithm in this example. We train the dynamical influence model using data up to , sample observations at time from it, and mark the chain that changes the most toward the high-variance observations as the turn taker at . The emission probability is modeled using a multinomial distribution, and is estimated automatically during the E-M process.
For comparison, we also show results using TESLA and nearest neighbors methods. For TESLA, we use the official implementation[23] to obtain the changing weights between pairs of nodes, and we pick the node that has the strongest correlation weight to other nodes at as the turn taker at . To predict the turn taking at time using the nearest neighbor method, we look over all previous instances of turn taking behaviors that have the same speaker as the one in , and predict by using the most frequent outcomes.
| ACCURACY | ACCURACY | |||||||
|---|---|---|---|---|---|---|---|---|
| ALL SAMPLES | COMPLEX INTERACTION SAMPLES | |||||||
| METHODS | DS+BS | DS+PS | CO+BS | CO+PS | DS+BS | DS+PS | CO+BS | CO+PS |
| TESLA | 0.41 | 0.42 | 0.32 | 0.25 | 0.44 | 0.37 | 0.37 | 0.17 |
| NN | 0.58 | 0.60 | 0.48 | 0.50 | 0.47 | 0.47 | 0.38 | 0.26 |
| Ours(J=1) | 0.45 | 0.67 | 0.75 | 0.63 | 0.45 | 0.56 | 0.77 | 0.62 |
| Ours(J=2) | 0.46 | 0.58 | 0.65 | 0.34 | 0.47 | 0.58 | 0.67 | 0.46 |
| Ours(J=3) | 0.50 | 0.60 | 0.55 | 0.48 | 0.47 | 0.73 | 0.65 | 0.65 |
The accuracy for each algorithm is listed in Table 2. We also show the prediction accuracy for the half of all samples that have more complex interactions, i.e., higher entropy. For the dynamical influence approach, we list error rates for (which is simply the influence model), and . Except DS+BS, We notice that the dynamical influence model outperforms others in all categories with different . This performance is quite good considering that we are using only volume and that a human can only predict at around accuracy for similar tasks[28].
More importantly, the dynamical influence model seems to perform much better than the competing methods for more complex interactions. For simple interactions, it seems that or even NN perform the best due to the fact that there is little shift in the influence structure during the discussion. However, when handling complex interaction processes, the introduction of a switching influence dynamic dramatically improves the performance as shown in Table 2. This result suggests that the dynamical influence assumption is reasonable and necessary in modeling complex group dynamics, and it can improve prediction accuracy significantly. However, in simple cases, the model achieves the highest performance when (i.e. the influence matrix is static), and a higher will only lead to overfitting.
The fact that turn taking is predictable using our dynamical influence assumption is indeed surprising, because group turn taking dynamics are complicated and related to content as well [4]. We think that the dynamical influence model tracks the two main mechanisms of group discussions noted in Gibson [4] even though the model does not incorporate the content of speaker statements. First, the time variant assumption in the dynamical influence model captures the latency factor in group dynamics. And second, our abstract conditional probability definition of influence is essentially a generalization of the conversational obligation mechanism Gibson described.
6.3 Modeling Flu Epidemics as Influence Dynamics
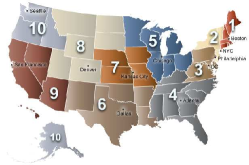
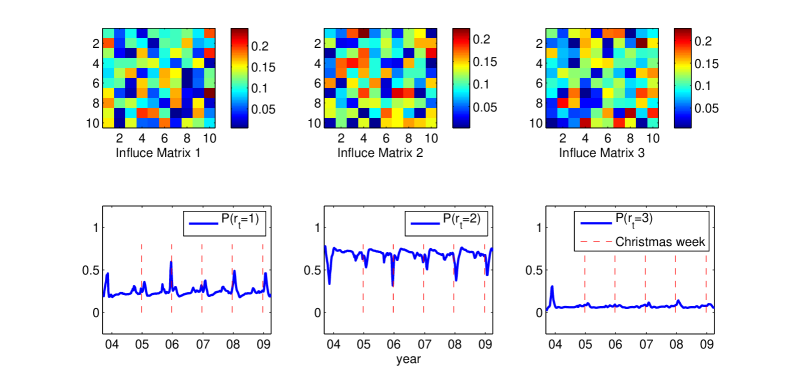
The last example is an application of the dynamical influence model to weekly US flu activity data from Google Flu Trends [29]. All 50 states in the U.S. are divided into ten regions by their geo-location, as shown in Fig. 4, and we model each region as an entity in the dynamical influence model.
As the data are continuous, six hidden states are used for each chain, and is modeled with six different Gaussian distributions with different means and the same variance for each hidden state. We set by hand the six mean values so that they represent the six different severe levels for the flu epidemics, from the least severe to the most severe. We train the model using the first 290 weeks (from 2003 to early 2009), and we show the posterior for , the switching parameter, in Fig.5 together with the three learned influence matrices. While there are many small peaks suggesting changes in influence, the probability changes dramatically around Christmas, which suggests that the influence patterns among these ten regions are very different during the holiday season. Note especially that we did not tell the model to search for different patterns on those days – instead, it reveals the fact that transmission dynamics operate differently during a time when many people are engaging in once-a-year travel to visit family and friends. While it is possible that other mechanisms are at work, alternative explanations like the weather are not plausible because they do not change discontinuously during the holiday season.
Influence matrix captures the dynamics during holiday seasons, while influence matrix captures the dynamics during normal seasons. Row corresponds to the region in Fig. 4. Let’s take an example of Row 1, the New England region. During normal times as shown in the 1st row of influence matrix , New England is more likely to be influenced by close regions such as and ; during holiday seasons, New England is more likely to be influenced by all regions especially distant regions such as region . The same phenomena exist for other regions as well.
7 Discussion
In this article we described the influence model and its generalization, the dynamical influence model, and we showed how these can be applied to a variety of social signals to infer how entities in networks affect one other. In particular, we can use the resulting influence matrix to connect the underlying network and the stochastic process of state transition. The switching matrices are even able to bridge the state transition to time-varying networks.
The influence model shares the same issues with other machine learning models: inference requires sufficient training data, and tuning is necessary for best results. Future work includes combining known network data into the model to boost performance.
The most important limitation is that we are attempting to infer causal processes from observational data in which many mechanisms are likely at play. If we find that behavior between two individuals is correlated, it could be due to influence, but it could also be due to selection (I choose to interact with people like me) or to contextual factors (you and I are both influenced by an event or a third party not in the data). It has been recently shown that these mechanisms are generically confounded [11] but it is important to remember that this does not make observational data worthless. It just means that we should carefully consider alternative mechanisms that may underlie correlated behavior. The fact that we have time data to test causal ordering and we have asymmetries in network relationships to test direction of effects means that we can have greater (but not complete!) confidence than we would if we only had cross-sectional data from symmetric relationships.
References
- [1] D.J. Watts and P.S. Dodds. Influentials, networks, and public opinion formation. Journal of Consumer Research, 34(4):441–458, 2007.
- [2] A.W. Woolley, C.F. Chabris, A. Pentland, N. Hashmi, and T.W. Malone. Evidence for a collective intelligence factor in the performance of human groups. science, 330(6004):686, 2010.
- [3] C.F. Manski. Identification of endogenous social effects: The reflection problem. The Review of Economic Studies, 60(3):531, 1993.
- [4] D.R. Gibson. Making the turn. Social Psychology Quarterly, 73(2):132, 2010.
- [5] T. Kim, A. Chang, L. Holland, and A.S. Pentland. Meeting mediator: enhancing group collaborationusing sociometric feedback. In Proceedings of the ACM 2008 conference on Computer supported cooperative work, pages 457–466. ACM, 2008.
- [6] N. Eagle and A. Pentland. Reality mining: sensing complex social systems. Personal and Ubiquitous Computing, 10(4):255–268, 2006.
- [7] S. Basu, T. Choudhury, B. Clarkson, A. Pentland, et al. Learning human interactions with the influence model. MIT Media Laboratory Technical Note, 2001.
- [8] C. Castellano and V. Loreto. Statistical physics of social dynamics. Reviews of Modern Physics, 81(2):591, 2009.
- [9] N.E. Friedkin. The attitude-behavior linkage in behavioral cascades. Social Psychology Quarterly, 73(2):196, 2010.
- [10] D. Acemoglu, A. Ozdaglar, and A. ParandehGheibi. Spread of (mis) information in social networks. Games and Economic Behavior, 2010.
- [11] C.R. Shalizi and A.C. Thomas. Homophily and contagion are generically confounded in observational social network studies. Arxiv preprint arXiv:1004.4704, 2010.
- [12] C.M. Bishop et al. Pattern recognition and machine learning. Springer New York:, 2006.
- [13] M. Brand, N. Oliver, and A. Pentland. Coupled hidden Markov models for complex action recognition. In IEEE Computer Society Conference on Computer Vision and Pattern Recognition, pages 994–999, 1997.
- [14] W. Dong and A. Pentland. Modeling influence between experts. Lecture Notes in Computer Science, 4451:170, 2007.
- [15] A. Madan and A. Pentland. Modeling Social Diffusion Phenomena using Reality Mining. In AAAI Spring Symposium on Human Behavior Modeling. Palo Alto, CA, 2009.
- [16] T. Choudhury and S. Basu. Modeling conversational dynamics as a mixed memory markov process. In Proc. of Intl. Conference on Neural Information and Processing Systems (NIPS). Citeseer, 2004.
- [17] W. Dong, B. Lepri, A. Cappelletti, A.S. Pentland, F. Pianesi, and M. Zancanaro. Using the influence model to recognize functional roles in meetings. In Proceedings of the 9th international conference on Multimodal interfaces, pages 271–278. ACM, 2007.
- [18] W. Dong and A. Pentland. A Network Analysis of Road Traffic with Vehicle Tracking Data. 2009.
- [19] W. Pan, M. Cebrian, W. Dong, T. Kim, and A. Pentland. Modeling Dynamical Influence in Human Interaction Patterns. Arxiv preprint arXiv:1009.0240, 2010.
- [20] D. Zhang, D. Gatica-Perez, S. Bengio, and D. Roy. Learning Influence Among Interacting Markov Chains. 2005.
- [21] S.A. Ansari, V.S. Springthorpe, and S.A. Sattar. Survival and vehicular spread of human rotaviruses: possible relation to seasonality of outbreaks. Reviews of infectious diseases, 13(3):448–461, 1991.
- [22] F. Guo, S. Hanneke, W. Fu, and E.P. Xing. Recovering temporally rewiring networks: A model-based approach. In Proceedings of the 24th international conference on Machine learning, page 328. ACM, 2007.
- [23] A. Ahmed and E.P. Xing. Recovering time-varying networks of dependencies in social and biological studies. Proceedings of the National Academy of Sciences, 106(29):11878, 2009.
- [24] M. Gomez Rodriguez, J. Leskovec, and A. Krause. Inferring networks of diffusion and influence. In Proceedings of the 16th ACM SIGKDD international conference on Knowledge discovery and data mining, pages 1019–1028. ACM, 2010.
- [25] W. Dong and A. Pentland. Multi-sensor data fusion using the influence model. In Proceedings of the International Workshop on Wearable and Implantable Body Sensor Networks, page 75. Citeseer, 2006.
- [26] Dong, Wen. Modeling the Structure of Collective Intelligence. PhD thesis, Massachusetts Institute of Technology, 2010.
- [27] M.I. Jordan, Z. Ghahramani, T.S. Jaakkola, and L.K. Saul. An introduction to variational methods for graphical models. Machine learning, 37(2):183–233, 1999.
- [28] D. Schlangen. From reaction to prediction: Experiments with computational models of turn-taking. In Ninth International Conference on Spoken Language Processing. Citeseer, 2006.
- [29] J. Ginsberg, M.H. Mohebbi, R.S. Patel, L. Brammer, M.S. Smolinski, and L. Brilliant. Detecting influenza epidemics using search engine query data. Nature, 457(7232):1012–1014, 2008.
- [30] R.J. Weiss and D.P.W. Ellis. A variational EM algorithm for learning eigenvoice parameters in mixed signals. In Proceedings of the 2009 IEEE International Conference on Acoustics, Speech and Signal Processing-Volume 00, pages 113–116. IEEE Computer Society, 2009.
- [31] C.C. Chang and C.J. Lin. LIBSVM: a library for support vector machines, 2001.
- [32] J.M. DiMicco, KJ Hollenbach, A. Pandolfo, and W. Bender. The Impact of Increased Awareness while Face-to-Face. Human-Computer Interaction, 22(1), 2007.
8 Appendix A: Model Learning
We here show detail steps for our variational E-M algorithm. Definition is denoted by , and denotes the same distribution but the right side should be normalized accordingly.
8.1 E-Step
We adopt a procedure similar to the forward-backward procedure in HMM literature. We compute the following forward parameters for .:
| (15) | |||
| (16) |
where denotes . However, exact inference is not intractable. We apply the variational approach in [30] [27]. The variational E-M process is still guaranteed to converge because of the lower bound property of the variational method [27]. We decouple the chains by:
| (17) |
and naturally:
| (18) |
We define:
| (19) |
and
| (20) |
where:
| (21) |
We define to be in the form of , which captures both the evidence from previous states() and the evidence() from observations. We then have:
| (22) | |||||
where is actually . We also have:
| (23) | ||||
and
| (24) |
We continue to minimize the K-L divergence between and , that is:
| (25) | |||||
By taking the derivative we have:
| (26) | ||||
We then compute using Bayes’ rule:
| (27) |
where can be evaluated using the previous approximation results. The prior part of Eq. 27 can be evaluated using and .
Using the same idea, we can compute the following backward parameters for all :
| (28) | |||
| (29) | |||
| (30) |
8.2 M-step
With and , we can estimate:
| (31) | ||||
and
| (32) |
We then update by:
| (33) |
where if , otherwise.
We compute the following joint distribution.
denotes the normalization factor that can be calculated easily by summing all possible values for each variable. This is fast to compute since the joint distribution is made of only four variables. By marginalizing Eq. 8.2, we can update parameters and :
| (35) |
| (36) |
and
| (37) | ||||
9 Appendix B: Detecting Structural Changes in the Discussion Dynamics
We here provide an additional example for detecting structural changes using the same dataset described in Section 5 of our paper.
One important feature of this model is its ability to capture changes in influence dynamics given only observed time series for each node. In this section, we will demonstrate the performance of our model in detecting changes with the group discussion dataset.
In our discussion, a sample refers to the set of four sequences collected by the four badges in deployed in a group discussion session. We adopt the following evaluation procedure: One mixed binary audio sample for each four-person group is generated by concatenating the co-located discussion session sample and the the distributed discussion session sample of the same group. It is known that [5] the interaction pattern in a distributed discussion session is often different from a co-located discussion session. Therefore, we are able to create ground truth about changes of influence patterns by switching from a distributed discussion sample to a co-located discussion sample manually. It should be noted that we only use binary sequences by thresholding the volume variance. Thus, we have eliminated all information in the audio content. Two samples from each group are included in our final evaluation set: a) the original sample of the co-located discussion session (CO) and b) the mixed sample as described above (CO+DS). We end up with a total of 28 groups and 56 samples in the final set. Lengths of each sample vary from 100 seconds to 500 seconds.
We apply our model on both samples for each group. The emission probability in our model is used to tolerate possible error due to hard thresholding and possible noise. We choose , and is optimized for best performance. The posterior of for the two samples from each group is stored as the output of the algorithm.
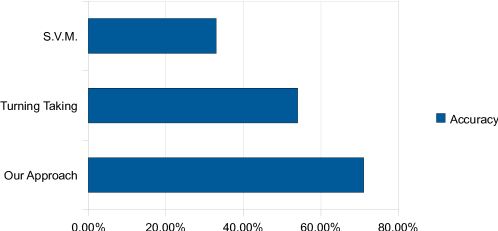
We continue to develop simple heuristics for distinguishing DS+CO from CO by looking at the difference of the expected influence matrix () at and for each sample, and the one with larger difference is labeled as the CO+DS sequence. Given the pair of samples for each group, we test the labeling accuracy based on the output of our model. For comparison, we also implement two other techniques: a) classification based on one single feature, the turn taking rate, and b) S.V.M.-based classification (using implementation in [31]). It is well recognized that the turn taking rate is an important indicator for group dynamics. We compute the two turn taking rates for each pair of samples and compare them to determine sample labels. For S.V.M., we compute the turn taking rate and the speaking durations for each group member as the feature vector for each sample. Its performance is obtained via a four-fold cross validation. It should be emphasized that the S.V.M. classification task is different from the other two, and it is naturally more challenging: all samples are mixed together before fed to S.V.M. rather than being fed to other two algorithms in a pairwise manner.
We must point out that the ground truth in our evaluation may not be accurate: There is no guarantee in the dataset that a group of people behave and interact with each other differently when they are performing discussions using remote communication tools rather than being in the same room.
We illustrate the accuracy rates in Fig. 6. As we expected, our algorithm reaches accuracy and outperforms the other two methods. We argue that the influence dynamic is an intrinsic property of the group, which can not be fully revealed using simple statistical analysis on observable features. To investigate and visualize the dynamical characteristics of human interaction patterns, a more sophisticated model, such as our dynamical influence process, must be deployed to reveal the subtle differences in influence dynamics.
In addition, we claim that our model is capable of modeling, quantifying and tracking occurrences of such shifts in face-to-face dynamics accurately. Our model fits its parameters to best suit switches between different influence patterns, and the parameters will be helpful for sociologists to objectively investigate the micro relationship in a group discussion session. Information discovered by our algorithm will also be useful in applications such as understanding possible interventions in human interactions[5][32].