Discovery of an extremely bright submillimeter galaxy at z=3.93
Serendipitously we have discovered a rare, bright submillimeter galaxy (SMG) with a flux density of 30 2 mJy at mm, using MAMBO2 at the IRAM 30-meter millimeter telescope. Although no optical counterpart is known for MM18423+5938, we were able to measure the redshift from the detection of CO lines using the IRAM Eight MIxer Receiver (EMIR). In addition, by collecting all available photometric data in the far-infrared and radio to constrain its spectral energy distribution, we derive the FIR luminosity 4.8 10 L⊙ and mass 6.0 10 M⊙ for its dust, allowing for a magnification factor caused by a probable gravitational lens. The corresponding star-formation rate is 8.3 10 M⊙/yr. The detection of three lines of the CO rotational ladder, and a significant upper limit for a fourth CO line, allow us to estimate an H2 mass of between 1.9 10 M⊙ and 1.1 10 M⊙. The two lines C I and C I were clearly detected and yield a [C I]/[H2] number abundance of between 1.4 10-5 and 8.0 10-5. Upper limits are presented for emission lines of HCN, HCO+, HNC, H2O, and of other molecules. The moderate excitation of the CO lines is indicative of an extended starburst, and excludes the dominance of an AGN in heating this high-z SMG.
Key Words.:
Galaxies: evolution - Galaxies: high-redshift - Galaxies: ISM - Infrared: galaxies - Submillimeter: galaxies1 Introduction
Deep blank-field millimeter and submillimeter surveys of small fields ( 1 deg2) have revealed many dusty, starburst submillimeter galaxies (SMGs) over the past decade with flux densities of a few to about ten mJy at mm (e.g. Bertoldi et al. 2007, Greve et al. 2008), and higher at m owing to dust emissivity (e.g. Smail et al 1997). Recently, the South Pole Telescope survey, less deep but much larger in sky coverage (87 deg2), has found 47 brighter SMGs with flux densities between 11 and 65 mJy at mm (Vieira et al. 2010). Whereas redshifts of SMGs are crucial to study their physical properties, most of these dust-obscured galaxies have very faint or no optical counterparts, making measurements of spectroscopic redshift extremely difficult or impossible (e.g. Smail et al. 2002).
These dust-enshrouded star-forming galaxies are expected to be at high redshifts and are identified with the most massive galaxies assembled during an energetic early phase of galaxy formation. Their abundance appears to peak at (Chapman et al. 2005, Wardlow et al 2010). Their star formation rate is prodigious at up to 103 M, and the underlying starburst activity is believed to result from mergers (Blain et al. 2002).
Lestrade et al. (2009) discovered serendipitously a rare, bright point source, MM18423+5938, at mm (30 mJy) by mapping 50 separate fields totalling a sky area of 0.5 deg2 with the MAMBO2 bolometer camera (Kreysa et al at the IRAM 30-meter millimeter telescope. Subsequently, some of us (PA and NS) searched but did not find local CO in the direction of the source suggesting not a young stellar object but an SMG instead, despite the Vieira et al’s cumulative source count that yields a chance as low as 7% of finding a 30mJy SMG. MM18423+5938 is detected at 70 m but undetected at 24 m in MIPS/Spitzer images. It is in neither the 2MASS catalogue, nor the NVSS VLA catalogue ( 2.5mJy), and no optical and X-ray identifications are found in catalogues searched with NED (MM18423+593 is however outside the SDSS footprint). All these photometric data are summarized in Table 1.
We show in this Letter that MM18423+5938 is a bright, high-redshift SMG. We present in Sect. 2 our IRAM/EMIR spectroscopic observations of MM18423+5938 at millimeter wavelengths that yielded our detections of CO and C I, and upper limits for other molecular species. In Sect. 3, we model the data to infer the dust and gas content of MM18423+5938 and its general properties. To compute distances and luminosities, we adopt the -CDM concordance cosmological model, H0 = 71 km/s/Mpc, = 0.27, and = 0.73 (Hinshaw et al. 2009).
2 Observations and data analysis
Lestrade et al. (2009) detected MM18423+5938 with a high but uncertain integrated flux density of mJy, given that it was located close to the border of their MAMBO map. We reobserved MM18423+5938 with MAMBO at the IRAM 30-m telescope in the on-off wobbler-switching mode on 2010 January 16 using the map coordinates and and measured mJy at mm.
| Band | (mJy) | Ref |
|---|---|---|
| 1.4 GHz | 2.5 | NVSS |
| 3 mm | 2 | this work |
| 2 mm | 93 | this work |
| 1.2 mm | 302 | this work |
| 100m | 600 | IRAS |
| 60m | 100 | IRAS |
| 70m | 314 | Spitzer/MIPS |
| 24m | 0.6 | Spitzer/MIPS |
| B V R I | B mag 21 | NED (DSS) |

MM18423+5938 is located close to the border of the archived MIPS/Spitzer maps centered on the star GJ725AB (AOR 4199424). We determined the flux densities of the star GJ725AB and MM18423+5938 at 70 m and 24 m by means of aperture photometry, scaling with the stellar photospheric flux densities of GJ725AB predicted by the NextGen stellar atmospheric model (Allard et al. 2001). We note a difference of 9”, i.e. at the level, between the positions of the source in our MAMBO map (Lestrade et al. 2009) and the archived 70 m MIPS Spitzer map, which is not understood.
To measure the redshift of MM18423+5938, we used the strategy of observation developed by Weiss et al. (2009) with the multi-band heterodyne receiver Eight MIxer Receiver (EMIR 111http://www.iram.es/IRAMES/mainWiki/EmirforAstronomers) at the IRAM 30-m telescope. The 3mm setup (E090) of EMIR provides 7.43 GHz of instantaneous, dual linear polarization bandwidth. The entire frequency range from 77.7 to 115.8 GHz in the 3mm band can be searched with six tunings spaced to provide 0.5 GHz overlap. This range corresponds to and for the CO lines between (J=1-0) and (J=8-7). Observations were conducted from 2010 July 29th to August 2nd with precipitable waper vapor comprised between 3 and 7mm and with standard system temperatures of 110K for the E090 setup. Data were processed with 16 units of the Wide band Line Multiple Autocorrelator (WILMA) providing a spectral resolution of 2 MHz for the E090 setup. The observations were conducted in wobbler-switching mode, with a switching frequency of 1 Hz and an azimuthal wobbler throw of . Pointing and focus offsets were determined once every two hours and found to be stable. Calibration was done every 6 minutes using the standard hot/cold load absorber. The data were reduced with the CLASS software.
We started to scan the whole 3mm band by integrating data for 2 hrs for each tuning. We discovered unambiguously a line at 93.52 GHz after 20 minutes of integration during our third tuning on the second night, and continued to integrate dual polarisation data for 1.5 hr in total to reach an rms noise level of Tmb=0.8 mK in 60 km s-1 channels (Fig 1 lefthand top panel). At this stage, we successively assumed that this line could be CO(1-0), CO(2-1), … to calculate for each of these assumptions the corresponding redshift and predict the frequencies of the higher transitions accessible in the 2mm band of EMIR (setup E150 from 127 to 176 GHz). We then tuned to these frequencies with the E150 setup and swiftly detected a line at 140.26 GHz that corresponds to CO(6-5) at , in addition to the line at 93.52 GHz for CO(4-3). This identification of the CO transitions and determination of the redshift of MM18423+5938 were carried out during the same night of July 30/31 in 6 hours. The rest of the allocated time (15 hours) was used to search for CO(7-6) (detected), CO(9-8) (undetected, consequently CO(10-9) was not searched), and for other species, C I (two lines detected), and HCN & HNC(5-4), LiH(1-0) & HCO+(5-4), H2Oo, H2Op, 13CO(5-4), CS(8-7), and CS(9-8) (all undetected but interesting upper limits are discussed below, see Table 3). Two CO lines (5-4 and 8-7) unfortunately are in the atmospheric O2 and H2O lines opacity domains and could not be observed. The spectra were of high quality, stable, and flat. Their mean levels measure the continuum flux densities at 2mm and 3mm (Table 1) owing to the excellent weather conditions (precipitable water vapor 4 mm).
Figure 1 displays the three CO lines detected, along with the two C I lines. Spectra were smoothed to a resolution of 30-50 km/s. Gaussian models were fitted to the lines and the results are reported in Table 2. Line widths found are normal albeit small suggesting that we are observing a galaxy seen rather face-on.
| Line | /m/1010 | ||||||
|---|---|---|---|---|---|---|---|
| [GHz] | [mK] | [mJy] | [ km s-1] | [Jy km s-1] | [ km s-1] | [K km s-1 pc2] | |
| CO(4–3) | 93.5249 | 5.3 0.6 | 26.7 3. | 175 20 | 4.95 0.5 | 8 | 19.72. |
| CO(6–5) | 140.2695 | 6.4 1 | 32.8 5. | 189 19 | 6.6 0.6 | 9 | 11.51. |
| CO(7–6) | 163.6342 | 4.2 0.9 | 21.5 4.6 | 172 27 | 3.9 0.5 | 11 | 5.00.6 |
| C I | 99.8378 | 1.9 0.6 | 9.6 3. | 225 55 | 2.3 0.5 | 24 | 8.01.7 |
| C I | 164.1802 | 4.2 1. | 21.5 5. | 184 49 | 4.2 0.8 | 8 19 | 5.31. |
-
Quoted errors are statistical errors from Gaussian fits. The systematic calibration uncertainty is 10%
-
∗
The velocity is given relative to z=3.929605.
3 Results
3.1 Dust emission
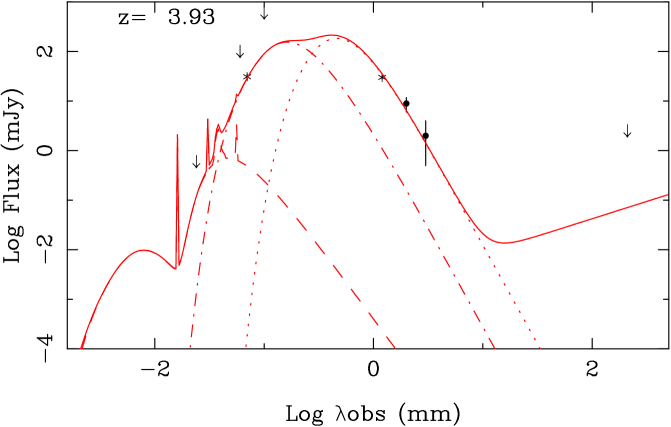
The photometric data are collected in Table 1. To model these data in Fig. 2, we choose to use the well-established Milky Way dust model of Desert et al (1990) as a template. This model consists of three main components, PAH and both very small and large grains, and the emissivity slope is assumed to be =2. The large dust grains are dominant in mass and their temperature is estimated to be Td = 45K, constrained by the Rayleigh-Jeans part of the emission. The very small grains are made of two temperature components, 80 and 130K, constrained by the 70m Spitzer measurement and the robust relationship between and found by Iono et al (2009). A single temperature component for the small grains in the model was tried but the resulting is significantly inconsistent with this relationship. The total mass of the dust required by this model is Mdust=6.0 10 M⊙, and for a gas-to-dust mass ratio of 150, we infer that Mgas=9.2 10 M⊙. We suspect there is a gravitational lens along the line of sight, with an amplification factor , or these values would be implausibly at least one order of magnitude larger than for rare hyperluminous objects. We derive the total FIR luminosity LFIR = 4.8 10 L⊙ and the star-formation rate SFR = 8.3 10 M⊙/yr, by applying the relation of Kennicutt (1998).

3.2 CO lines
The CO SED of MM18423+5938 in Fig. 3 indicates moderate line excitation, peaking only at J=5; CO SEDs peak at J=6 or 7 in local starbursts such as M82 and NGC253 (Weiss et al 2007), peak at higher J in AGN-dominated sources, e.g. J=10 in APM0827, and reach a plateau for in Mrk231 (van der Werf et al 2010). We ran several LVG models, to constrain the H2 volumic density and the kinetic temperature (cf Combes et al 1999). The moderate excitation implies a regime of low temperature and/or density. The gas kinetic temperature is taken to be equal to the dust temperature (Td=45K). When models are run with higher Tk, they all imply n(H2) lower than 103cm-3, which is not realistic for CO(7-6)-emitting clouds. Our estimate is therefore Tk=45K, n(H2)=103cm-3, and a column density per velocity interval NCO/V = 3 1018 cm-2/ km s-1, as adopted to model the data in Figure 3. From the CO(1-0) line derived from our LVG model, we infer an H2 mass of 1.9 10 M⊙ with the conversion factor M(H2)/L’CO=0.8 M⊙/(K km s-1pc2) adopted for ULIRGs by Solomon et al (1997). This latter value yields a lower limit, while the standard conversion ratio for the Milky Way, 5.75 times higher, yields the upper limit M(H2)=1.1 10 M⊙. The true mass must lie between these two values, and indicates large amounts of molecular gas even if allowing for an amplification . Assuming a typical intrinsic extension of 3kpc (e.g. Tacconi et al 2006), the surface filling factor of the molecular component is 0.3 for =1, and 0.03 for =10. The LFIR/L’CO of 2 103 L⊙/K km s-1 pc2 is consistent with ratios of other luminous infrared galaxies within the scatter (Iono et al 2009).
3.3 Atomic carbon lines
The two lines C I and C I were clearly detected. They have comparable central velocity and line width (Table 2), implying that they originate from the same region in the source. The relation between the integrated C I brightness temperature and the beam averaged C I column density with the usual assumption of the optically thin limit is given by
where is the C I partition function, and = 23.6 K and = 62.5 K are the energies above the ground state. When dealing with high-z sources, we can use the definition of the line luminosity (e.g. Solomon et al. 1997) and derive the C I mass via (cf Weiss et al 2003, 2005)
The mass estimated from the higher-excitation line is expressed in an analogous way, and we can then deduce that
where line luminosities are given in Table 2. The derived is 33.9 K. The mass of atomic carbon thus amounts to MCI=1.0 10 M⊙. Given our lower and upper limits to the H2 mass from the CO lines, the [C I]/[H2] number abundance is between 1.4 10-5 and 8.0 10-5. This is somewhat higher than the average [C I]/[H2] number abundance found in comparable star-forming objects (e.g. Barvainis et al 1997, Pety et al 2004, Weiss et al 2003, 2005, Riechers et al 2009, Danielson et al. 2010). In these latter estimates, although the observed LCI/LCO values are comparable, the [C I]/[H2] number abundances are somewhat dissimilar because of the various CO-to-H2 conversion factors adopted by these authors. Abundance lower than 1.8 10-5 has been reported (Casey et al 2010). The contribution of the atomic carbon to the cooling is low, LCI/LFIR = 2.5 10-6, comparable to that of nearby star-forming galaxies (Gerin & Phillips 2000).
| Line | /1010 | ||
|---|---|---|---|
| [GHz] | [mJy] | [K km s-1 pc2] | |
| CO(9–8) | 210.344 | 1.4 | |
| 13CO(4–3) | 89.412 | 8.1 | |
| HCN& HNC(5–4) | 90. | 5.5 | |
| LiH(1–0) & HCO+(5–4) | 90. | 5.5 | |
| H2Oo(1,1,0-1,0,1) | 112.978 | 5.0 | |
| H2Op(2,1,1-2,0,2) | 152.554 | 3.3 | |
| CS(8–7) | 79.488 | 11.2 | |
| CS(9–8) | 89.420 | 5.6 |
3.4 Other lines
We searched for high-density tracers, such as HCN, HNC, and HCO+, in particular their lowest level available, i.e. J=5-4. The upper limits found (Table 3) confirm that, on average, the H2 density is not high, as found by our LVG models of the CO line excitation. The HCN luminosity is higher than one third of the CO luminosity in local AGN-dominated objects (Imanishi et al 2004), and we note that our upper limit () is close to this limit. However, observation of HCN(1-0) and CO(1-0) are needed to conclude.
We also searched for H2O emission, using the first ortho and para lines in their ground states, i.e. H2O(=110101) and H2O(=211202) but only obtained interesting upper limits. Assuming that these water lines are optically thick, these upper limits yield a filling factor of dense clumps lower than 30% that of CO clouds.
At z=2.3, a tentative detection of the H2O(=211202) line was reported in IRAS F10214 (Encrenaz et al. 1993; Casoli et al. 1994), while at z=0.685, the fundamental transition of ortho-water, H2O(=110101) , was detected in absorption towards B0218+357 (Combes & Wiklind 1997). Water lines were searched for other starburst galaxies at high z (Riechers et al., 2006, Wagg et al.2006), and significant upper limits set. A search for H2O(=110101) emission toward the =3.91 quasar APM 08279+5255 provided a surface-filling factor lower than 12% of the CO one (Wagg et al. 2006, Weiss et al. 2007).
Finally, other interesting molecules were undetected in the observed bands, although with insufficient sensitivity: 13CO(4–3) (limiting the 13CO/12CO emission ratio to ), CS(8–7), LiH (1–0) lines, several lines of formaldehyde H2CO, and SiO, which is a tracer of shocks. Their lowest transitions observed are , , SiO(9-8) and upper limits are K km s-1 pc2.
4 Discussion and conclusion
We have found that the brightest SMG in the North, MM18423+5938, is at a redshift . This source is part of a most interesting population of similar objects recently found by the Herschel Atlas survey (Negrello et al 2010 submitted). From our modelled SED, the FIR luminosity 4.8 L⊙ and mass 6.0 10 M⊙ for the dust of MM18423+5938, and the implied star-formation rate of 8.3 10 M⊙/yr, lead to suspect a gravitational lens along the line of sight with an amplification factor . From our modelled CO SED, we have found that M(H2) is between 1.9 and 10.8 10M⊙ depending on the conversion ratio, indicating large amounts of molecular gas. The CO line excitation is moderate which indicates that there is both no strong heating by a central AGN and a starburst that is not too extreme. The average density of the molecular medium is low, of the order of 103 cm-3, and the gas kinetic temperature is assumed to be 45K in our model. The atomic carbon lines, assumed optically thin, are excited to = 33.9K and yield MCI=1.0 10 M⊙, which corresponds to a [C I]/[H2] number abundance of between 1.4 10-5 and 8.0 10-5 when the limits on the H2 mass derived from the CO lines are used. In this high-z SMG, the C I-to-CO luminosity ratio is consistent with those of other high-z galaxies.
The moderate CO line excitation found excludes a dominant AGN in MM18423+5938, unlike Mrk231 where CO is excited up to J=13 (van der Werf et al 2010). This moderate excitation favors an extended gas disk (typically 3kpc), rather than a compact nuclear starburst (300pc) and consequently a high CO-to-H2 conversion ratio. This high-redshift SMG, with a star formation efficiency of LFIR/L’CO=2400, is comparable to the lower-z submillimeter galaxies studied by Greve et al (2005).
Acknowledgements.
Based on observations carried out with the IRAM 30m telescope. IRAM is supported by INSU/CNRS (France), MPG (Germany) and IGN (Spain). The authors are grateful to the IRAM staff for their support, and to the referee for helpful comments.References
- (1) Allard, F., Hauschildt, P. H., Alexander, D. R., et al., 2001, ApJ, 556, 357
- (2) Bertoldi, F., Carilli C., Aravena M. et al, 2007, ApJSS, 172, 132
- (3) Blain A.W. , Smail I., Ivison R.J. et al. 2002, PhR, 369, 111
- (4) Casey C.M., Chapman S.C., Daddi E. et al.: 2009, MNRAS 400, 670
- (5) Casoli F., Gerin M., Encrenaz P. J., Combes F., 1994, A&A, 287, 716
- (6) Chapman, S. C., Blain, A. W., Smail, I., Ivison, R. J., 2005, ApJ, 622, 772
- (7) Combes, Wiklind T., 1997, ApJ 486, L79
- (8) Combes, F., Maoli, R. & Omont, A., 1999, A&A, 345, 369
- (9) Danielson A., Swinbank, A., Smail, I. et al., 2010, MNRAS, arXiv1008.3183
- (10) Desert F-X., Boulanger F., Puget J-L.: 1990, A&A 237, 215
- (11) Encrenaz P., Combes F., Casoli F. et al.:1993, A&A, 273, L19
- (12) Gerin, M., Phillips T.G.: 2000, ApJ 537, 644
- (13) Greve. T.R., Bertoldi, F., Smail, I. et al.: 2005, MNRAS, 359, 1165
- (14) Greve, T.R., Pope A., Scott D. et al, 2008, MNRAS, 389, 1489
- (15) Hinshaw G., Weiland J.L., Hill R.S. et al: 2009, ApJS 180, 225
- (16) Imanishi, M., Nakanishi, K., Kuno, N., Kohno, K.: 2004, AJ 128, 2037
- (17) Iono, D., Wilson, C. D., Yun, M.S. et al: 2009, ApJ, 695, 1537
- (18) Kennicutt, R.: 1998, ARAA 38, 189
- (19) Kreysa, E., Gemuend, H.P., Gromke, J. et al. 1998, SPIE, 3357, 319
- (20) Lestrade, J-F, Wyatt M.C, Bertoldi F. et al, 2009, A&A, 506, 145
- (21) Pety, J.. Beelen, A.. Cox, P. et al.: 2004, A&A 428, L21
- (22) Riechers D.A., Weiss A., Walter F. et al. : 2006, ApJ 649, 635
- (23) Riechers D.A., Walter F., Bertoldi F. et al: 2009, ApJ 703, 1398
- (24) Riechers D.A., Capak P.L., Carilli C. et al: 2010, ApJ, 720, 431 press
- (25) Smail, I, Ivison, R.J., Blain, A.W., 1997, ApJ, 490, L5
- (26) Smail, I, Ivison, R.J., Blain, A.W., & Kneib, J.P., 2002, MNRAS, 331, 495
- (27) Solomon P.M., Downes D., Radford S. J. E., Barrett, J. W.: 1997, ApJ 478, 144
- (28) Tacconi L.J., Neri R., Chapman S.C. et al: 2006, ApJ 640, 228
- (29) van der Werf P., Isaak K., Meijerink R. et al.: 2010, A&A 518, L42
- (30) Vieira J.D., Crawford T.M., Switzer E.R. et al, 2010, ApJ 719, 763
- (31) Wagg J., Wilner, D. J., Neri, R., Downes, D., Wiklind, T.: 2006, ApJ 651, 46
- (32) Wardlow J.L., Smail I., Coppin K.E.K. et al.: 2010, MNRAS, arXiv: 1006.2137
- (33) Weiss A., Henkel C., Downes D., Walter F.:, 2003, A&A, 409, L41
- (34) Weiss A., Downes D., Henkel, C., Walter F.:, 2005, A&A, 429, L25
- (35) Weiss A., , Downes D., Neri R., et al: 2007, A&A 467, 955
- (36) Weiss A., Ivison R.J., Downes D. et al, 2009, ApJ, 705, L45