The Stellar Ages and Masses of Short GRB Host Galaxies: Investigating the Progenitor Delay Time Distribution and the Role of Mass and Star Formation in the Short GRB Rate
Abstract
We present multi-band optical and near-infrared observations of 19 short -ray burst (GRB) host galaxies, aimed at measuring their stellar masses and population ages. The goals of this study are to evaluate whether short GRBs track the stellar mass distribution of galaxies, to investigate the progenitor delay time distribution, and to explore any connection between long and short GRB progenitors. Using single stellar population models we infer masses of , with a median of , and population ages of Gyr with a median of Gyr. We further infer maximal masses of by assuming stellar population ages equal to the age of the universe at each host’s redshift. Comparing the distribution of stellar masses to the general galaxy mass function we find that short GRBs track the cosmic stellar mass distribution only if the late-type hosts generally have maximal masses. However, there is an apparent dearth of early-type hosts compared to the equal contribution of early- and late-type galaxies to the cosmic stellar mass budget. These results suggest that stellar mass may not be the sole parameter controlling the short GRB rate, and raise the possibility of a two-component model with both mass and star formation playing a role (reminiscent of the case for Type Ia supernovae). If short GRBs in late-type galaxies indeed track the star formation activity, the resulting typical delay time is Gyr, while those in early-type hosts have a typical delay of Gyr. Using the same stellar population models we fit the broad-band photometry for 22 long GRB host galaxies in a similar redshift range and find that they have significantly lower masses and younger population ages, with and Gyr, respectively; their maximal masses are similarly lower, , and as expected do not track the galaxy mass function. Most importantly, the two GRB host populations remain distinct even if we consider only the star-forming hosts of short GRBs, supporting our previous findings (based on star formation rates and metallicities) that the progenitors of long GRBs and short GRBs in late-type galaxies are distinct. Given the much younger stellar populations of long GRB hosts (and hence of long GRB progenitors), and the substantial differences in host properties, we caution against the use of Type I and II designations for GRBs since this may erroneously imply that all GRBs which track star formation activity share the same massive star progenitors.
Subject headings:
gamma-rays:bursts1. Introduction
The progenitors of the short-duration -ray bursts (GRBs) remain unidentified at the present. However, in recent years important constraints have been placed on their nature based on observations of the prompt emission, afterglows, and host galaxies. In particular, the discovery of short GRBs in elliptical galaxies (Berger et al., 2005; Bloom et al., 2006) demonstrated that at least some of the progenitors belong to an old stellar population ( Gyr). On the other hand, the bulk of the identified host population exhibits star formation activity (Berger et al., 2007), albeit with lower star formation rates and higher metallicities than the hosts of long GRBs (Berger, 2009). On a sub-galactic scale, the locations of short GRBs do not coincide with regions of active star formation (Fox et al., 2005; Fong et al., 2010; Rowlinson et al., 2010b), and instead trace the rest-frame optical light distribution, indicative of a connection with older stellar populations compared to long GRBs (Fong et al., 2010; Berger, 2010b). Similarly, the offsets of short GRBs are substantially larger than those of long GRBs (Fong et al., 2010), with recent potential evidence for a population of short bursts with offsets of tens of kpc, possibly due to natal kicks (Berger, 2010a).
The afterglow and prompt emission properties likewise point to a distinct origin for the two GRB types. Short GRBs have significantly fainter optical and X-ray afterglows than those of long GRBs (Nakar, 2007; Gehrels et al., 2008; Kann et al., 2008; Berger et al., 2009; Nysewander et al., 2009; Berger, 2010a), although they exhibit similar flux ratios between the two bands (Nysewander et al., 2009; Berger, 2010a). Their isotropic-equivalent -ray energies, erg, are also generally lower than for long GRBs (Berger et al., 2007; Gehrels et al., 2008; Nysewander et al., 2009; Berger, 2010a). These results point to an overall lower energy budget, and potentially lower circumburst densities (Soderberg et al., 2006; Berger, 2010a). Taken in conjunction, the emission and environmental properties point to a distinct origin for short and long GRBs, and indicate that the short GRB progenitors are not dominated by a young population (e.g., massive stars or young magnetars).
Despite this crucial insight three basic and inter-related questions remain open at the present, whose answers can shed light on the nature of the progenitors:
-
•
Does the short GRB rate depend solely on the stellar masses of the host galaxies, or does star formation play a role?
-
•
What is the delay time distribution of short GRBs?
-
•
Is there an overlap between long and short GRBs, such that duration is not uniquely mapped to progenitor?
In the context of the first two questions, the popular compact object binary progenitors (NS-NS or NS-BH; Eichler et al. 1989; Paczynski 1991; Narayan et al. 1992) are expected to track stellar mass if the merger timescales are long (). On the other hand, if a substantial rapid merger channel exists (e.g., Belczynski et al. 2006), then star formation activity will also impact the short GRB rate. Similarly, the distribution of merger timescales will impact the mix of early- and late-type hosts (Zheng & Ramirez-Ruiz, 2007). In particular, if mass is the dominant factor we expect a roughly equal number of short GRBs in early- and late-type galaxies111This assumes that there are no systematic differences between short GRBs in early- and late-type galaxies that would influence their detectability, such as the typical ambient density or energy release. since at the relevant redshift range each galaxy population type accounts for about half of the cosmic stellar mass budget (e.g., Ilbert et al. 2010); a connection with star formation will serve to increase the late-type fraction. The same trends will be apparent for any progenitor system with a broad range of delay times, such as accretion-induced collapse (AIC) of neutron stars (Qin et al., 1998), and delayed magnetar formation through binary white dwarf mergers or white dwarf AIC (Levan et al., 2006; Metzger et al., 2008).
Related to the questions of delay times and a connection to stellar mass or star formation is whether durations and progenitors are directly linked, i.e., whether some short GRBs arise from massive star progenitors like long GRBs (e.g., Virgili et al. 2009; Lazzati et al. 2010). If such a subset of events exists, it will be manifested in a population of short GRBs with negligible delay times of Myr, or equivalently hosts with very young stellar populations and vigorous star formation activity. Such stellar populations are clearly present in long GRB hosts (Christensen et al., 2004; Levesque et al., 2010a). In this context, Zhang et al. (2007) and Zhang et al. (2009) proposed a re-classification of long and short GRBs into Type I and II events associated with old and young stellar populations, respectively. Building on this concept, Virgili et al. (2009) recently carried out a joint analysis of the short GRB luminosity-redshift distribution and the BATSE distribution and concluded that of the bursts classified as short have negligible delay times and therefore directly track the cosmic star formation history. These authors therefore conclude that most short GRBs have massive star progenitors similar to those of long GRBs.
Here we take a different approach to exploring the relation between short GRBs and stellar mass, the short GRB delay time distribution, the possibility that short GRBs also track star formation, and whether such a connection indicates a relation to long GRB progenitors. Our study relies on multi-band optical and near-infrared observations of short GRB host galaxies from which we extract the relevant stellar population properties: mass and age. We confront the resulting mass distribution with the general galaxy stellar mass function to assess the relation to mass for the population as a whole, and separately for the early- and late-type hosts. We also use the inferred stellar population ages to place constraints on the typical delay times in early- and late-type hosts. Furthermore, we uniformly re-analyze the optical/near-IR spectral energy distributions of long GRB hosts to allow a direct comparison with the inferred properties of short GRB hosts. This allows for a comparison of the stellar populations in the two host samples with greater diagnostic power than the use of secondary indicators such as the luminosity-redshift or distributions.
The plan of the paper is as follows. The sample properties and optical/near-IR observations are summarized in §2. The stellar population models and fitting procedure are described in §3. In §4 we describe the resulting distributions of stellar masses and ages for a range of models and assumptions. We confront the mass distribution of short GRB hosts with the galaxy mass function in §5.1, and compare the stellar population properties of long and short GRB hosts in §5.2. We draw conclusions about the delay times of short GRB progenitors in the context their relation to mass and star formation in §5.3, and summarize our key findings in §6.
2. Short GRB Sample and Observations
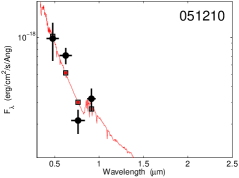
The sample of short GRB hosts described in this paper includes 19 galaxies, of which 9 have been identified in coincidence with optical afterglow positions (Berger et al., 2005; Fox et al., 2005; Hjorth et al., 2005; Covino et al., 2006; Soderberg et al., 2006; Berger et al., 2009; D’Avanzo et al., 2009; Graham et al., 2009; McBreen et al., 2010; Rowlinson et al., 2010a), 8 have been identified in coincidence with Swift/X-ray Telescope (XRT) error circles (e.g., Bloom et al. 2006; Berger et al. 2007), and 2 (GRBs 070809 and 090515) have been identified as putative hosts based on chance coincidence probabilities for bursts with optical afterglows and no coincident host galaxies (Berger, 2010a). Two of the hosts (051210 and 070729) do not have spectroscopic redshift measurements, and we infer photometric redshifts as part of the stellar population analysis presented here (§3). In the analysis below we address the properties and implications of the full sample, as well as the subset of secure host associations (i.e., those found in coincidence with optical afterglow positions). The properties of the bursts are summarized in Table 1. We note that a few additional secure hosts have photometric measurements in only optical filters and no spectroscopic redshifts (e.g., GRBs 060121 and 060313); these do not allow us to infer the required photometric redshifts, stellar masses, and ages with any confidence.
2.1. Optical and Near-IR Observations
We obtained multi-band optical and near-IR observations that cover rest wavelengths across the Balmer break and in the near-IR. This allows us to robustly assess the stellar population ages and the stellar masses. Optical observations were obtained with the Low Dispersion Survey Spectrograph (LDSS3) on the Magellan/Clay 6.5-m telescope, and the Gemini Multi-Object Spectrograph (GMOS; Hook et al. 2004) on the Gemini North and South 8-m telescopes. Near-IR observations were performed with the Persson’s Auxiliary Nasmyth Infrared Camera (PANIC) on the Magellan/Baade 6.5-m telescope.
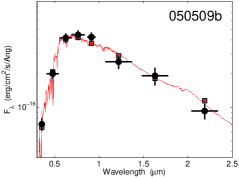
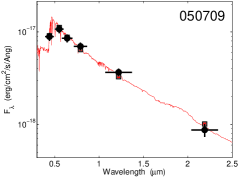
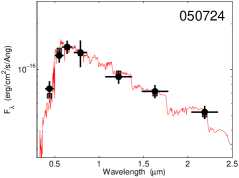
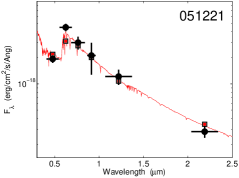
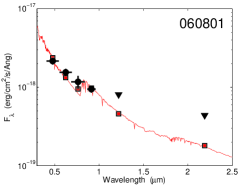
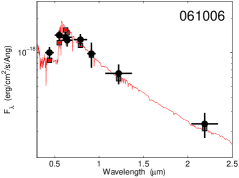
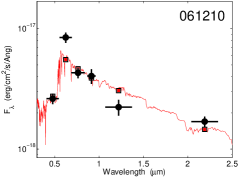
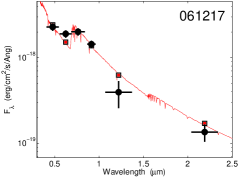
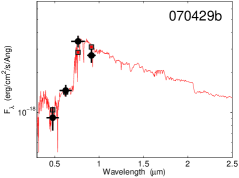
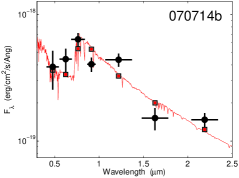
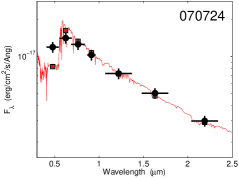
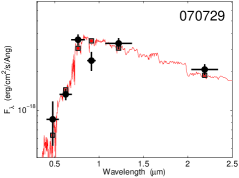
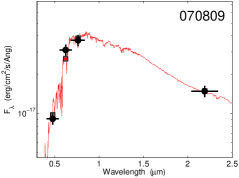
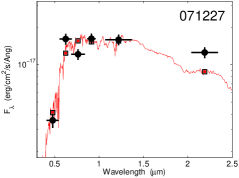
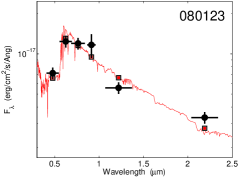
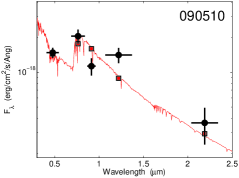
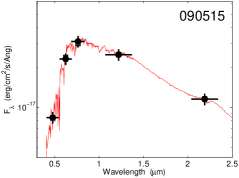
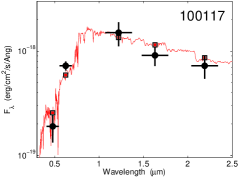
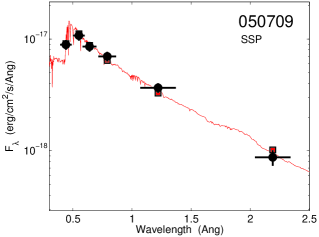
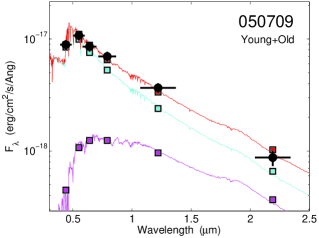
Reduction and photometry of the Magellan observations were performed using standard routines in IRAF, including dark frame subtraction and fringe correction for the PANIC data. The Gemini data were processed using the gemini package in IRAF. The resulting photometric measurements (in AB magnitudes and corrected for Galactic extinction using Schlegel et al. 1998) are listed in Table 1 and the spectral energy distributions (SEDs) are shown in Figure 1. As noted in Table 1, our host observations are supplemented by data from the literature for GRBs 050709 (Hjorth et al., 2005; Covino et al., 2006), 050724 (Gorosabel et al., 2006), 051221 (Soderberg et al., 2006), 061006 (D’Avanzo et al., 2009), and 070714b (Graham et al., 2009); for the host of GRB 050509b we used photometric measurements from the SDSS and 2MASS catalogs.
To convert fluxes to luminosities we use the standard cosmological parameters: km s-1 Mpc-1, , and .
3. Stellar Population Modeling
To determine the stellar masses and population ages of the short GRB host galaxies we fit the optical/near-IR SEDs with the stellar population models of Maraston (2005). These models provide the spectral luminosity as a function of wavelength for an equivalent of 1 M⊙. We use the single age simple stellar population (SSP) red horizontal branch morphology models with a Salpeter initial mass function. We further use Solar metallicity as generally appropriate for short GRB hosts (Berger, 2009); we note that changing the metallicity to Z⊙ results in a systematic decrease in the inferred masses and ages by at most dex.
To fit the observed SEDs with the SSP models, which exist for a discrete set of ages, we create an interpolated grid with several hundred logarithmically-spaced ages between 1 Myr and the age of the universe at each host’s redshift. We then transform the model spectral luminosities and wavelengths to the observer frame and convolve with the appropriate filter response functions to create model magnitudes. The best-fit model for each host is determined using minimization with the age of the population as the free parameter and the best-fit mass for each age (i.e., the normalization) determined by the equation:
| (1) |
where are the model fluxes, and are the observed fluxes and uncertainties, respectively (Table 1), and is the number of data points. The resulting best-fit single age SSP models are shown in Figure 1, and the inferred masses and ages are listed in Table 2.
The SSP models provide a robust estimate of the stellar masses and population ages for the early-type host galaxies, since they are dominated by old stellar populations, which exhibit only a mild variation in the mass-to-light ratio as a function of age. However, for the late-type hosts, which have on-going star formation, the SSP fits essentially provide light-weighted (rather than mass-weighted) values, and they can therefore severely under-estimate the total stellar mass and the mass-weighted age of the stellar population. These are the quantities we are interested in for a determination of whether short GRBs track stellar mass. We therefore use two approaches to assess the impact of older stellar populations for these hosts.
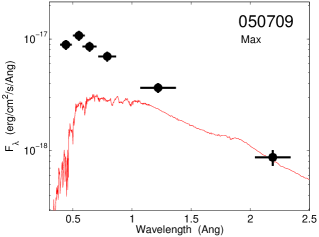
First, we determine the maximum possible masses by assuming that the mass of each host galaxy is dominated by a stellar population with the age of the universe at its redshift. Using the inferred (maximal) mass-to-light ratios from the Maraston (2005) models we use the available -band fluxes to extract the maximal masses. The resulting values are listed in Table 2, and provide an upper bound on the mass of each galaxy. An example of this approach compared to the single age SSP model is shown in Figure 2.
Second, to provide a more realistic estimate we use a combined young+old SSP model to fit the entire SED of each late-type host galaxy and hence to determine the breakdown of masses in the young and old populations. The old population is fixed at the age of the universe at each host redshift, and we fit for the age of the young population and the mass ratio of the two populations; the old population mass is given by Equation 1 and the young population mass then trivially follows from the best-fit ratio. The results are summarized in Table 2 and an example of this approach compared to the single age SSP model is shown in Figure 2. We note that for some of the hosts a wide range of solutions is possible, including negligible mass in the old population (i.e., a solution identical to the original single age SSP fit). For these hosts we list the maximum possible mass in the old component within of the best fit. As expected, the young+old models lead to total masses intermediate between the single age SSP and the maximal masses. The addition of the old population also leads to systematically younger ages for the young population relative to the best-fit single age SSP values.
With the exception of the host of GRB 071227 we find that host extinction is not required for a satisfactory fit of the observed SEDs. The addition of host extinction will generally result in systematically younger ages and somewhat higher masses for the young stellar population due to the increase in UV luminosity. On the other hand, extinction does not significantly affect the total stellar mass since it is determined by the near-IR luminosity. We find that the addition of mag in the rest-frame of the host tends to change the SSP ages and masses (or the young population ages and masses in the young+old models) by at most dex and dex, respectively. Larger extinction values significantly degrade the goodness of fit.
Finally, to uniformly compare the stellar masses and ages of short and long GRB hosts, we fit the SEDs of the long GRB hosts from Savaglio et al. (2009) in a similar redshift range () with the same stellar population models and techniques used here, but with a sub-solar metallicity. We derive single age SSP values, and maximal masses using the -band photometry alone. The results are listed in Table 3. As in the case of the short GRB hosts, we do not include the effects of extinction, unless strictly required by the goodness of fit (see Table 3).
4. Host Galaxy Stellar Masses and Ages
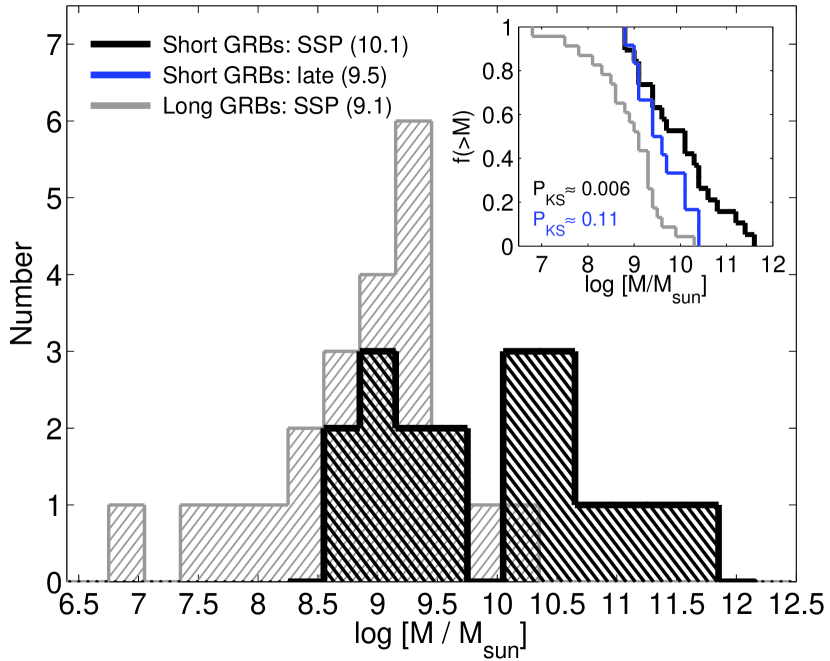
The distribution of stellar masses derived from the single age SSP fits is shown in Figure 3. We find that the masses span three orders of magnitude, M⊙, with a median value of M⊙. Dividing the sample into early- and late-type host galaxies we find that the former span the range M⊙, while the latter have much lower masses of M⊙. The clear distinction between the two samples partially reflects the bias of single age SSP models, which for the late-type hosts are dominated by the young stellar population and hence under-estimate the contribution of any older stellar populations. If we restrict the sample to the host galaxies identified in coincidence with optical afterglows we find a median mass of M⊙. This value is lower than for the full sample because 3 of the 5 early-type hosts, which have the largest SSP masses, are associated with XRT positions (GRB 050509b) or inferred from chance coincidence arguments (GRBs 070809 and 090515).
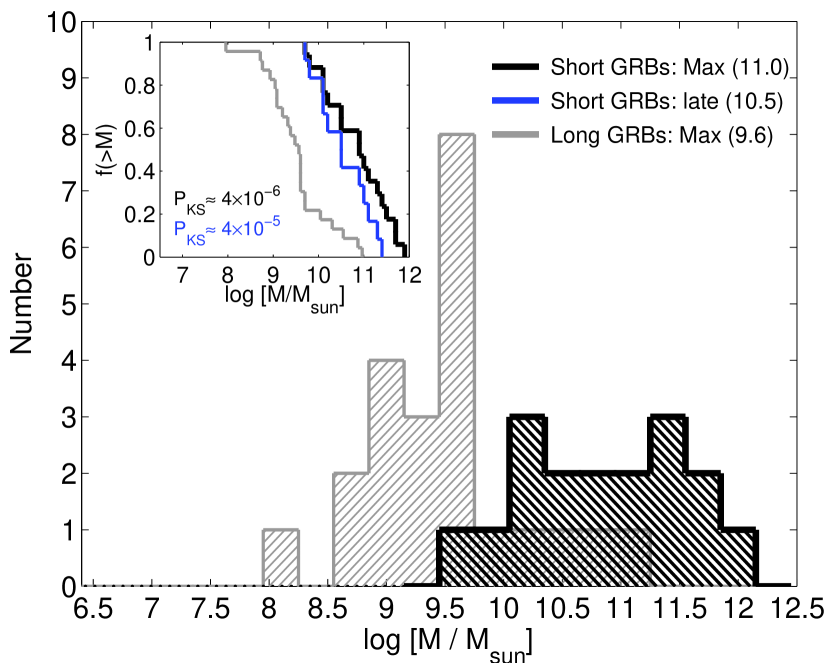
The differences between the masses of the early- and late-type hosts are less severe in the case of the maximal masses (Figure 4). For the population as a whole we find a reduced range of M⊙. The median mass is M⊙, about an order of magnitude larger than for the single age SSP masses, and only slightly larger than the stellar mass of the Milky Way. As expected, the ratios of maximal to SSP masses for the early-type hosts are modest, , since these hosts are already dominated by old stellar populations. However, for the late-type hosts the corrections are significant, , with a median ratio of about an order of magnitude. If we again restrict the sample to host galaxies identified in coincidence with optical afterglows we find a median mass of M⊙, lower than for the full sample due to the preferential rejection of early-type hosts.
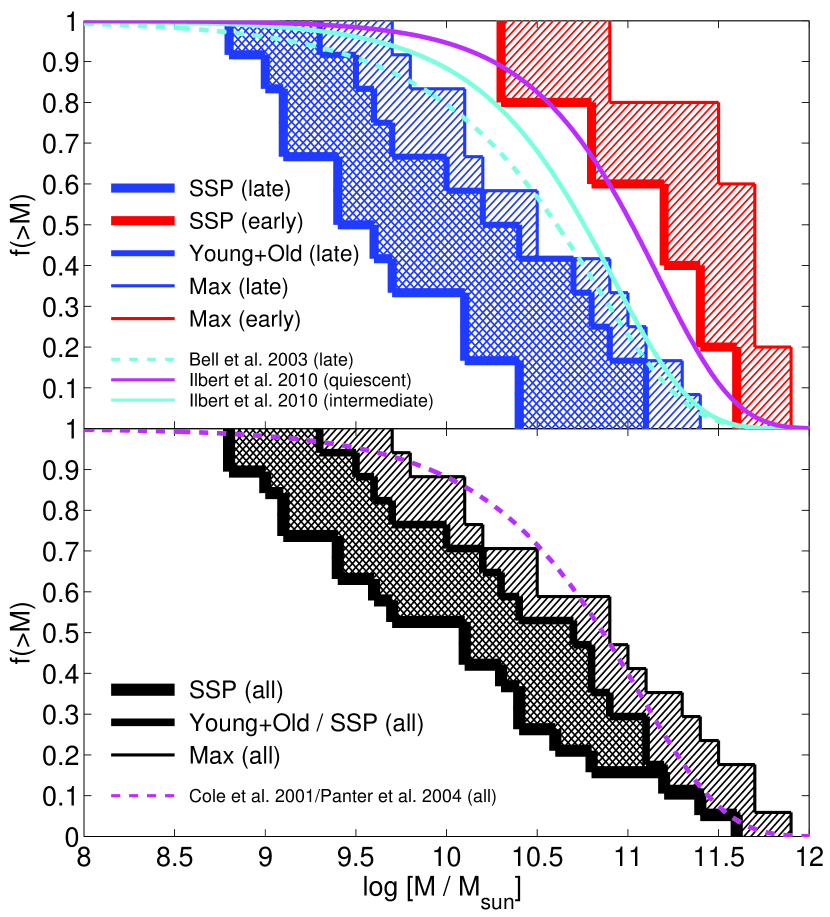
While the maximal masses provide a robust upper bound, they are likely to over-estimate the true stellar mass, particularly for the early-type hosts which do not suffer from the young-population bias present in the late-type hosts. If we instead use the young+old models for the late-type hosts, and the single age SSP values for the early-type hosts, we find masses of M⊙, with a median of M⊙. The cumulative distributions of stellar masses for the host population as a whole, and for the subsets of early- and late-type galaxies are shown in Figure 5. The Figure clearly highlights the larger masses of the early-type hosts; even when comparing SSP masses for the early-type hosts with maximal masses for the late-type hosts the median for the former is larger by about a factor of 5.
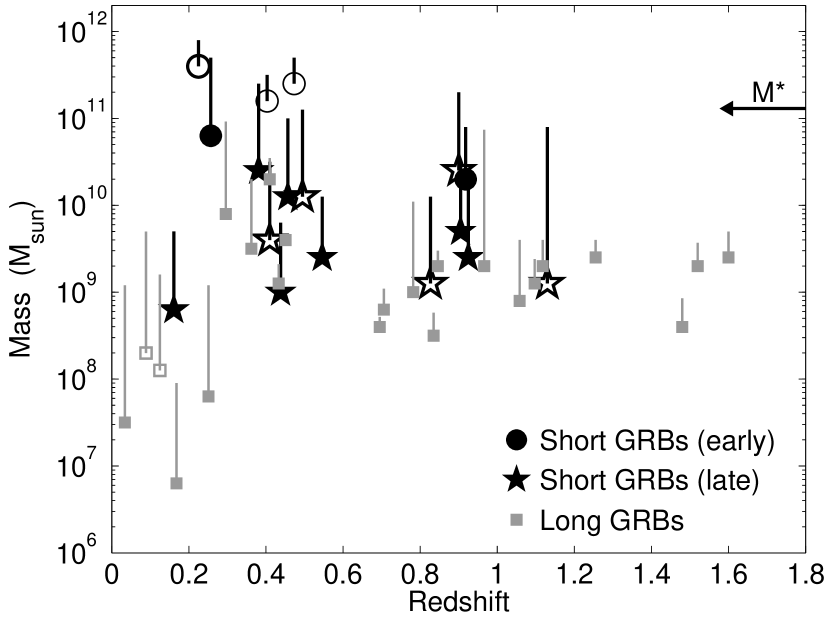
The range of inferred stellar masses does not appear to depend on redshift. As shown in Figure 6, the stellar masses are nearly uniform with redshift, both for the single age SSP and maximal values. We do find a preference for lower redshift among the subset of early-type hosts, and since these galaxies are more massive, they lead to somewhat higher masses at lower redshift ( vs. ). A similar conclusion is reached even if we restrict the sample to only the hosts identified in coincidence with optical afterglows.
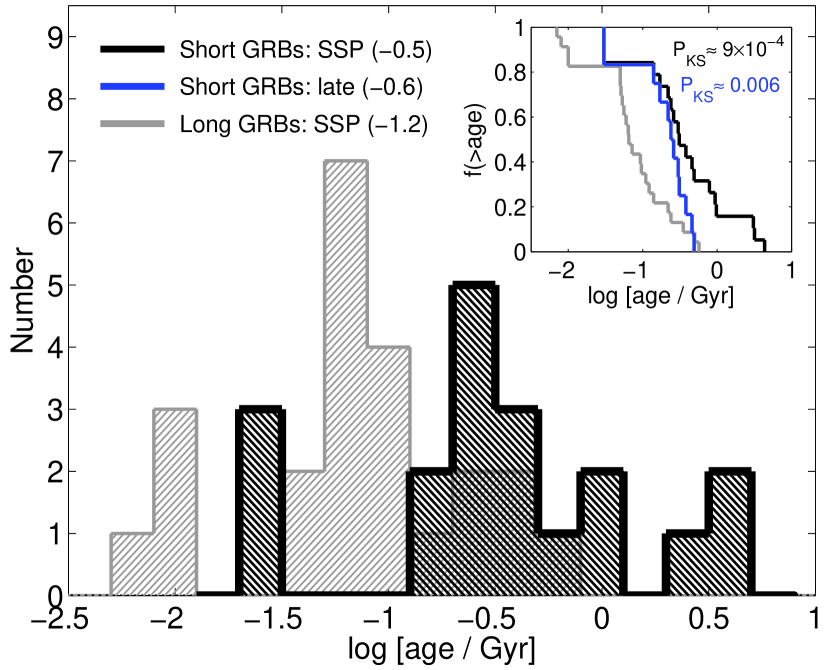
We next turn to the distribution of stellar population ages. These values are only available for the single age SSP models since for the maximal and young+old models we assume a population with the age of the universe at each host redshift. The distribution of ages is shown in Figure 7, with the values ranging from about 30 Myr to 4.4 Gyr. The median age is Gyr for the full sample, with Gyr for the subset of late-type hosts and Gyr for the subset of early-type hosts. The median value for the subset of hosts identified in coincidence with optical afterglows is identical to the median for the late-type hosts. As indicated above, the young+old models result in somewhat younger ages for the young stellar population since some of the near-IR flux is accounted for by the forced old population. The median age for the young population in this model is about 0.1 Gyr (Table 2).
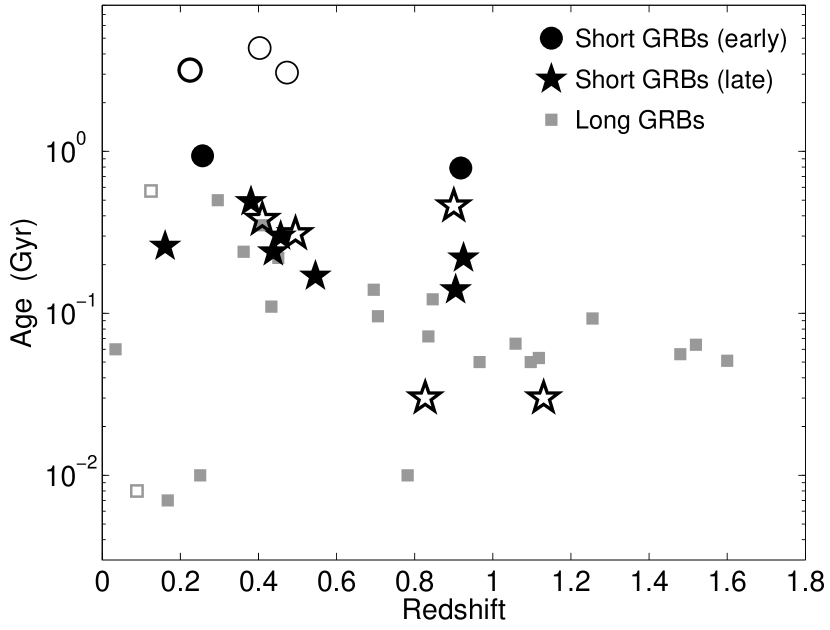
Finally, in Figure 8 we plot age as a function of redshift for the single age SSP models. For the full sample we find a significant negative correlation between the two quantities, with a Kendall’s value of , corresponding to a null hypothesis (no-correlation) probability of only . However, the correlation appears to be due mainly to hosts identified in coincidence with XRT error circles and through chance coincidence probabilities. If we restrict the sample to hosts identified in coincidence with optical afterglows, then no significant correlation is found (Kendall’s value of -0.33 with a no-correlation probability of ). We note that for the maximal and young+old models we cannot associate an age with the old stellar population due to our conservative assumption that it is equivalent to the age of the universe.
4.1. Long GRB Host Galaxies
For the long GRB host comparison sample we derive single age SSP parameters, as well as maximal masses. For the SSP model we find a range of M⊙, with a median value of M⊙ (Figure 3). The maximal masses span M⊙, with a median value of M⊙ (Figure 4). Our median SSP and maximal values bracket the median masses of M⊙ and M⊙ found by Savaglio et al. (2009) and Levesque et al. (2010b), respectively. We also note that the median ratio of for the long GRB hosts is more modest than for the late-type short GRB hosts (see above), indicating that long GRB hosts do not generally harbor massive old stellar populations.
As in the case of the short GRB hosts, we find no clear correlation between redshift and stellar mass, although the lowest redshift hosts () appear to have lower than average masses (Figure 6). These hosts also exhibit some of the largest ratios of , so the low masses may be at least partially due to their very young ages (4 of the 5 hosts are consistent with ages of only Myr; see Table 3 and Figure 8).
The SSP stellar population ages span about 10 to 570 Myr, with a median value of Myr. We find no clear correlation between the ages and redshifts of these hosts, although there appears to be a larger spread in ages at than at higher redshifts. The inferred ages are in good agreement with the analysis of Christensen et al. (2004) for a smaller sample.
Finally, we pay particular attention to the hosts of GRBs 060505 and 060614 since these nearby bursts had long durations but lacked an associated supernova, possibly pointing to a non-massive star origin (Della Valle et al., 2006; Fynbo et al., 2006; Gal-Yam et al., 2006; Gehrels et al., 2006; Ofek et al., 2007; Levesque & Kewley, 2007; Thöne et al., 2008). For the host of GRB 060505 we find a best-fit222This includes a rest-frame extinction of mag. A model with no extinction provides a poorer fit () and leads to an older age of 0.23 Gyr and a larger mass of M⊙. SSP age of about 10 Myr, with a stellar mass of about M⊙, while for the host of GRB 060614 we infer an age of 0.57 Gyr and a mass of M⊙ (Table 3). The maximal masses are M⊙ and M⊙, respectively. The inferred masses exhibit better agreement with the distribution of long GRB hosts than with short GRB hosts. The very young stellar population age for the host of GRB 060505 is similarly reminiscent of the long GRB host population (see also Ofek et al. 2007; Thöne et al. 2008), while the SSP age for the host of GRB 060614 is the largest of any of the long GRB hosts in this paper, and more closely in line with the short GRB host population.
5. Discussion
Having established the basic stellar population properties of the short GRB hosts in our sample we now address the fundamental questions listed in §1 through a comparison to the general galaxy mass function and the hosts of long GRBs.
5.1. Comparison to the Mass Distribution of Galaxies
The question of whether the short GRB rate tracks stellar mass alone can be addressed through two statistical tests: (i) the fraction of short GRBs in early- and late-type galaxies; and (ii) the relation of the host stellar masses to the general galaxy mass function.
5.1.1 Host Demographics
In the redshift range under consideration here () about an equal fraction of the cosmic stellar mass budget resides in early- and late-type galaxies (e.g., Ilbert et al. 2010). Therefore, if short GRBs track stellar mass alone we expect a roughly one-to-one ratio of galaxy types. This does not appear to be the case. For example, within the sample of short GRBs with optical afterglows (19 events), only 2 are unambiguously hosted by early-type galaxies (GRBs 050724 and 100117; Berger et al. 2005, Fong et al. in prep.), while 8 are unambiguously hosted by late-type galaxies; the probability of obtaining this ratio from an intrinsic one-to-one distribution is only 0.04. The identity of the remaining 9 hosts is unclear at the present due to their faintness or the lack of underlying galaxies at the burst positions. Still, unless nearly all of these bursts were hosted by early-type galaxies, the resulting ratio appears to be skewed in favor of late-type host galaxies with on-going star formation activity. We note that the same result holds true if we consider the bursts with only X-ray afterglow positions and identified hosts.
Thus, the host galaxy demographics suggest that short GRBs do not track stellar mass alone, or phrased alternatively, they do not have a delay time distribution that is skewed to old ages of Gyr. It is possible, however, that this result is influenced by secondary factors such as the typical circumburst density or intrinsic differences in the energy scale and afterglow brightness as a function of galaxy type (possibly reminiscent of the differences in peak luminosity for Type Ia supernovae in early- and late-type galaxies; Hamuy et al. 2000; Mannucci et al. 2006). If such differences lead to fainter afterglows (or prompt emission) for short GRBs in early-type galaxies, this would suppress the early-type fraction. Although the modest size of the host sample, and the substantial fraction of short GRBs with only -ray positions ( of all events), prevent definitive conclusions, it does not appear that the optical afterglows of short GRBs in early- and late-type galaxies are distinct (Berger, 2010a).
Thus, our preliminary conclusion from the host demographics is that short GRBs do not appear to track the cosmic stellar mass fraction in early- and late-type galaxies.
5.1.2 Comparison to the Galaxy Mass Function
We next turn to a comparison of the inferred stellar masses with the galaxy mass function. The cumulative distribution of stellar masses for the short GRB hosts is shown in Figure 5 with the range of possible masses bounded by the single age SSP and maximal values. We also present a breakdown of the sample into early- and late-type galaxies, each spanning the same range. For the late-type hosts, the intermediate young+old values are also shown. To compare these distributions to the distribution of galaxy masses we also plot the cumulative stellar mass function weighted by mass, i.e., the fraction of stellar mass in galaxies above some mass, , given by the equation:
| (2) |
where is the Schechter mass function:
| (3) |
We use several determinations of in this comparison, including the Cole et al. (2001) mass function from the 2MASS/2dF catalogs for all galaxy types at ( M⊙, ); the nearly identical Panter et al. (2004) mass function from SDSS for all galaxy types at ( M⊙, ); the Bell et al. (2003) mass function for late-type galaxies from 2MASS/SDSS converted to a Salpeter IMF for comparison with our inferred values ( M⊙, ); and the Ilbert et al. (2010) mass functions from the COSMOS survey for quiescent galaxies at ( M⊙, ) and intermediate-activity galaxies at ( M⊙, ), matched to the redshifts of the early- and late-type short GRB host galaxies in our sample. The resulting distributions of for the various mass functions are shown in Figure 5. The median of each distribution is close to the value of , but also depends on the value of (Cole et al. 2001: M⊙; Panter et al. 2004: M⊙; Bell et al. 2003: M⊙; Ilbert et al. 2010: M⊙ for intermediate-activity and M⊙ for quiescent).
In §4 we demonstrated that the median single age SSP mass for the short GRB host sample is M⊙, or333In the conversion to units of we use the mass function appropriate to each galaxy type, or the combined sample. , well below the expected value if the short GRB rate tracked stellar mass. The result is even more discrepant if we restrict the sample to only the late-type hosts, with a median of about . On the other hand, for the early-type hosts we find a median of about , suggesting that they are drawn from the early-type galaxy mass function.
Using the maximal masses for the full sample we find a median stellar mass of about , while for the subset of late-type hosts the median is about ; the maximal masses of the early-type hosts lead to a large median mass of about , suggesting that they are likely over-estimates of the true stellar mass. Finally, using the young+old stellar masses for the late-type hosts the median mass is about . Thus, we find that the distribution of stellar masses for the late-type hosts is shifted to a somewhat lower value than the expected median of the galaxy mass function, while the early-type hosts have a similar median to the galaxy mass function.
Beyond the comparison of median values, we further assess the agreement (or lack thereof) between the short GRB hosts and galaxy mass functions using the Kolmogorov-Smirnov (K-S) test. For the full sample there is negligible probability that the distribution of single age SSP masses is drawn from the galaxy mass function, with . On the other hand, for the maximal mass distribution the probability is indicating that for these masses the short GRB sample is fully consistent with the galaxy mass function. Using the intermediate case of SSP masses for the early-type hosts and the young+old masses for the late-type hosts, we find a probability of about 0.3, indicating that this combination is also fully consistent with the galaxy mass function.
Separating the early-type hosts we find that their SSP masses are fully consistent with the Ilbert et al. (2010) mass function of quiescent galaxies (); their large maximal masses, on the other hand, are inconsistent with the mass function, with . Finally, for the late-type hosts we find a clear inconsistency of the single age SSP masses with the Ilbert et al. (2010) mass function of intermediate-activity galaxies, with . However, the maximal mass distribution is fully consistent with the mass function (), while the young+old mass distribution is marginally consistent ().
To summarize, the distribution of short GRB host masses is compatible with the overall mass distribution of galaxies only if their stellar masses are given by the SSP masses for the early-type hosts and the maximal or young+old masses for the late-type hosts. Since the opposite scenario (maximal masses for the early-type hosts and SSP masses for the late-type hosts) is unlikely, we conclude that the existing sample of short GRB hosts is consistent with the galaxy mass function. Equivalently, this means that short GRBs may indeed track stellar mass alone. However, we caution that the host demographics seem to be at odds with the expected equal fractions of total stellar mass in early- and late-type galaxies, unless nearly all of the unidentified hosts are early-type galaxies. This, along with the somewhat lower than expected masses of the late-type hosts, leaves open the possibility that at least a subset of short GRB progenitors track star formation activity rather than stellar mass.
5.2. Comparison to Long GRBs
Despite the possibility that some short GRB progenitors may track star formation activity, we find that the inferred stellar masses and population ages of short GRB hosts are generally distinct from those of long GRB hosts in both the single age SSP and maximal models. Most importantly, this is true for the subset of late-type hosts. In the framework of the single age SSP model we find a K-S probability of only that the long and short GRB hosts are drawn from the same mass distribution. The probability is higher for the subset of late-type short GRB hosts, (Figure 3). However, since the SSP values represent the mass of only the young stellar populations, they are mostly reflective of the star formation activity rather than the total stellar mass. If we use instead the maximal masses, the K-S probability that the long GRB hosts and late-type hosts of short GRBs are drawn from the same sample is negligible, (Figure 4), demonstrating that they are distinct galaxy populations. A similar conclusion is apparent from a comparison of the single age SSP population ages. The K-S probability that the long GRB hosts and late-type hosts of short GRBs are drawn from the same distribution is only .
Thus, the long GRB hosts have significantly lower stellar masses than the subset of late-type short GRB hosts, and their young stellar population are significantly younger. Indeed, a comparison of the long GRB host maximal masses to the Ilbert et al. (2010) mass function of high-activity galaxies at (appropriate for the long GRB sample considered here) indicates a K-S probability of only that the long GRB hosts are drawn from the galaxy mass function. This is consistent with our understanding that their massive star progenitors select galaxies by star formation (and perhaps additional factors such as metallicity).
The apparent distinction between long GRB hosts and the late-type hosts of short GRBs in terms of their stellar masses and young population ages strengthens our similar previous conclusion based on their star formation rates, specific star formation rates, luminosities, and metallicities (Berger, 2009), as well as physical sizes (Fong et al., 2010). In essentially every property the late-type short GRB hosts point to a population of more quiescent, massive, and evolved galaxies than the hosts of long GRBs. We conclude that this rules out the idea that short GRB progenitors in late-type hosts are massive stars identical to long GRB progenitors (Virgili et al., 2009), even if the short GRBs in late-type galaxies indeed track star formation rather than stellar mass.
5.3. The Delay Time Distribution
A determination of the delay function from the derived stellar population ages is complicated by two primary factors. First, we have to assume that the short GRB progenitors in each host were formed within the inferred stellar population. This assumption is justified statistically both for an association of the progenitors with stellar mass and with star formation activity, as long as we can appropriately normalize the rates of short GRBs. Second, while we can determine single age SSP ages from the broad-band photometry, these data are not sufficient to provide an age breakdown (by mass) for multiple stellar components. Indeed, for our hybrid young+old model we had to fix the age of the old population (to the age of the universe, in this case). Still, we find that in the young+old model, the bulk of the mass (; Table 2) is contained in the old stellar population, and so the progenitors would have “old” ages () if they tracked stellar mass.
As a result of these limitations we can only explore the implications of two main scenarios, namely that short GRBs track mass and/or star formation activity. In the context of the former scenario we have shown in §5.1 that the short GRBs in early-type hosts trace stellar mass. Therefore, we can use their SSP ages to provide a rough estimate of the progenitor ages, which we find to be Gyr, with a median of about 3 Gyr. On the other hand, for the late-type hosts (for which we can extract no credible information on the mass-weighted stellar population age), we can infer a typical delay relative to the most recent star formation episode under the assumption that these progenitors track star formation activity. We find SSP ages of Gyr, with a median of about 0.25 Gyr, or young+old ages of about Gyr with a median of about 0.1 Gyr.
Thus, if short GRBs follow both stellar mass (in early-type galaxies) and star formation activity (in late-type galaxies), the typical delay times are about 3 and 0.2 Gyr, respectively.
6. Conclusions
Using multi-band photometry for 19 short GRB host galaxies we extracted stellar masses and ages under the assumption of single age populations, combined young+old populations, and maximal mass populations. The resulting values allow us to investigate whether short GRBs track the cosmic stellar mass distribution, to estimate their typical delay times if mass and/or star formation play a role, and to investigate whether short GRBs in late-type galaxies share progenitors with long GRBs. The basic result is that the early-type host SSP masses track the mass distribution of early-type galaxies, while for the late-type hosts this is only the case if they have maximal or possibly young+old masses. However, the host demographics do not appear to follow the expected mass-weighted one-to-one ratio, unless nearly all of the current hosts of unknown type are early-type galaxies. We note that additional support for a short GRB rate tracking stellar mass is provided by high resolution Hubble Space Telescope (HST) imaging (Fong et al., 2010), which indicates that the locations of these bursts better track stellar mass (rest-frame optical light) than star formation (rest-frame UV light).
We further find that the late-type hosts of short GRBs and the hosts of long GRBs are distinct in their stellar masses and young population ages, with the former having higher masses by about an order of magnitude and older ages by about a factor of 4. This result is in good agreement with the previous conclusion that short GRB hosts have lower star formation rates and higher metallicities compared to long GRB hosts (Berger, 2009).
These observational results lead to several crucial conclusions regarding the nature of short GRB progenitors:
-
•
Short GRB progenitors are generally consistent with arising in old stellar populations that track the cosmic stellar mass distribution.
-
•
Despite this overall consistency, the dearth of early-type hosts, and the somewhat lower than expected masses of the late-type hosts indicate that short GRB progenitors in late-type galaxies may partially track star formation activity.
-
•
If short GRB progenitors track only stellar mass, then the typical stellar population ages of the early-type hosts indicate a typical progenitor age (or delay time) of Gyr (with a range of Gyr). If the progenitors in late-type hosts track star formation activity, the resulting typical delay is about 0.2 Gyr.
-
•
Even if short GRBs in late-type galaxies track star formation activity, their delay times are at least a few times longer than for long GRBs, indicating that they do not share the same progenitors. This is also supported by the substantially different mass distributions of long and short GRB hosts.
The conclusion that short GRBs are consistent with tracking stellar mass provides additional support for the compact object merger model, although it does not rule out other progenitors with substantial time delays (e.g., binary white dwarf mergers, or white dwarf and neutron star accretion-induced collapse). In the context of these various models, it is possible that a short delay channel exists, but a substantial population with delays of only a few Myr or even tens of Myr (e.g., Belczynski et al. 2006) is not supported by the data.
The clear distinction between short and long GRB hosts, and the inferred delay times, call into question the results of previous analyses claiming a substantial overlap between long and short GRB progenitors. For example, it demonstrates that blunt statistical tools such as the distribution (Virgili et al., 2009) do not have sufficient time resolution to distinguish between truly young populations such as long GRB massive star progenitors, and intermediate-age progenitors as inferred here if short GRBs in late-type galaxies track star formation activity. Similarly, these results call into question a recent proposal that some short GRBs are due to widely off-axis “cocoon” emission from long GRBs (Lazzati et al., 2010).
Our results also demonstrate that caution should be taken with the proposed re-classification of short and long GRBs into Type I and II events, marking old and young progenitors, respectively (Zhang et al., 2007, 2009). Such a new bimodal classification may lead to the erroneous conclusion that short GRBs in late-type galaxies (even if they track the on-going star formation activity) share the same progenitors as long GRBs (e.g., Virgili et al. 2009) since both would be classified as Type II. At the very least, such a new classification scheme may require a further breakdown of the Type II events into those that result from massive stars versus those that simply track star formation activity with a modest delay, e.g., Type IIa and IIb. Clearly, this is beyond the scope of the current short GRB sample. We note, by analogy, that for Type Ia supernovae a connection with both stellar mass and star formation activity has been demonstrated (Mannucci et al., 2006; Sullivan et al., 2006; Aubourg et al., 2008; Brandt et al., 2010), but the prompt channel is not related to the massive star progenitors of Type II and Ib/c supernovae.
We conclude by noting that two primary refinements of our analysis technique can be made with future observations. First, high signal-to-noise ratio spectra can be used to extract more detailed star formation histories than the available broad-band photometry. Such reconstructed histories will allow us to more robustly estimate the delay time distribution in the context of a mass-weighted rate (c.f., Aubourg et al. 2008 for Type Ia supernovae). Second, high angular resolution multi-band imaging with HST will allow us to determine spatially-resolved ages at the locations of short GRBs and hence to further refine the connection with young or old populations. Both of these techniques are within our grasp in the near future.
References
- Aubourg et al. (2008) Aubourg, É., Tojeiro, R., Jimenez, R., Heavens, A., Strauss, M. A., & Spergel, D. N. 2008, A&A, 492, 631
- Belczynski et al. (2006) Belczynski, K., Perna, R., Bulik, T., Kalogera, V., Ivanova, N., & Lamb, D. Q. 2006, ApJ, 648, 1110
- Bell et al. (2003) Bell, E. F., McIntosh, D. H., Katz, N., & Weinberg, M. D. 2003, ApJS, 149, 289
- Berger (2009) Berger, E. 2009, ApJ, 690, 231
- Berger (2010a) Berger, E. 2010a, arXiv:1007.0003
- Berger (2010b) Berger, E. 2010b, arXiv 1005.1068
- Berger et al. (2009) Berger, E., Cenko, S. B., Fox, D. B., & Cucchiara, A. 2009, ApJ, 704, 877
- Berger et al. (2007) Berger, E., et al. 2007, ApJ, 664, 1000
- Berger et al. (2005) Berger, E., et al. 2005, Nature, 438, 988
- Bloom et al. (2006) Bloom, J. S., et al. 2006, ApJ, 638, 354
- Brandt et al. (2010) Brandt, T. D., Tojeiro, R., Aubourg, É., Heavens, A., Jimenez, R., & Strauss, M. A. 2010, AJ, 140, 804
- Christensen et al. (2004) Christensen, L., Hjorth, J., & Gorosabel, J. 2004, A&A, 425, 913
- Cole et al. (2001) Cole, S., et al. 2001, MNRAS, 326, 255
- Covino et al. (2006) Covino, S., et al. 2006, A&A, 447, L5
- D’Avanzo et al. (2009) D’Avanzo, P., et al. 2009, A&A, 498, 711
- Della Valle et al. (2006) Della Valle, M., et al. 2006, Nature, 444, 1050
- Eichler et al. (1989) Eichler, D., Livio, M., Piran, T., & Schramm, D. N. 1989, Nature, 340, 126
- Fong et al. (2010) Fong, W., Berger, E., & Fox, D. B. 2010, ApJ, 708, 9
- Fox et al. (2005) Fox, D. B., et al. 2005, Nature, 437, 845
- Fynbo et al. (2006) Fynbo, J. P. U., et al. 2006, Nature, 444, 1047
- Gal-Yam et al. (2006) Gal-Yam, A., et al. 2006, Nature, 444, 1053
- Gehrels et al. (2008) Gehrels, N., et al. 2008, ApJ, 689, 1161
- Gehrels et al. (2006) Gehrels, N., et al. 2006, Nature, 444, 1044
- Gorosabel et al. (2006) Gorosabel, J., et al. 2006, A&A, 450, 87
- Graham et al. (2009) Graham, J. F., et al. 2009, ApJ, 698, 1620
- Hamuy et al. (2000) Hamuy, M., Trager, S. C., Pinto, P. A., Phillips, M. M., Schommer, R. A., Ivanov, V., & Suntzeff, N. B. 2000, AJ, 120, 1479
- Hjorth et al. (2005) Hjorth, J., et al. 2005, Nature, 437, 859
- Hook et al. (2004) Hook, I. M., Jørgensen, I., Allington-Smith, J. R., Davies, R. L., Metcalfe, N., Murowinski, R. G., & Crampton, D. 2004, PASP, 116, 425
- Ilbert et al. (2010) Ilbert, O., et al. 2010, ApJ, 709, 644
- Kann et al. (2008) Kann, D. A., et al. 2008, arXiv:0804.1959
- Lazzati et al. (2010) Lazzati, D., Morsony, B. J., & Begelman, M. C. 2010, ApJ, 717, 239
- Levan et al. (2006) Levan, A. J., Wynn, G. A., Chapman, R., Davies, M. B., King, A. R., Priddey, R. S., & Tanvir, N. R. 2006, MNRAS, 368, L1
- Levesque et al. (2010a) Levesque, E. M., Berger, E., Kewley, L. J., & Bagley, M. M. 2010a, AJ, 139, 694
- Levesque & Kewley (2007) Levesque, E. M., & Kewley, L. J. 2007, ApJ, 667, L121
- Levesque et al. (2010b) Levesque, E. M., Kewley, L. J., Berger, E., & Jabran Zahid, H. 2010b, arXiv:1006.3560
- Mannucci et al. (2006) Mannucci, F., Della Valle, M., & Panagia, N. 2006, MNRAS, 370, 773
- Maraston (2005) Maraston, C. 2005, MNRAS, 362, 799
- McBreen et al. (2010) McBreen, S., et al. 2010, A&A, 516, 71
- Metzger et al. (2008) Metzger, B. D., Quataert, E., & Thompson, T. A. 2008, MNRAS, 385, 1455
- Nakar (2007) Nakar, E. 2007, Phys. Rep., 442, 166
- Narayan et al. (1992) Narayan, R., Paczynski, B., & Piran, T. 1992, ApJ, 395, L83
- Nysewander et al. (2009) Nysewander, M., Fruchter, A. S., & Pe’er, A. 2009, ApJ, 701, 824
- Ofek et al. (2007) Ofek, E. O., et al. 2007, ApJ, 662, 1129
- Paczynski (1991) Paczynski, B. 1991, Acta Astronomica, 41, 257
- Panter et al. (2004) Panter, B., Heavens, A. F., & Jimenez, R. 2004, MNRAS, 355, 764
- Qin et al. (1998) Qin, B., Wu, X., Chu, M., Fang, L., & Hu, J. 1998, ApJ, 494, L57
- Rowlinson et al. (2010a) Rowlinson, A., et al. 2010a, arXiv:1007.2185
- Rowlinson et al. (2010b) Rowlinson, A., et al. 2010b, arXiv:1006.0487
- Savaglio et al. (2009) Savaglio, S., Glazebrook, K., & Le Borgne, D. 2009, ApJ, 691, 182
- Schlegel et al. (1998) Schlegel, D. J., Finkbeiner, D. P., & Davis, M. 1998, ApJ, 500, 525
- Soderberg et al. (2006) Soderberg, A. M., et al. 2006, ApJ, 650, 261
- Sullivan et al. (2006) Sullivan, M., et al. 2006, ApJ, 648, 868
- Thöne et al. (2008) Thöne, C. C., et al. 2008, ApJ, 676, 1151
- Virgili et al. (2009) Virgili, F. J., Zhang, B., O’Brien, P., & Troja, E. 2009, arXiv:0909.1850
- Zhang et al. (2007) Zhang, B., Zhang, B., Liang, E., Gehrels, N., Burrows, D. N., & Mészáros, P. 2007, ApJ, 655, L25
- Zhang et al. (2009) Zhang, B., et al. 2009, ApJ, 703, 1696
- Zheng & Ramirez-Ruiz (2007) Zheng, Z., & Ramirez-Ruiz, E. 2007, ApJ, 665, 1220
| GRB | RA | Dec | OA? | Type | Filter | Refs. | ||
|---|---|---|---|---|---|---|---|---|
| (J2000) | (J2000) | (mag) | ||||||
| 050509b | 12h36m13.58s | 0.225 | N | E | u | SDSS | ||
| g | SDSS | |||||||
| r | SDSS | |||||||
| i | SDSS | |||||||
| z | SDSS | |||||||
| J | 2MASS | |||||||
| H | 2MASS | |||||||
| K | 2MASS | |||||||
| 050709 | 23h01m26.96s | - | 0.161 | Y | L | B | Hjorth et al. (2005) | |
| V | Covino et al. (2006) | |||||||
| R | Covino et al. (2006) | |||||||
| I | Covino et al. (2006) | |||||||
| J | This Work | |||||||
| K | This Work | |||||||
| 050724 | 16h24m44.36s | - | 0.257 | Y | E | U | Gorosabel et al. (2006) | |
| B | Gorosabel et al. (2006) | |||||||
| V | Gorosabel et al. (2006) | |||||||
| R | Gorosabel et al. (2006) | |||||||
| I | Berger et al. (2005) | |||||||
| J | Gorosabel et al. (2006) | |||||||
| H | Gorosabel et al. (2006) | |||||||
| K | Gorosabel et al. (2006) | |||||||
| 051210 | 22h00m41.26s | - | N | ? | g | This Work | ||
| r | This Work | |||||||
| i | This Work | |||||||
| z | This Work | |||||||
| K | This Work | |||||||
| 051221a | 21h54m48.62s | 0.546 | Y | L | g | his Work | ||
| r | Soderberg et al. (2006) | |||||||
| i | Soderberg et al. (2006) | |||||||
| z | Soderberg et al. (2006) | |||||||
| J | This Work | |||||||
| K | This Work | |||||||
| 060801 | 14h12m01.35s | 1.130 | N | L | g | This Work | ||
| r | This Work | |||||||
| i | This Work | |||||||
| z | This Work | |||||||
| J | This Work | |||||||
| K | This Work | |||||||
| 061006 | 07h24m07.66s | - | 0.438 | Y | L | B | D’Avanzo et al. (2009) | |
| V | D’Avanzo et al. (2009) | |||||||
| r | This Work | |||||||
| R | D’Avanzo et al. (2009) | |||||||
| I | D’Avanzo et al. (2009) | |||||||
| z | This Work | |||||||
| J | D’Avanzo et al. (2009) | |||||||
| K | This Work | |||||||
| 061210 | 09h38m05.27s | 0.410 | N | L | g | This Work | ||
| r | This Work | |||||||
| i | This Work | |||||||
| z | This Work | |||||||
| J | This Work | |||||||
| K | This Work | |||||||
| 061217 | 10h41m39.32s | - | 0.827 | N | L | g | This Work | |
| r | This Work | |||||||
| i | This Work | |||||||
| z | This Work | |||||||
| J | This Work | |||||||
| K | This Work | |||||||
| 070429b | 21h52m03.84s | - | 0.902 | N | L | g | This Work | |
| r | This Work | |||||||
| i | This Work | |||||||
| z | This Work | |||||||
| 070714b | 03h51m22.30s | 0.923 | Y | L | g | Graham et al. (2009) | ||
| r | Graham et al. (2009) | |||||||
| i | Graham et al. (2009) | |||||||
| z | Graham et al. (2009) | |||||||
| J | Graham et al. (2009) | |||||||
| H | Graham et al. (2009) | |||||||
| K | Graham et al. (2009) | |||||||
| 070724 | 01h51m13.96s | - | 0.457 | Y | L | g | This Work | |
| r | This Work | |||||||
| i | This Work | |||||||
| z | This Work | |||||||
| J | This Work | |||||||
| H | This Work | |||||||
| K | This Work | |||||||
| 070729 | 03h45m16.04s | - | N | ? | g | This Work | ||
| r | This Work | |||||||
| i | This Work | |||||||
| z | This Work | |||||||
| J | This Work | |||||||
| K | This Work | |||||||
| 070809 | 13h35m04.41s | - | 0.473 | Y | E | g | This Work | |
| r | This Work | |||||||
| i | This Work | |||||||
| K | This Work | |||||||
| 071227 | 03h52m31.26s | - | 0.381 | Y | L | g | This Work | |
| r | This Work | |||||||
| i | This Work | |||||||
| z | This Work | |||||||
| J | This Work | |||||||
| K | This Work | |||||||
| 080123 | 22h35m46.10s | - | 0.495 | N | L | g | This Work | |
| r | This Work | |||||||
| i | This Work | |||||||
| z | This Work | |||||||
| J | This Work | |||||||
| K | This Work | |||||||
| 090510 | 22h14m12.56s | - | 0.903 | Y | L | g | This Work | |
| i | This Work | |||||||
| z | This Work | |||||||
| J | This Work | |||||||
| K | This Work | |||||||
| 090515 | 10h56m36.11s | 0.403 | Y | E | g | This Work | ||
| r | This Work | |||||||
| i | This Work | |||||||
| J | This Work | |||||||
| K | This Work | |||||||
| 100117 | 00h45m04.7s | - | 0.920 | Y | E | g | Fong et al. in prep. | |
| r | Fong et al. in prep. | |||||||
| J | Fong et al. in prep. | |||||||
| H | Fong et al. in prep. | |||||||
| K | Fong et al. in prep. |
Note. — Properties and photometric measurements for short GRB host galaxies in this paper.
a Type indicates whether a galaxy is early-type (E) or late-type (L).
b Corrected for Galactic extinction (Schlegel et al., 1998).
c These bursts do not have coincident host galaxies. Magnitudes are provided for the galaxy with the lowest probability of chance coincidence (Berger, 2010a).
| SSP | Young+Old | |||||||||||
|---|---|---|---|---|---|---|---|---|---|---|---|---|
| GRB | Type | |||||||||||
| (Gyr) | (M⊙) | (Gyr) | (M⊙) | (Gyr) | (M⊙) | (M⊙) | ||||||
| 050509b | 0.225 | E | 3.18 | 11.6 | 0.7 | 11.9 | ||||||
| 050709 | 0.161 | L | 0.26 | 8.8 | 0.6 | 0.21 | 8.7 | 11.6 | 9.2 | 0.6 | 9.7 | |
| 050724 | 0.257 | E | 0.94 | 10.8 | 0.3 | 11.7 | ||||||
| 051210 | ? | 0.03 | 8.8 | 2.5 | ||||||||
| 051221 | 0.547 | L | 0.17 | 9.4 | 2.7 | 0.14 | 9.3 | 8.3 | 2.4 | 10.1 | ||
| 060801 | 1.130 | L | 0.03 | 9.1 | 1.2 | 0.03 | 9.1 | 5.4 | 1.9 | 10.9 | ||
| 061006 | 0.438 | L | 0.24 | 9.0 | 1.3 | 0.09 | 8.5 | 9.1 | 9.7 | 0.8 | 9.8 | |
| 061210 | 0.410 | L | 0.38 | 9.6 | 4.2 | 0.38 | 9.5 | 9.1 | 5.2 | 10.5 | ||
| 061217 | 0.827 | L | 0.03 | 9.1 | 1.7 | 0.03 | 9.0 | 6.6 | 2.1 | 10.1 | ||
| 070429b | 0.902 | L | 0.46 | 10.4 | 1.8 | 0.35 | 10.2 | 6.3 | 2.6 | 11.3 | ||
| 070714b | 0.923 | L | 0.22 | 9.4 | 2.9 | 0.10 | 9.1 | 6.2 | 3.3 | 10.2 | ||
| 070724 | 0.457 | L | 0.30 | 10.1 | 2.1 | 0.01 | 8.3 | 8.9 | 10.9 | 0.3 | 11.0 | |
| 070729 | ? | 0.98 | 10.6 | 2.7 | ||||||||
| 070809 | 0.473 | E | 3.07 | 11.4 | 0.9 | 11.7 | ||||||
| 071227 | 0.381 | L | 0.49 | 10.4 | 2.2 | 0.36 | 10.3 | 9.3 | 2.7 | 11.4 | ||
| 080123 | 0.495 | L | 0.31 | 10.1 | 1.7 | 0.03 | 9.7 | 8.7 | 1.8 | 11.1 | ||
| 090510 | 0.903 | L | 0.14 | 9.7 | 3.3 | 0.02 | 9.3 | 6.3 | 3.7 | 10.6 | ||
| 090515 | 0.403 | E | 4.35 | 11.2 | 0.1 | 11.5 | ||||||
| 100117 | 0.920 | E | 0.79 | 10.3 | 1.8 | 10.9 | ||||||
Note. — Stellar population parameters derived from the broad-band SEDs in Table 1 using the Maraston (2005) stellar population synthesis models (§3).
a Fit with a single stellar population age.
b Fit with a two-component young+old SSP model, with the old population fixed at an age of equivalent to the age of the universe at each host redshift, and a freely-varying young population with an age of .
c is fixed at the age of the universe at the appropriate redshift.
d The maximal mass is derived using the observed -band fluxes assuming a stellar population age equal to the age of the universe at the host redshift.
e A spectroscopic redshift is not known; these values are derived photometrically from the Maraston (2005) models.
f This model includes host extinction with mag; a model with no host extinction does not provide a satisfactory fit.
| SSP | |||||
|---|---|---|---|---|---|
| GRB | Age | Mass | |||
| (Gyr) | (M⊙) | (M⊙) | |||
| 970228 | 0.695 | 0.14 | 8.6 | 1.1 | 8.7 |
| 970508 | 0.835 | 0.07 | 8.5 | 0.4 | 8.8 |
| 980613 | 1.097 | 0.05 | 9.1 | 3.6 | 9.4 |
| 0.02 | 9.0 | 1.0 | |||
| 980703 | 0.966 | 0.05 | 9.3 | 1.0 | 10.8 |
| 990123 | 1.600 | 0.05 | 9.4 | 2.0 | 9.7 |
| 990712 | 0.433 | 0.11 | 9.1 | 1.1 | 9.3 |
| 991208 | 0.706 | 0.10 | 8.8 | 0.6 | 9.0 |
| 000210 | 0.846 | 0.12 | 9.3 | 0.7 | 9.5 |
| 000418 | 1.118 | 0.05 | 9.3 | 2.0 | 9.6 |
| 000911 | 1.058 | 0.06 | 8.9 | 0.2 | 9.6 |
| 010222 | 1.480 | 0.06 | 8.6 | 0.8 | 8.9 |
| 010921 | 0.451 | 0.22 | 9.6 | 0.4 | 9.6 |
| 011121 | 0.362 | 0.24 | 9.5 | 2.0 | 10.3 |
| 020813 | 1.255 | 0.09 | 9.4 | 1.3 | 9.6 |
| 020819b | 0.410 | 0.35 | 10.3 | 1.0 | 10.5 |
| 020903 | 0.251 | 0.01 | 7.8 | 0.9 | 9.1 |
| 030328 | 1.520 | 0.06 | 9.3 | 0.7 | 9.6 |
| 030329 | 0.168 | 0.01 | 6.8 | 1.1 | 8.0 |
| 030528 | 0.782 | 0.01 | 9.0 | 0.4 | 10.0 |
| 0.04 | 8.6 | 0.7 | |||
| 050826 | 0.296 | 0.50 | 9.9 | 2.0 | 11.0 |
| 060218 | 0.034 | 0.01 | 6.7 | 0.1 | 9.1 |
| 0.06 | 7.5 | 0.3 | |||
| 060505 | 0.089 | 0.23 | 9.4 | 2.4 | 9.7 |
| 0.01 | 8.3 | 0.9 | |||
| 060614 | 0.125 | 0.57 | 8.1 | 0.3 | 9.2 |
Note. — Stellar population parameters derived from the broad-band SEDs using the Maraston (2005) stellar population synthesis models (§3).
a Fit with a single stellar population age.
b The maximal mass is derived using the observed -band flux in conjunction with the maximal age allowed by the burst redshift.
c This model includes host extinction with mag.
d This model includes host extinction with mag.