A Novel Approach in Constraining Electron Spectra in Blazar Jets:
The Case of Markarian 421
Abstract
We report results from the observations of the well studied TeV blazar Mrk 421 with the Swift and the Suzaku satellites in December 2008. During the observation, Mrk 421 was found in a relatively low activity state, with the corresponding keV flux of erg s-1 cm-2. For the purpose of robust constraining the UV–to–X-ray emission continuum we selected only the data corresponding to truly simultaneous time intervals between Swift and Suzaku, allowing us to obtain a good-quality, broad-band spectrum despite a modest length ( ksec) exposure. We analyzed the spectrum with the parametric forward-fitting SYNCHROTRON model implemented in XSPEC assuming two different representations of the underlying electron energy distribution, both well motivated by the current particle acceleration models: a power-law distribution above the minimum energy with an exponential cutoff at the maximum energy , and a modified ultra-relativistic Maxwellian with an equilibrium energy . We found that the latter implies unlikely physical conditions within the blazar zone of Mrk 421. On the other hand, the exponentially moderated power-law electron distribution gives two possible sets of the model parameters: (i) flat spectrum with low minimum electron energy , and (ii) steep spectrum with high minimum electron energy . We discuss different interpretations of both possibilities in the context of a diffusive acceleration of electrons at relativistic, sub- or superluminal shocks. We also comment on how exactly the -ray data can be used to discriminate between the proposed different scenarios.
1 Introduction
Blazars constitute a sub-class of radio-loud, jet-dominated Active Galactic Nuclei (AGN) characterized by a broad-band non-thermal emission detected from radio to high energy -ray band, strong variability on time scales ranging from hours up to years, two distinct (low- and high-energy) spectral humps in the – representation, and also by a substantial polarization in the radio and optical photon energy ranges. The low-energy spectral component of blazar sources, peaking at IR–to–X-ray frequencies, is widely believed to be due to a Doppler-boosted synchrotron emission of ultra-relativistic electrons accelerated in the innermost parts of relativistic and oriented close to our line of sight jets containing magnetized plasma (Urry & Padovani, 1995). The high-energy spectral component of low-power blazars of the BL Lacertae type (hereafter BL Lacs) extends up to a few or even tens of TeV, and is most commonly considered as originating via inverse-Compton scattering by ultra-relativistic electrons of synchrotron photons produced by the same electrons (“synchrotron self-Compton process,” hereafter SSC). This -ray emission, which only recently can be studied in detail with the new generation of ground-based Imaging Atmospheric Cherenkov Telescopes (IACTs) and Fermi satellite, exhibits particularly dramatic variability, observed on the timescales as short as minutes (Aharonian et al., 2007; Albert et al., 2007). This indicates extremely efficient and rapid particle acceleration processes taking place in compact emission regions. Our understanding of such acceleration processes is, on the other hand, still insufficient, despite a significant theoretical progress made in this field during the last years.
Markarian 421 (Mrk 421; ), the first established extragalactic TeV source (Punch et al., 1992), is one of the most famous and nearby “high frequency peaked” BL Lacs. Since its discovery, it has been routinely observed by several IACTs at very high energy -rays and, more importantly, it has been targeted by many intensive multi-wavelength campaigns (which, in the past, were limited in their temporal and spectral coverage, and notably, often were triggered by a particularly high activity state of the source). These resulted in the discovery of a significant correlation between the hard X-ray and TeV fluxes, thus supporting the SSC origin of its high-energy emission (e.g. Inoue & Takahara, 1996; Takahashi et al., 1996; Fossati et al., 2008). In a framework of such an interpretation, the energy distribution of the radiating electrons is required to be of a broad, non-thermal form, and the power-law spectral shape is the most commonly invoked approximation for it. The main justification for this approximation is that the diffusive shock acceleration, the “1st-order Fermi process” — known to generate power-law spectra of ultra-relativistic particles — is likely to play a major role in accelerating jet electrons (e.g. Mastichiadis & Kirk, 1997; Takahashi et al., 2000; Spada et al., 2001). Still, as pointed out by several authors, alternative forms of the electron energy distribution in blazar jets, namely “ultra-relativistic Maxwellian” expected to be produced in the case of the efficient turbulent (“2nd-order Fermi”) acceleration, may also account for bulk of the observational findings (e.g. Saugé & Henri, 2004; Katarzyński et al., 2006b; Giebels et al., 2007; Ushio et al., 2009). In order to determine which acceleration process is likely to be dominant, it is necessary to reconstruct the underlying electron spectrum from the observed emission spectra. The X-ray observations are crucial in this respect.
The Suzaku X-ray observatory (Mitsuda et al., 2007) has the capability of high quality observations of astrophysical objects from up to keV, owing to the excellent sensitivity of its Hard X-ray Detector (HXD; Takahashi et al., 2007). As such, it is the most suitable instrument for analyzing the synchrotron continua of high-energy peaked BL Lacs. Recently, Ushio et al. (2009) demonstrated the excellent quality of the Suzaku data by constructing high-photon-statistics time-resolved keV spectra of Mrk 421 for exposure times as short as a few ksec. These were analyzed by the parametric forward-fitting SYNCHROTRON model (rather than being fitted by some assumed spectral shape of the synchrotron continuum), to investigate more directly the electron energy distribution. Here, we proceed further in this direction, by fitting the broad-band spectrum of Mrk 421 with different forms of the electron distribution discussed in the literature. In addition to the new Suzaku data (collected during December 2008), however, we also utilize the simultaneous observations by the Swift satellite (Gehrels et al., 2004), and in particular the Ultra-Violet/Optical Telescope (UVOT; Roming et al., 2005) onboard Swift. § 2 reports in more detail on the analyzed datasets. In § 3, we present the results of the applied spectral analysis. The implications of our results towards the understanding of blazar sources are discussed and summarized in § 4 and § 5. Throughout this analysis, we use the XSPEC version 12.5.0ac and the CALDB of version 2009.04.03.
2 Observations and Data Reduction
2.1 Suzaku
Suzaku observations were performed with the X-ray Imaging Spectrometer (XIS; Koyama et al., 2007) in the keV band, and also with the Hard X-ray Detector (HXD; Takahashi et al., 2007; Kokubun et al., 2007) in the keV band. The XIS cameras, located at the foci of the X-ray telescopes (XRTs; Serlemitsos et al., 2007), include one back-illuminated CCD camera (BI) and two front-illuminated CCD cameras (FIs). The HXD is a non-imaging detector system which consists of silicon PIN diodes capable of observing in the keV band and the GSO crystal scintillators in the keV band. In the following analysis, we do not use the GSO data, because Mrk 421 was not sufficiently bright above keV during the performed observations to be significantly detected by the GSO.
We observed Mrk 421 with Suzaku for almost three days from MJD 54803.76 to MJD 54805.89 (seqnum=703020010). All of the XISs are operated with 1/4 window option in order to reduce possible pile-up effects. Both XIS and HXD data are reprocessed from “uncleaned event files” with the CALDB of 2009-04-07 which corresponds to rev2.2 of the official pipeline process. The “unscreened event files” of XISs are reduced with the standard selection criteria requiring, in addition, the rigidity larger than GV/. The XIS events are next extracted from a circular region with a radius of centered on the image peak. The background region is extracted from the source free region having a similar area. Moreover, we extract the image center of BI sensor with a radius of because it weakly suffers from pile-up judging from its count rate. In our spectral fitting, we derive the response matrices (RMF) and the effective area files for the XRTs (ARF) for each XIS sensor by using xisrmfgen and xissimarfgen, respectively (Ishisaki et al., 2007). Since the two FI CCDs have almost identical performance, we co-add their data and the corresponding RMF and ARF. For the HXD data, we exclude events during South Atlantic Anomaly (SAA) passages, Earth occultation and those with cutoff rigidity less than GV/c.
2.2 Swift
The three-day-long Suzaku observation of Mrk 421 is well complemented by two Swift observations, involving nine short exposures ( s each; seqnum=00030352102 and 00030352103). The Swift satellite carries three sets of instruments: the Burst Alert Telescope (BAT; keV; Gehrels et al., 2004), the X-ray Telescope (XRT; keV; Burrows et al., 2005), and the Ultra-Violet/Optical Telescope (UVOT; nm; Roming et al., 2005). Hereafter, we only analyze the XRT and the UVOT data. All the data are taken from the NASA/Swift database (http://heasarc.gsfc.nasa.gov/FTP/swift/) and are processed at the Swift Data Center.
The Swift XRT data were all taken in the Windowed Timing mode, with the central arcmin field of view covered, and one dimensional imaging preserved. Therefore, we extract the rectangular region of arcsec2 centered on the peak position of the source. The background is selected in the source free region with rectangular shape. Photons with grade are selected and rebinned so that each bin has sufficient photon statistics. The auxiliary response file is created by the task xrtmkarf and the standard response file swxwt0to2s6_20070901v011.rmf. For UVOT observations, we utilize the three ultraviolet filters in the imaging mode, with the effective central wavelength of nm, nm and nm for UVW1, UVM2 and UVW2 filters, respectively. The source aperture sizes are all chosen to correspond to those used to determined the UVOT zero points, namely for the ultraviolet filters. A background region is extracted from the “ghost wing” of nearby bright source 51 UMa. A comparison of results using several different background regions suggests that the corresponding uncertainty is at most mag (Poole et al., 2008), which is smaller than the systematic uncertainty indicated by the UVOT team. Next, we calculate the photometric spectra so that they can be fitted in XSPEC by the task uvot2pha (v1.5) using the response matrices swu[w1,m2,w2]_20041120v104.rsp. Note that the columns “E_MIN” and “E_MAX” of these response are manually set to the FWHM of the filter in order to improve their appearance.
3 Analysis
3.1 The SYNCHROTRON Model
The broad bandpass and high-sensitivity of the Suzaku satellite enables spectral fits for the observed X-ray emission of celestial sources with synchrotron spectra originating from a given (assumed) shape of the electron energy distribution (EED), rather than by the assumed spectral form of the non-thermal emission continuum (Tanaka et al., 2008; Ushio et al., 2009). We note that in the past the analogous “parametric forward-fitting” technique has been applied in analyzing X-ray emission of solar flares, believed to be produced by bremsstrahlung of non-thermal electrons within the magnetic loops above the solar surface (see Park et al., 1997; Petrosian & Chen, 2010, and references therein). In this paper, we continue the studies of the X-ray emission of Mrk 421 initiated in Ushio et al. (2009), including the ultraviolet observations by UVOT onboard Swift satellite in addition to the analyzed Suzaku dataset. Below we briefly describe the SYNCHROTRON model serving this function, as implemented in XSPEC.
In our SYNCHROTRON model, we assume two different forms for the EED, both well motivated by the particle acceleration models discussed in the literature (see next section), namely a power-law (PL) form above the minimum energy with an exponential cutoff at the maximum energy , and a modified ultra-relativistic Maxwellian (UM) with the equilibrium energy :
| (1) |
where is the electron Lorentz factor, is the normalization of the EED, is the electron energy index, and represents the modulation of the exponential cut-off. Here and below the primes denote the quantities measured in the emitting plasma rest frame, except of electron Lorentz factor , which is always measured in the this frame. The considered model PL is thus characterized by three free parameters (, , and ), while the model UM by two free parameters only ( and ; since with the extremely flat low-energy spectrum the exact location of does not affect the modeled synchrotron continuum). For these, we consider the following “expected” ranges: , , , , and . We note that this is the first time when the two aforementioned representations of the EED are tested against a single, broad-band dataset.
Having specified the form of the EED with the assumed isotropic pitch-angle distribution, the jet comoving synchrotron emissivity is described by:
| (2) |
where the function is defined as
| (3) |
and where is the modified Bessel function of the order, the characteristic synchrotron photon energy is
| (4) |
and is the jet magnetic field intensity. In the case of a relativistic bulk motion of the emitting plasma, the observed energy of the synchrotron photon is , and the spectral emissivity transforms as , where is the corresponding Doppler factor111These transformations, together with the transformation of the emitting volume as appropriate for a homogeneous moving source assumed here, give the energy flux transformation , since .. In the following analysis we adopt the product of (where is expressed in units of Gauss) for the blazar emission zone in Mrk 421, which is the value claimed previously for this source by Takahashi et al. (2000) based on detailed variability and spectral studies, when the object showed a similar flux to that measured by us. The validity of adopting (and an investigation of a range for values adopted for this parameter) is discussed later. Hence, the observed synchrotron flux at a given observed photon energy in our model depends solely on the parameters of the EED.
3.2 Spectral Fitting
Our observations took place during a relatively low activity state of Mrk 421, characterized by only a mild variability: the observed keV flux varied between and erg s-1 cm -2 during the 3-day long Suzaku observations. In order to construct a truly simultaneous broad-band spectrum ranging from UV to hard X-ray frequencies, we have extracted the available data taken only during the overlapping time intervals for XRT, XIS and HXD/PIN instruments; this resulted in ksec of the final net exposure. Nevertheless, even with such a short exposure, we were still able to obtain a very good quality broad-band X-ray spectrum of Mrk 421 extending from up to keV. The averaged X-ray spectrum constructed by accumulating all of the detected photons instead would not be significantly different than this truly simultaneous spectrum because, as noted above, Mrk 421 was relatively steady during the observations, and no significant spectral changes have been noted in the total accumulated Suzaku dataset. The conventional fit to the X-ray spectrum with a single power-law function modified solely by the Galactic absorption describes the data poorly ( with 56 dof), and indicates a significant curvature of the X-ray spectrum. A broken power-law function provides a better representation of the data ( with 54 dof), returning the low- and high-energy photon indices of and , respectively, with the break photon energy of keV. The corresponding keV energy flux of Mrk 421 is then erg s-1 cm-2, again, similar to that reported by Takahashi et al. (2000).
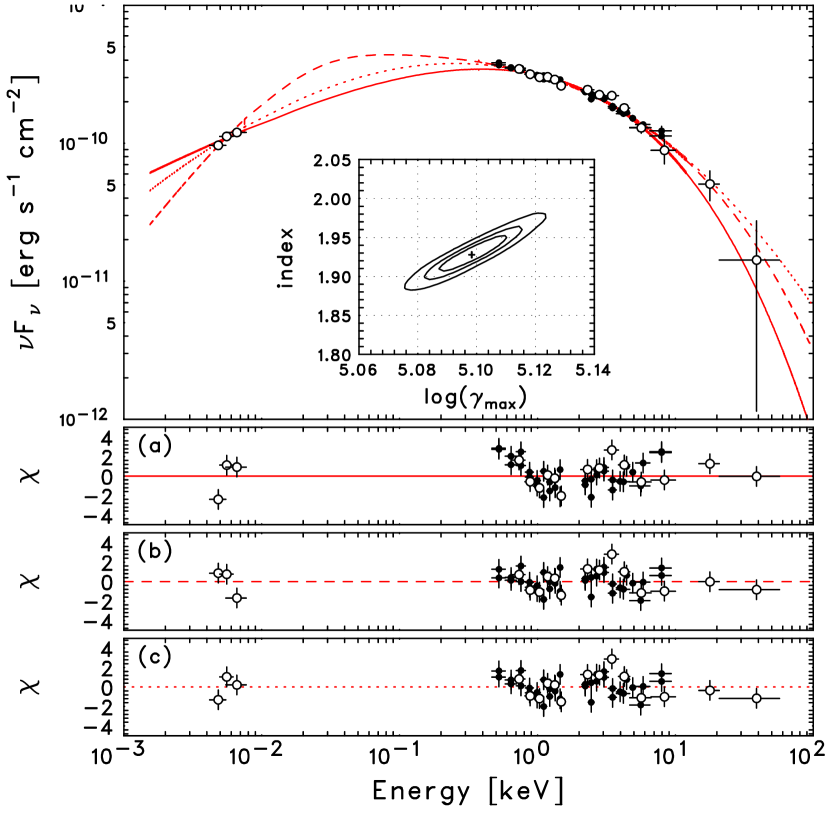
The constructed dataset is then analyzed using the SYNCHROTRON model. The top panel of Figure 1 presents the UV–to–X-ray spectral energy distribution of Mrk 421 fitted with three different representations of the EED as described below, while the bottom panels show the residuals between the data and the models. The spectral fitting is performed jointly in the UVOT band and the keV band; here, we ignore the data within the keV and the keV photon energy ranges, because of the systematic calibration uncertainties (Serlemitsos et al., 2007; Fukazawa et al., 2009). The extinction and the absorption of the UV/X-ray photons in our Galaxy is taken into account by means of multiplicative constants based on the analysis by Pei (1992, see Table 1). Such a procedure was applied previously in the analysis of the spectra of Gamma-Ray Bursts (e.g. Schady et al., 2007). An alternative analysis of the UV data following the procedure presented in Kataoka et al. (2008) returns the fluxes consistent within a few percent with the ones obtained by our method.
In the first representation of the fitted EED — denoted below as the case “a” — we consider the power-law (PL) model with fixed minimum electron Lorentz factor . The results of the model fitting are summarized in Table 1 and shown in Figure 1. The emerging parameters are and , with the quality of the fit (for dof). The inset in Figure 1 shows that these two parameters ( and ) are weakly correlated with each other in a sense that the harder the electron distribution gets, the lower maximum energy of electrons is required to fit the data. However, the remaining residuals around keV indicate that the case “a” may not be the best representation of the data. We emphasize again that here we probe directly the parameters of the EED, unlike the previous studies in which the observational data were fitted by some assumed parametric form of the emission continuum (either a power-law, a broken power-law, or a log-parabolic form; see e.g., Tramacere et al., 2009). In addition, the EED parameters are determined robustly, because the UV data are taken into account in addition to the X-ray data. Without truly simultaneous UV data, the model fits would have a larger degeneracy.
In the second representation of the fitted EED (hereafter case “b”) we set free all the three parameters of the power-law model PL. The resulting values are then , and with (for dof). The quality of the fit is now significantly improved, as shown in Figure 1. Finally, in the third representation of EED denoted as the case “c”, we consider the modified ultra-relativistic Maxwellian form (model UM). In this case, which represents the data well ( with dof; see again Table 1 and Figure 1), the model parameters are and .
| model | case | model parameters | keV flux | (dof) | ||
|---|---|---|---|---|---|---|
| or | [erg cm-2 s-1] | |||||
| PL | “a” | (fixed) | 1.86 (54) | |||
| PL | “b” | 1.12 (53) | ||||
| UM | “c” | (fixed) | 1.20 (54) |
3.3 Related Uncertainties
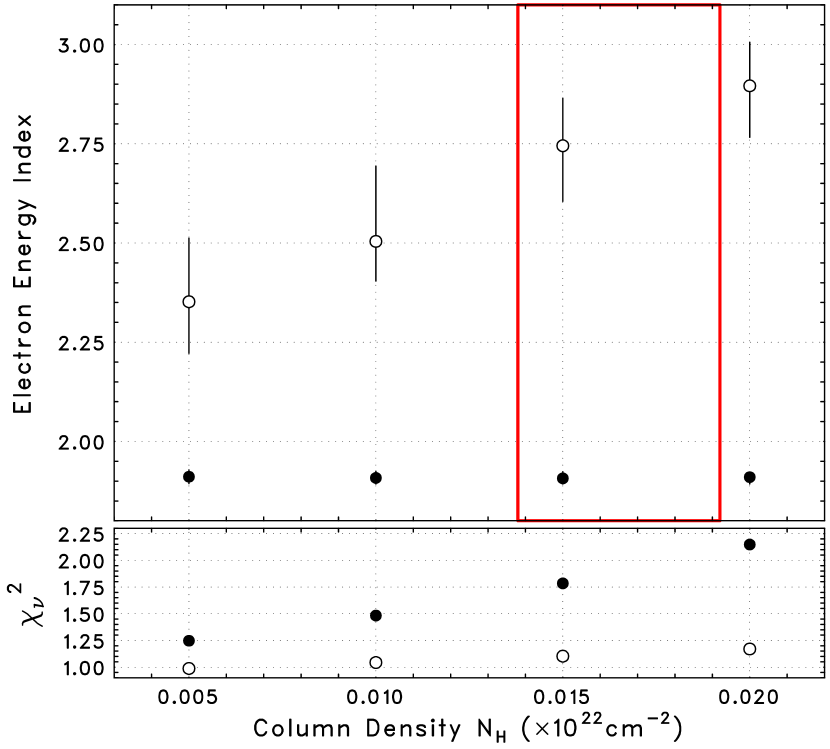
The model parameters emerging from the analysis described above may depend to some level on the assumed value of the Galactic column density in the direction of Mrk 421, which affects the low energy X-ray data. Therefore, it is necessary to investigate how robust are the presented model fits by varying within the allowed range and repeating the analysis. In the case of the PL models (cases “a” and “b”), Figure 2 shows the resulting dependence of the electron energy index on the level of the Galactic absorption, with the extinction parameter E(B–V) varied accordingly (assuming linear scaling with ). In the figure, the red box indicates the allowed range for estimated from the historical HI observations (Dickey & Lockman, 1990; Lockman & Savage, 1995; Kalberla et al., 2005). As is shown there, in the case “a” (filled circles in the plot) the slope of the EED is almost independent on the particular value of the absorption/extinction coefficients, but the acceptance of the fit gets significantly worse as becomes larger. This behavior is easy to understand, since with the fixed minimum electron energy the remaining two parameters of the power-law model are determined by the broad-band UV–to–X-ray emission continuum, almost irrespectively on the low-energy segment of the X-ray dataset ( keV) which might be most affected by increased and which, as such, determines only the quality of the fit. The same is true for the UM model (case “c”, not included in Figure 2); namely, changes in the hydrogen column density (and, correspondingly, the extinction level) do not change significantly the emerging parameters of this model, but only affect the quality of the fit. We note that with the assumed linear scaling of E(B-V) with the fluxes in the UVOT band vary much less substantially (i.e., within 10%) than the soft X-ray flux.
On the other hand, in the case of the PL model with all three parameters set free (case “b”, open circles in Figure 2), the emerging electron energy index correlates with , while the quality of the fit remains very good. As a result, within the allowed range of the Galactic absorption the electron index in the case “c” reads roughly as (compare it with Table 1). Again, the observed dependence is not difficult to understand. This is because in the case “b” the minimum electron Lorentz factor is so large that the observed synchrotron emission in the UV frequency range is produced almost entirely by the lowest-energy electrons. In particular, with the assumed the observed characteristic frequency of the synchrotron photons emitted by the electrons with is eV. In other words, the slope of the electron energy energy distribution in the case “b” is determined not predominantly by the broad-band UV–to–X-ray emission, as in the cases “a” and “c”, but solely by the X-ray continuum. As such, the parameter in the case “b” is sensitive to the low-energy X-ray photons, and therefore to the particular value of .
Another concern arises from the fact that in our analysis the product of the magnetic field intensity and the jet Doppler factor has been fixed at the particular value . There have been numerous efforts to determine uniquely the physical parameters of blazar emission region in TeV-detected BL Lacs, including and , in addition to the aforementioned work by Takahashi et al. (2000). For example, Tavecchio et al. (1998), who attempted to utilize the multi-wavelength data self-consistently, claimed and G for the flaring state of Mrk 421 (see Takahashi et al., 1996). This would lead to . Similarly, Albert et al. (2007) obtained G and , resulting in . Although those values are slightly different from the one assumed in the our paper, they are of the same order of magnitude. In order to investigate in detail how the related uncertainty regarding the product affects the presented results, we repeated the analysis for , 5, and 10. We found that within the range , the resulting curvature of the EED (parameters or ) does not significantly change when compared to , but only that the critical electron energies (, and ) scale as , as expected (see equation 4). Therefore, we can safely conclude that the uncertainty regarding does not affect significantly the model results.
4 Discussion: Insights into the Energy Distribution of Radiating Particles
In the previous sections we showed that the UV–to–X-ray synchrotron continuum of Mrk 421 observed in December 2008 may be fitted almost equally well by three different representations of the EED, each well motivated on theoretical grounds, yet each implying different physical conditions and different particle acceleration processes operating within the blazar emission zone of Mrk 421. Here we discuss in this context and in more detail the results obtained by us. In the following, we assume that the inferred shapes of the EED may be identified with the steady-state spectra formed within a homogeneous acceleration/emission region. It is not clear (or it is even questionable), however, whether this particular assumption — even though being widely applied in blazar modeling — is a good approximation of a realistic situation, and we comment on this issue in § 4.4 below.
4.1 Ultra-relativistic Maxwellian
We begin with the case “c” analyzed above, namely with the ultra-relativistic Maxwellian representation of the energy distribution of the radiating electrons. In general, it was shown previously by various authors that the Maxwellian spectra are expected to form in the case of an efficient continuous acceleration of relativistic particles undergoing radiative (synchrotron-type) losses obeying and a very inefficient escape from the acceleration/emission region (Schlickeiser, 1984; Aharonian et al., 1986; Park & Petrosian, 1995). In particular, turbulent (“2nd-order”, or “stochastic”) acceleration of the Fermi-type — characterized by the acceleration timescale independent on the particle energy, — was the most commonly considered example of the continuous energization of ultra-relativistic particles, with the equilibrium energy defined via the condition . This has been generalized by Stawarz & Petrosian (2008), who showed that for the power-law scalings and , the steady-state solution to the appropriate equation governing energy evolution of the radiating particles (assuming, again, very inefficient particle escape from the system) is of the modified ultra-relativistic Maxwellian form , where .
Our analysis indicates that in order to fit the UV–to–X-ray spectrum of Mrk 421 with the modified Maxwellian form of the EED, the equilibrium energy has to be very small, , and the spectral curvature has to be very smooth, . Even though it is formally possible to relate these requirement to a set of particular physical conditions within the emission zone of Mrk 421, the derived parameters appear unrealistic. For example, anticipating the dominant inverse-Compton cooling to take place in the Klein-Nishina (KN) regime, i.e. , one would have to assume in order to obtain . This requirement, interestingly, would then be consistent with the stochastic acceleration of the radiating particles by the turbulence characterized by the energy spectrum similar to the Kreichnan one222For the energy spectrum of the turbulence , where is the wavevector of the turbulent modes, stochastic acceleration timescale reads as . Hence, for the Kreichnan spectrum one obtains (see Stawarz & Petrosian, 2008, and references therein).. However, the anticipation that relatively low-energy electrons within the blazar emission zone of Mrk 421 cool predominantly via the inverse-Compton emission in the KN regime rather than via synchrotron emission is highly questionable. For the case where the synchrotron emission dominates (), on the other hand, no commonly acceptable value of can be found to satisfy . Hence, we consider the case of the UV–to–X-ray spectrum of Mrk 421 fitted by the modified Maxwellian form of EED as only a formal possibility only, involving somehow unphysical (or, at least, “non-standard”) conditions.
4.2 Shock-originated Power-law
Next we discuss the power-law models for the EED, focusing first on the case “b”. In this case, the energy spectrum of radiating electrons is characterized by a steep slope within a very (uncomfortably?) narrow energy range (preceded by a sharp low-energy cut-off or eventually a very hard low-energy tail). At the first glance, such a representation of the EED may seem as artificial as the one discussed in the previous section, but we note here that it is in fact very similar to that invoked by Katarzyński et al. (2006a) for the case of a distant () BL Lac object 1ES 1101-232 surprisingly detected at TeV energies, where the absorption of its TeV emission due to pair production on the extragalactic diffuse background light was expected to provide large opacity at TeV energies (see also in this context Tavecchio et al., 2009, for the case of BL Lac 1ES 0229+200). In addition, the high minimum electron energy and the steep electron spectral index (significantly different from the “canonical shock spectrum” ) might in principle be both reconciled with the diffusive (“1st-order-Fermi”) acceleration of the radiating electrons at a relativistic, perpendicular333“Perpendicular/oblique” shocks are those with magnetic field lines oriented at right/large angles to the shock normal. Furthermore, if the projection of the upstream fluid velocity on the upstream magnetic field direction is smaller/larger than the light speed, the respective shocks are called “subluminal/superluminal”., and proton-mediated shock. That is because under such conditions the inertia of protons carrying bulk of the jet energy (and thus shaping the shock structure) define the critical electron energy (where is the bulk Lorentz factor of the shock in the upstream rest frame), below which no 1st-order-Fermi acceleration is in principle allowed (Begelman & Kirk, 1990; Hoshino et al., 1992). It is thus interesting that the minimum electron energy obtained in the case “b” is in agreement with the expected value of , but only in the case of ultrarelativistic shock velocity, . In addition, the steep power-law slope of the electrons with energies higher than is in agreement with those claimed for the diffusive acceleration at superluminal shocks (Niemiec & Ostrowski, 2004; Sironi & Spitkovsky, 2009), assuring self-consistency of the interpretation.
Even though similar arguments as above (based on the spectral forms of the EED derived from the broad-band modeling) were given previously in favor of a dominant role of perpendicular, proton-mediated shocks in AGN jets (e.g., Stawarz et al., 2007; Sikora et al., 2009), the concern regarding the presented interpretation of the dataset analyzed in this paper is that large obtained in the case “b” may be an artifact of the analysis forcing the broad-band UV–to–X-ray data to be fitted by an EED of single power-law form. Indeed, as already noted in § 3.3, with the assumed the observed characteristic frequency of the synchrotron photons emitted by the electrons with is eV, i.e. just above the UV frequency range. Thus, the obtained value for the minimum electron Lorentz factor in the case “b” may not reveal the nature of particle acceleration within the blazar emission zone of Mrk 421, but only the fact that the analyzed UV and X-ray data cannot be fitted together by a single power-law form of the EED.
Besides the aforementioned caveat, the particular form of the EED discussed here would require a lot of fine tuning to ensure within the emission region, or in other words to prevent formation of a low-energy tail in the electron distribution (energies ) due to the radiative cooling of ultrarelativistic particles injected from the shock to the emission site. Note in this context that with a postulated efficient re-acceleration processes taking place downstream of the shock, which could potentially remove the cooling problem, one should not expect the radiating electrons to maintain their injection spectrum, but rather to form a continuum resembling modified Maxwellian discussed in § 4.1. Yet the possibility for preserving the “shock-like” EED with high far from the injection site cannot be rejected robustly. Clearly, such a controversy could in principle be resolved with the simultaneous Fermi observations, because the position of is the major factor determining the slope of the -ray continuum within the MeV–GeV photon energy range. In other words, Fermi/LAT data, if simultaneous with the UV–to–X-ray data analyzed with the SYNCHROTRON model, could help to discriminate between the case “b” and other analyzed cases, i.e. between the high or low minimum electron Lorentz factor.
4.3 Flat Power-law as a Cooled Maxwellian?
Finally, we consider the power-law model, case “a”, in which the minimum electron Lorentz factor is fixed at , and the emerging power-law slope of the EED is . We note that because only the UV–to–X-ray data are fitted in our analysis, any other fixed value for within the range would not affect the determination of the parameter , since the observed characteristic frequency of the electrons with Lorentz factors is expected to be located below the UVOT frequency range (with the assumed ). Thus the physical case to discuss is a flat () electron power-law between the energies and . There may be two interpretation for such. One is the diffusive shock acceleration at a (mildly) relativistic subluminal shock (without necessarily significant proton content); such a configuration results in a very flat particle spectra (; Kirk & Heavens, 1989; Ostrowski, 1991; Bednarz & Ostrowski, 1996). In a framework of this interpretation, the entire observed synchrotron continuum of Mrk 421 would then be produced in a slow-cooling regime.
The other possible physical interpretation for the case “a” discussed in this paper may be a radiatively re-processed (cooled) Maxwellian electron distribution. As is well known, with a steep () power-law EED continuously injected into the emission region, synchrotron-type radiative cooling () results in further steepening of the injected spectrum (by ) above some critical (break) energy. On the other hand, in the case of a very flat, high-energy EED injected to the emission region, radiative cooling leads to formation of a low-energy power-law tail instead. For example, a radiatively re-processed ultra relativistic Maxwellian would give a familiar form of the EED. Moreover, as pointed out by Giebels et al. (2007), additional non-negligible inverse-Compton/KN losses may significantly flatten such a power-law tail, leading to a formation of cooled power-law spectra with . We believe that this mechanism is a viable option for the interpretation of the synchrotron emission of Mrk 421. And indeed, Giebels et al. (2007) applied the discussed scenario in the particular context of Mrk 421, showing that a single power-law with — formed as a cooled Maxwellian — may account for the broad-band emission of this blazar observed in March 2001. The value of the electron slope claimed by Giebels et al. (2007) is lower than the one found in our analysis but, interestingly, the average keV flux of Mrk 421 in March 2001 ( erg cm-2 s-1), was about 5 times higher than during the exposure analyzed here. Such a behavior may be reconciled with the interpretation above if one assumes increasingly pronounced KN effects in cooling of the radiating electrons as the synchrotron flux increases.
The above interpretation requires however a strong cooling regime for all the electrons down to energies of . This, in turn, would imply relatively large emission region size : by simply equating the dynamical timescale with the cooling (predominantly synchrotron by assumption) timescale , one may find very roughly
| (5) |
Since the corresponding variability timescale would then be of the order of days–weeks (for , G, and the jet Doppler factor ), any intraday flux variations could be hardly accounted by the discussed model.
The interesting scenario outlined above can be easily and directly tested with the simultaneous UV, X-ray, and -ray data (obtained with the Fermi satellite and modern IACTs). That is because such a broad-band dataset would allow one to determine the ratio of the synchrotron and inverse-Compton cooling rates (or, more precisely, the relative contribution of the inverse-Compton/KN cooling), together with the parameters of the underlying EED using the SYNCHROTRON model. Note in this context that in the first interpretation of the case “a” — the one involving shock acceleration — no obvious correlation between the cooling rates ratio and the electron spectral index is expected, while in the second interpretation — the one involving radiatively re-processed Maxwellian component — a clear correlation between these two quantities is implied. We want to point out that there exists Fermi and MAGIC data during the 3-day long Suzaku observations. The analysis of these data set, as well as the physical interpretation of the overall SED in the context of the above presented model will be reported on a forthcoming publication.
4.4 Steady Component?
In the discussion above we have assumed that all the possible representations of the EED emerging from the analysis correspond to the steady-state spectra formed within a homogeneous acceleration/emission region of Mrk 421 jet. As already emphasized, this assumption may not be correct. And indeed, if the blazar emission zone is highly inhomogeneous, then the inferred electron spectra could instead be due to a superposition of multiple distributions formed within different sub-volumes of a system. In particular, the Maxwellian form discussed above — with the “problematic” parameter — may reflect some complex superposition of different Maxwellians with “physically acceptable” curvatures or, alternatively, some multiply-broken power-law electron continuum. As such, it may well correspond to the steady emission component claimed for Mrk 421 by Ushio et al. (2009, see section 5 therein). Interestingly, the X-ray flux of this component and its spectral curvature (which we determined for the purpose of this paper by fitting the UM form with the SYNCHROTRON model to the dataset analyzed in Ushio et al., 2009) are both quite similar to those discussed here.
5 Conclusions
In this paper we have investigated which form of the electron energy distribution describes the best the UV–to–X-ray spectrum of Mrk 421 in its relatively low state (December 2008; the observed keV flux erg cm-2 s-1). In our studies we have applied the forward-fitting SYNCHROTRON model implemented in XSPEC (Ushio et al., 2009); that is, the analyzed dataset has been fitted directly with a synchrotron emission originating from a given (assumed) shape of the electron distribution, rather than by an assumed parametric form of the non-thermal emission continuum as typically presented in the literature. We have considered two different general representations of the electron spectrum, both motivated by the particle acceleration models discussed in the literature, namely a power-law form within some finite energy range modulated by an exponential cutoff at the maximum energy, and a modified ultra-relativistic Maxwellian. We have found that the latter one, which would correspond to the continuous (turbulent) acceleration of the radiating particles within the emission region with no particle escape, even though formally allowed (i.e. giving a reasonable fit to the data), implies rather artificial, and thus unlikely physical conditions within the blazar zone of Mrk 421. On the other hand, a power-law representation of the electron energy spectrum fits the data equally well. In this case, two possible sets of the model parameters have been found: (i) a flat-spectrum one with low electron minimum energy , and (ii) a steep-spectrum one with high electron minimum energy . We have discussed different interpretations for both, involving diffusive acceleration of the radiating electrons at relativistic, sub- or superluminal shocks, as well as radiatively re-processed electron distribution of the initial (injected) Maxwellian form.
The presented technique in analyzing broad-band data of blazar sources constitutes a very promising method for investigating particle acceleration processes operating in relativistic plasma. In the particular case of the BL Lac object Mrk 421, it already allowed us to limit the number of possible scenarios to be considered in this context. Still, several different options remain, which could be investigated in detail using the SYNCHROTRON model with new broad-band, good-quality UV–to–X-ray data covering long time intervals and different activity states in this and other similar sources. In this paper we focused on the simultaneous UV to X-ray Mrk 421 data from Swift and Suzaku observations in December 2008, and we argued that gamma-ray data simultaneous to the UV-X-ray data would add further constrains to the various possible model/physical interpretations. We want to point out that there exists Fermi/MAGIC observations contemporaneous to the Swift/Suzaku observations during December 2008. The analysis of this data set, as well as the physical interpretation of the overall SED in the context of the above presented model will be reported on a forthcoming publication.
References
- Aharonian et al. (2007) Aharonian, F., et al. 2007, ApJ, 664, L71
- Aharonian et al. (1986) Aharonian, F. A., Atoyan, A. M., & Nakhapetian, A. 1986, A&A, 162, L1
- Albert et al. (2007) Albert, J., et al. 2007, ApJ, 663, 125
- Albert et al. (2007) Albert, J., et al. 2007, ApJ, 669, 862
- Bednarz & Ostrowski (1996) Bednarz, J., & Ostrowski, M. 1996, MNRAS, 283, 447
- Begelman & Kirk (1990) Begelman, M. C., & Kirk, J. G. 1990, ApJ, 353, 66
- Burrows et al. (2005) Burrows, D. N., et al. 2005, Space Science Reviews, 120, 165
- Dickey & Lockman (1990) Dickey, J. M., & Lockman, F. J. 1990, ARA&A, 28, 215
- Gehrels et al. (2004) Gehrels, N., et al. 2004, ApJ, 611, 1005
- Giebels et al. (2007) Giebels, B., Dubus, G., & Khélifi, B. 2007, A&A, 462, 29
- Inoue & Takahara (1996) Inoue, S., & Takahara, F. 1996, ApJ, 463, 555
- Ishisaki et al. (2007) Ishisaki, Y., et al. 2007, PASJ, 59, S113
- Fossati et al. (2008) Fossati, G., et al. 2008, ApJ, 677, 906
- Fukazawa et al. (2009) Fukazawa, Y., et al. 2009, PASJ, 61, 17
- Hoshino et al. (1992) Hoshino, M., Arons, J., Gallant, Y. A., & Langdon, A. B. 1992, ApJ, 390, 454
- Kalberla et al. (2005) Kalberla, P. M. W., et al. 2005, A&A, 440, 775
- Katarzyński et al. (2006a) Katarzyński, K., et al. 2006a, MNRAS, 368, L52
- Katarzyński et al. (2006b) Katarzyński, K., et al. 2006b, A&A, 453, 47
- Kataoka et al. (2008) Kataoka, J., et al. 2008, ApJ, 672, 787
- Kirk & Heavens (1989) Kirk, J. G., & Heavens, A. F. 1989, MNRAS, 239, 995
- Kokubun et al. (2007) Kokubun, M., et al. 2007, PASJ, 59, S53
- Koyama et al. (2007) Koyama, K., et al. 2007, PASJ, 59, 23
- Lockman & Savage (1995) Lockman, F. J., & Savage, B. D. 1995, ApJS, 97, 1
- Mastichiadis & Kirk (1997) Mastichiadis, A., & Kirk, J. G. 1997, A&A, 320, 19
- Mitsuda et al. (2007) Mitsuda, K., et al. 2007, PASJ, 59, S1
- Niemiec & Ostrowski (2004) Niemiec, J., & Ostrowski, M. 2004, ApJ, 610, 851
- Ostrowski (1991) Ostrowski, M. 1991, MNRAS, 249, 551
- Park & Petrosian (1995) Park, B. T., & Petrosian, V. 1995, ApJ, 446, 699
- Park et al. (1997) Park, B. T., Petrosian, V., & Schwartz, R. A. 1997, ApJ, 489, 358
- Pei (1992) Pei, Y. C. 1992, ApJ, 395, 130
- Petrosian & Chen (2010) Petrosian, V., & Chen, Q. 2010, arXiv:1002.2673
- Poole et al. (2008) Poole, T. S., et al. 2008, MNRAS, 383, 627
- Punch et al. (1992) Punch, M., et al. 1992, Nature, 358, 477
- Roming et al. (2005) Roming, P. W. A., et al. 2005, Space Science Reviews, 120, 95
- Saugé & Henri (2004) Saugé, L., & Henri, G. 2004, ApJ, 616, 136
- Schady et al. (2007) Schady, P., et al. 2007, MNRAS, 377, 273
- Schlegel et al. (1998) Schlegel, D. J., Finkbeiner, D. P., & Davis, M. 1998, ApJ, 500, 525
- Schlickeiser (1984) Schlickeiser, R. 1984, A&A, 136, 227
- Serlemitsos et al. (2007) Serlemitsos, P.J., et al. 2007, PASJ, 59, S9
- Sikora et al. (2009) Sikora, M., Stawarz, Ł., Moderski, R., Nalewajko, K., & Madejski, G. M. 2009, ApJ, 704, 38
- Sironi & Spitkovsky (2009) Sironi, L., & Spitkovsky, A. 2009, ApJ, 698, 1523
- Spada et al. (2001) Spada, M., Ghisellini, G., Lazzati, D., & Celotti, A. 2001, MNRAS, 325, 1559
- Stawarz & Petrosian (2008) Stawarz, Ł., & Petrosian, V. 2008, ApJ, 681, 1725
- Stawarz et al. (2007) Stawarz, Ł., Cheung, C. C., Harris, D. E., & Ostrowski, M. 2007, ApJ, 662, 213
- Takahashi et al. (1996) Takahashi, T., et al. 1996, ApJ, 470, L89
- Takahashi et al. (2000) Takahashi, T., et al. 2000, ApJ, 542, L105
- Takahashi et al. (2007) Takahashi, T., et al. 2007, PASJ, 59, S35
- Tanaka et al. (2008) Tanaka, T., et al. 2008, ApJ, 685, 988
- Tavecchio et al. (1998) Tavecchio, F., Maraschi, L., & Ghisellini, G. 1998, ApJ, 509, 608
- Tavecchio et al. (2009) Tavecchio, F., Ghisellini, G., Ghirlanda, G., Costamante, L., & Franceschini, A. 2009, MNRAS, 399, L59
- Tramacere et al. (2009) Tramacere, A., Giommi, P., Perri, M., Verrecchia, F., & Tosti, G. 2009, A&A, 501, 879
- Urry & Padovani (1995) Urry, C. M. & Padovani, P. 1995, PASP, 107, 803
- Ushio et al. (2009) Ushio, M., et al. 2009, ApJ, 699, 1964