]www.luxrerum.org
Optical amplification enhancement in photonic crystals
Abstract
Improving and controlling the efficiency of a gain medium is one of the most challenging problems of laser research. By measuring the gain length in an opal based photonic crystal doped with laser dye, we demonstrate that optical amplification is more than twenty-fold enhanced along the -K symmetry directions of the face centered cubic photonic crystal. These results are theoretically explained by directional variations of the density of states, providing a quantitative connection between density of the states and light amplification.
pacs:
42.55.Tv, 42.70.Hj, 42.70.QsThe study of unconventional lasing is a novel and active field of research. Mirror-less, micron-sized and three-dimensional lasers, in the form of random lasers randomlasers , micro-sphere and microdrop lasers microcavity , photonic crystal (PhC) lasers PhClasers and chaotic-cavity lasers caoticCav have been recently proposed as more sophisticated alternatives to standard lasers made of macroscopic mirrors and Fabry-Pérot cavities.
Artificially engineered photonic materials, with nanoscopic features and topologies ranging from order to disorder, allow for a superior control of light modes, dispersion and gain ceferev . Photonic structures can control and tune the directionality and spectral extent of the emitted light without relying on light absorption, allowing for efficient light sources with smarter functionalities.
While the research of 2D PhC lasing can exploit high-quality and low volume micro-cavities 2Dlasing , in three dimensions (3D) PhC lasing is so far only based on the large light-matter interaction that can be achieved by extended Bloch modes, at band-edges PhClasingBedge or at high-energy flat bands PhClasingHigh . These modes effectively confine the light in the active medium and increase the amplification and the gain extraction from large bulk volumes PhClasingPrediction . A similar confinement, but originated by multiple scattering, is responsible for random lasing of diffusive modes randomlasers . The first pioneering study of gain in PhC has demonstrated a directional modification of the gain spectral profile, attributed to band-edge effects gaininPhC . Enhanced optical gain was also extrapolated from a decreased lasing threshold at the -pseudogap edges of an opal-TiO2 composite containing quantum dots gaininPhC2 .
The lasing wavelength selection and the decrease of the lasing threshold in PhC lasers has been often claimed to be connected to spectral maxima of density of states PhClasingPrediction , but a quantitative evidence of the directional nature of the gain length due to the dependance of the density of the states on the crystallographic direction in which the amplification grows has never been reported so far. Demonstrating this link is of paramount importance not only for the future developments of nano-structured laser devices but also as a starting point for several fundamental investigations ranging from quantum information to slow light phenomena.
In this article we report a detailed measurement of the gain length in opal-based photonic crystals doped by Rhodamine 6G. The measured gain length has a six-fold symmetry, takes values up to cm-1 along the -K directions in reciprocal space and decreases to values below measurable levels of cm-1 far from the high symmetry directions. We compare these findings to the directional density of states which has been predicted to be responsible for the increased gain.
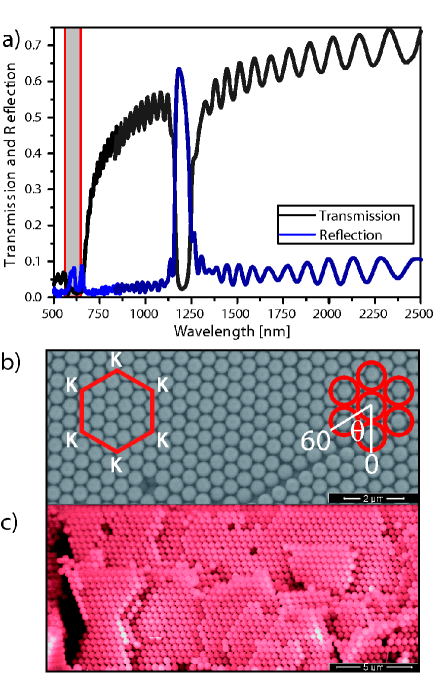
The samples under study are thin film artificial opals Colvin consisting of an fcc matrix of polystyrene spheres (PS, refractive index, , diameter nm) bulk-doped with Rhodamine 6G with an emission centered around nm (from Duke Scientific). Figure 1 shows transmission and reflection spectrum from the sample (in the panel a) as well as a two SEM pictures, of the top of sample (in panel b) and of its side (in panel c). While a band-gap is visible at around 1200 nm, the dye emission indicated by the gray area sits in the high energy peaks of the spectrum around 574 nm.
The optical gain in the dye-doped three-dimensional artificial opals can be extracted by employing the stripe length technique stripelength ; DNAgain . The emission intensity and amplification is measured as a function of the length of the illuminated area on the sample. In figure 2a, a sketch of the measurement configurations used for the experiment is presented, while figure 2b report the curves from which the amount of optical amplification is extracted. The spontaneous emitted photons, traveling in the direction of the illuminated stripe, undergo an exponential amplification of the intensity with respect to the excitation length as they pass trough an area of population inversion. This can be quantified by the gain coefficient, the most important actor in light amplification and lasing, which is a robust quantity, independent on the sample thickness (in absence of pump depletion) and on the edge coupling of the light from the stripe to the detector. The output intensity collected at one edge of the stripe is the sum of spontaneous and stimulated emission and has the well-known spatial dependence stripelength :
| (1a) | |||||
| (1b) | |||||
where is the spontaneous emission (SE) collected by the detector, is the gain (including confinement effects), the absorption length and the scattering mean free path. The quantity , refereed to as the net gain, is directly obtained from stripe-length measurements. Equation 1 a, holds until gain saturation is reached, which occurs for stripe lengths larger than around 150-200 m, in our case.
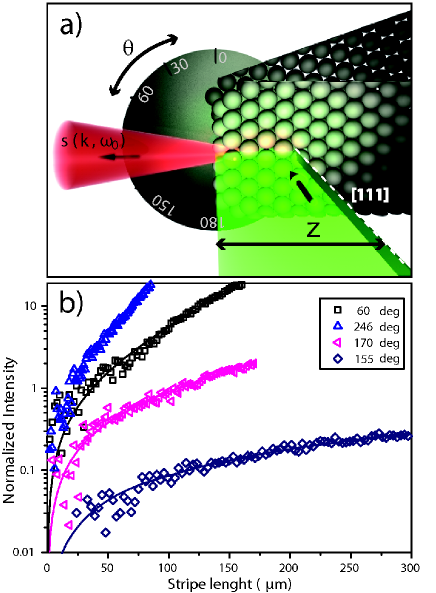
In our experiment the excitation is carried out by illuminating the sample along the PhC direction (like in figure 2a) with a Q-switched Nd:Yag laser, 9 ns pulses, 10 Hz repetition rate, at a wavelength of 532 nm. The laser beam has the shape of a stripe of thickness m obtained by focusing the laser source with a cylindrical lens of 75 mm focal. Measurements of the dependence of as a function of has been performed by cutting the stripe with a blade moved automatically with micrometer accuracy. A miniature fiber-coupled spectrometer is used to efficiently collect the light along the stripe direction, as described in ref. DNAgain .
By rotating the stripe relative to the in-plane direction , various crystallographic directions , including the high-symmetry ones, can be explored. In Fig. 2b, the dependence of the collected fluorescence intensity on the stripe length , for various different orientations of the photonic crystal is shown. Emission for light propagating along two -K crystal directions is presented (60 and 240 deg), as well as an intermediate position (170 deg). A non symmetrical direction is probed too (155 deg). These measurements show a clear dependence of the fluorescence intensity on the propagating angle in the crystal.
This result is a consequence of the photonic crystal complex band structure that alter the optical gain and amplification processes as compared to an homogenous medium. In figure 3a we report the isofrequency surface at the working frequency. For the sake of clarity only half the isofrequency, cut along a plane perpendicular to the direction, is presented. Figure 3b shows the calculated band structure along a path in the reciprocal space (sketched in panel a). From the full 3D band structure (calculated by preconditioned conjugate-gradient minimization of the block Rayleigh quotient in a planewave basis, using a freely available software package mpb ) the isofrequency surface and group velocities are obtained.
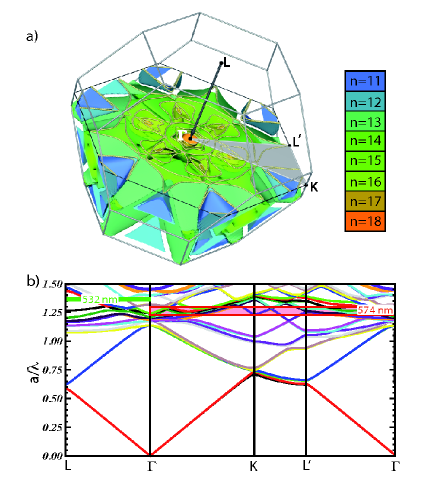
In the band diagram in figure 3b, the directions K, K-L and L’- are explored when rotating the sample around the direction normal to its surface. The shaded red region indicates the gain curve of the dye which excites the high order diffractive modes when pumped by a frequency doubled Nd:Yag laser (wavelength 532 nm) which is indicated by the green line. Note that ’ is not a high symmetry point equivalent to , but just the midpoint of the experimental trajectory along the hexagonal facet of the Brillouin zone.
An homogenous media would exhibit a circular (resulting from the section of a sphere) isofrequency contour; in a photonic crystal a rich structure with a non-constant curvature is visible, which results from contributions of eight different bands around the emission energy. Each point in the isofrequency surface identify a wave-vector , for which the direction of propagation of the energy is given by the gradient of the surface.
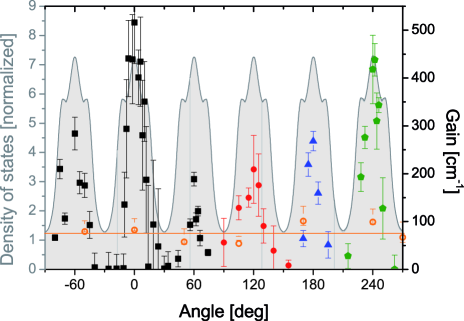
By fitting the data in figure 2b to equation 1 , the net gain can be extracted and plotted as a function of the stripe direction as in figure 4. is affected by the variations of group velocities and varies as a function of the probed crystallographic direction. The angle corresponds to the configuration in which the stripe is aligned with the opal growth axis, and it identifies a -K direction. A large variation of is visible with a clear C6 symmetry and maxima along the six -K directions (each 60 deg from deg) reaching values up to 500 cm-1. The minima measured along less-symmetrical directions reach values which are limited to cm-1 by the measurement sensitivity: a more than 20-fold variation is observed. Different color symbols in figure 4 corresponds to measurement sets that have been performed by rotating the sample 90 degrees. Each set of data is thus obtained on a different side of the sample. The good quality of the latter - and, especially, the homogeneous dye distribution - allows a high reproducibility of the measurements, as shown in figure 4.
In order to prove that the observed effect depends on the regular disposition of the spheres, a reference sample has been measured too: the same PhC sample after melting by keeping at 100 Celsius overnight. This temperature is enough to deform the PS spheres while keeping the film shape (as confirmed by SEM inspection) without degrading the dye molecules. The reference sample has a dye molecule density 35% higher than the regular sample, as it is a compact film as compared to the opal PhC whose filling fraction is 0.74. The measured gain of 99 20 cm-1 in the reference is now independent on the excitation angle. The orange thin line in figure 4 shows the reference sample gain multiplied by 0.74 to account for the dye molecule density increase.
The data are compared to the directional density of states that is calculated as the density of modes with Poynting vector pointing in the stripe direction, given by contribution of modes with any -vector in the 3D space, and shown in figure 4 as the curve above the gray shaded region.
The extraordinary increase in optical amplification and in figure 4, as predicted by Sakoda PhClasingPrediction ; Sakodabook , is connected to the variation of the density of states in the direction of the stripe. The number of available optical states in a given direction, i.e. for a given Poynting vector parallel to , determines the emission probability for the excited dye molecules. A higher value of corresponds to a higher emission probability in the mode and therefore a larger gain for photons travelling in the direction. The shaded region in figure 4 shows the variation of along the various directions in the plane. The theoretical curve in figure 4 has been rescaled by the ratio of the computed value of for an homogenous medium to the measured gain in the reference melted opal.
In general cases, also scattering and absorption can vary with the angle. Far from the dye absorption curve, the opal absorption length has been measured to be m sapienzaPRL , which is therefore negligible for the system under study. The scattering mean free path can present indeed large variations with , as studied in ref. rapidPRB . For lower energy and similar opals it has been measured to be in the range m. This value is larger but comparable to the gain length which is here in the range 20-200 m. Large scattering is anyhow responsible only for a decrease of the amplification and cannot explain the large increase in that we have measured. If the variations of were governed by , then the value of should be smaller than and no net gain could be measured. In our case scattering losses reduce the measured gain in figure 4 and set a minimum value of that can be measured in our experiment (20 cm-1).
In conclusion we have presented an observation of a six-fold increase of the gain in opal photonic crystal, as compared to the homogeneous film, and a more than 20-fold variation of between -K and less symmetrical directions, in the same photonic crystal. We explain this enhancement as due to a large increase of the density of the available modes when exciting around the -K direction. Large variations of the gain in PhC show the impact of the tailored density of states on light generation and amplification and open the way to enhance other phenomena like nonlinear wave mixing and harmonic generation. Our results show how nanostructured media could be at the basis of the development of novel lasing sources with exceptional tunability, directionality and efficiency while being plastic photonics CMOS compatible, and candidates for in-board interconnections for future generation computers.
Acknowledgement We thank M. Ibisate, C. Soukoulis, K. Sakoda, and J.J. Saenz for fruitful discussion. C.C. acknowledges the ERC GRANT (FP7/2007-2013) n.201766. RS acknowledges support by RyC, LSFP acknowledges support by JdC, JFGL acknowledges support by JAE. The work was supported by MAT2006-09062, the Spanish MEC Consolider-NanoLight.es CSD20070046 and the Comunidad de Madrid S-0505/ESP-0200.
References
- (1) S. Gottardo, R. Sapienza, P.D. García, A. Blanco, D. S. Wiersma, C. López, Nat. Phot. 2 429-432 (2008); D.S. Wiersma Nat. Phys. 4 359 (2008).
- (2) R.K. Chang and A.J. Campillo, Optical Processes in Microcavities, eds. World Scientific (1996); K. L. van der Molen, P. Zijlstra, Ad Lagendijk, and A. P. Mosk, Opt. Lett. 31, 1432-1434 (2006).
- (3) C. Conti and A. Fratalocchi Nat. Phys., 4 794-798 (2008).
- (4) A.D. Stone Phys. Scr. T90 248-262 (2001)
- (5) C. López, Adv. Mater. 15 (20) 1679 (2003).
- (6) O. Painter et al., Science 284, 1819 (1999). H.-Y Ryu, M. Notomi, E. Kuramoti, and T. Segawa, Appl. Phys. Lett. 84, 1067 (2004); H.-G. Park et al., Science 305, 1444 (2004).
- (7) K. Yoshino, S. Tatsuhara, Y. Kawagishi, M. Ozaki, A. A. Zakhidov, Z. V. Vardeny, Appl. Phys. Lett. 74, 2590 (1999); M. N. Shkunov, Z. V. Vardeny, M. C. DeLong, R. C. Polson, A. A. Zakhidov, R. H. Vaughman, Adv. Funct. Mat. 12, 21 (2002); Y. Nishijima, K. Ueno, S. Joudkazis, V. Mizeikis, H. Misawa, M. Maeda, M. Minaki, Opt. Express 16, 13676 (2007); W. C. Stumpf, T. Asano, T. Kojima, M. Fujita, Y. Tanaka, S. Noda, Phys. Rev. B 82, 075119 (2010).
- (8) M. Scharrer, A. Yamilov, X. Wu, H. Cao, R. P. H. Chang, Appl. Phys. Lett. 88, 201103 (2006).
- (9) K. Sakoda, K. Ohtaka, T. Ueta, Opt. Express 4, 481 (1999); J. P. Dowling, M. Scalora, M. J. Bloemer, C. M. Bowden, J. Appl. Phys. 75, 1896-1899 (1994).
- (10) Y. Vlasov, K. Luterova, I. Pelant, B. Honerlage and v.N. Astratov Appl. Phys. Lett. 71 1616-1618 (1997)
- (11) G. R. Maskali, M. A. Petruska, J. Nanda, I. V. Bezel, R. D. Schaller, H. Htoon, J. M. Pietryga, V. I. Klimov, Adv. Mater. 18, 343 (2006)
- (12) P. Jiang, J. F. Bertone, K. S. Hwang, V. L. Colvin, Chem. Mater. 11, 2131 (1999).
- (13) K. L. Shaklee and R. F. Leheny, Appl. Phys. Lett. 18, 475–477 (1971); L. Dal Negro, P. Bettotti, M. Cazzanelli, D. Pacifici, L. Pavesi, Opt. Comm., 229, 337 (2004); L. Pavesi, L. Dal Negro, C. Mazzoleni, G. Franz F. Priolo, Nature, 408, 440 (2000); C. Lange, M. Schwalm, S. Chatterjee, and W. W. R hle, Appl. Phys. Lett. 91, 1911071, (2007).
- (14) M. Leonetti, R. Sapienza, M. Ibisate, C. Conti, C. López, Opt. Lett. 34, 3764, (2009).
- (15) Steven G. Johnson and J. D. Joannopoulos, Opt. Expr. 8 (3) 173-190 (2001).
- (16) K. Sakoda, Opt. Exp. 4 (5) 167-176 (1999); K. Sakoda, Optical Properties of Photonic Crystals, Second Edition Springer Series in Optical Sciences Vol. 80 (Springer, New York, 2001).
- (17) R. Sapienza, P.D. García, J. Bertolotti, M.D. Martín, A. Blanco, L. Viña, C. López, D.S. Wiersma, Phys. Rev. Lett. 99, 233902 (2007)
- (18) P.D. García, R. Sapienza, L.S. Froufe-Pérez, and C. López, Phys. Rev. B 79, 241109 (2009).