The Effect of Active Galactic Nuclei on the Mid-Infrared Aromatic Features
Abstract
We present Spitzer measurements of the aromatic (also known as PAH) features for 35 Seyfert galaxies from the revised Shapley–Ames sample and find that the relative strengths of the features differ significantly from those observed in star-forming galaxies. Specifically, the features at 6.2, 7.7, and 8.6 m are suppressed relative to the 11.3 m feature in Seyferts. Furthermore, we find an anti-correlation between the L(7.7 m)/L(11.3 m) ratio and the strength of the rotational H2 emission, which traces shocked gas. This suggests that shocks suppress the short-wavelength features by modifying the structure of the aromatic molecules or destroying the smallest grains. Most Seyfert nuclei fall on the relationship between aromatic emission and [Ne ii] emission for star-forming galaxies, indicating that aromatic-based estimates of the star-formation rate in AGN host galaxies are generally reasonable. For the outliers from this relationship, which have small L(7.7 m)/L(11.3 m) ratios and strong H2 emission, the 11.3 m feature still provides a valid measure of the star-formation rate.
Subject headings:
galaxies: active, galaxies: nuclei, galaxies: Seyfert, galaxies: ISM1. Introduction
The mid-infrared (mid-IR) aromatic emission features are a universal product of star formation in moderate-to-high–metallicity galaxies (e.g., Roche et al., 1991; Lu et al., 2003; Smith et al., 2007a). Their molecular carriers, often assumed to be polycyclic aromatic hydrocarbons (PAHs, Leger & Puget, 1984; Allamandola et al., 1985; Tielens, 2008), radiate through IR fluorescence following vibrational excitation by a single ultraviolet (UV) photon (Tielens, 2005) and provide an indirect measurement of the UV radiation field strength, and therefore the star-formation rate (SFR), that is largely extinction independent (e.g., Peeters et al., 2004; Calzetti et al., 2007; Rieke et al., 2009). This emission is thought to originate in photo-dissociation regions where aromatic molecules are shielded from the harsh radiation field near hot stars (e.g., Povich et al., 2007). These molecules can also be destroyed by the harder radiation field associated with an active galactic nucleus (AGN, Voit, 1992; Genzel et al., 1998). Nonetheless, aromatic features are readily detected in many AGNs above IR continua boosted by hot dust, and they have been used to probe the SFR in AGN host galaxies (e.g., Schweitzer et al., 2006; Shi et al., 2007, 2009; Lutz et al., 2008). Understanding what environments destroy or modify these features is important for constraining systematic uncertainties in aromatic-based estimates of the SFR, and is a key way to probe the nature of their molecular carriers, an open issue in our understanding of the interstellar medium.
Duley & Williams (1981) first suggested that vibrational modes of aromatic hydrocarbons could produce the observed features, which were subsequently identified with specific C–H and C–C bending and stretching modes (Allamandola et al., 1989). Specifically, the 6.2 and 7.7 m features are produced by C–C stretching modes, the 8.6 m feature by C–H in-plane bending modes, and the 11.3 and 12.7 m features by C–H out-of-plane bending modes. While these features are commonly attributed to PAHs, we use the simpler, more general term “aromatic” to avoid making assumptions about the detailed structure of the molecules. It is worth noting, for example, that PAH spectra from laboratory measurements and quantum chemical calculations are unable to match the range of astronomical spectra without artificial enhancements of the 6.2, 7.7, and 8.6 m feature strengths (e.g., Li & Draine, 2001). Regardless of this uncertainty associated with uniquely matching observed spectra with expectations for specific molecules, one can probe the properties of the aromatic carriers by measuring the relative strengths of the emission features, which are expected to vary as a function of charge state (e.g., Bakes et al., 2001), molecular size (e.g., Draine & Li, 2001), and molecular structure (e.g., Vermeij et al., 2002).
Efforts to study variations in aromatic feature strengths outside the Milky Way have focused on star-forming galaxies (e.g., Smith et al., 2007a; Galliano et al., 2008; Roseboom et al., 2009; O’Dowd et al., 2009), but the AGNs included in these studies have shown evidence for suppression of shorter wavelength features (e.g., those at 6.2, 7.7, and 8.6 m) relative to those at longer wavelengths. For example, Smith et al. (2007a) studied a sample of 59 galaxies from the Spitzer Infrared Nearby Galaxy Survey (SINGS, Kennicutt et al., 2003), of which 12 have Seyfert nuclei and 20 have low-ionization nuclear emission-line regions (LINERs), and they found a tendency for the systems with reduced 6–8 m features to be associated with low-luminosity AGNs. They speculated on possible causes for this behavior, including whether the AGN can modify the aromatic grain size distribution or serve as the excitation source for aromatic emission. Similarly, O’Dowd et al. (2009) studied a sample of 92 galaxies at from the Spitzer SDSS GALEX Spectroscopic Survey, including eight AGN-dominated and 20 composite systems, and found that the AGNs exhibited lower 7.7/11.3 m ratios. They interpreted this behavior as being consistent with destruction of small aromatic molecules by shocks or X-rays associated with the AGNs, but they were unable to distinguish any differences between the AGN-dominated and composite objects, nor any strong correlation with AGN power. The physical slit size at their median redshift is 6 kpc, so there is little spatial information.
In this paper we analyze the aromatic features drawing from the sample of 89 local Seyfert galaxies studied by Diamond-Stanic et al. (2009). This sample is from the revised Shapley–Ames catalog (RSA, Sandage & Tammann, 1987), and includes every galaxy brighter than that is known to host Seyfert activity (Maiolino & Rieke, 1995; Ho et al., 1997). The median distance of the sample is 22 Mpc, so the 3.7″ slit width of the Short-Low (SL) module of the Infrared Spectrograph (IRS, Houck et al., 2004) on the Spitzer Space Telescope (Werner et al., 2004) provides spatial information on scales of a few hundred parsecs, allowing us to isolate nuclear regions distinct from the rest of the galaxy. As a result, we are able to probe the effect of AGNs on the aromatic features more systematically than has previously been done.
2. Data
We gathered data from the Spitzer archive taken with the IRS SL module (–14.5 m, –128) from a variety of programs (24, 86, 159, 668, 3247, 3269, 3374, 30471, 30572, 30577, 30745, 40018, and 50702), as well as dedicated data taken for this study (program 40936, PI: G. H. Rieke). We use CUBISM (Smith et al., 2007b) to extract one-dimensional spectra from the basic calibrated data using apertures oriented along the slit direction. This aperture size was chosen to isolate the nuclear component of the aromatic emission while still including a substantial fraction of the diffraction-limited beam. We use the calibration for extended sources based on the assumption that the regions producing aromatic emission are spatially extended, so the extracted spectra are in units of surface brightness. We use overlapping data in the 7.59–8.42 m region to scale the SL2/SL3 orders to the SL1 order when offsets are apparent; these offsets are % in all cases.
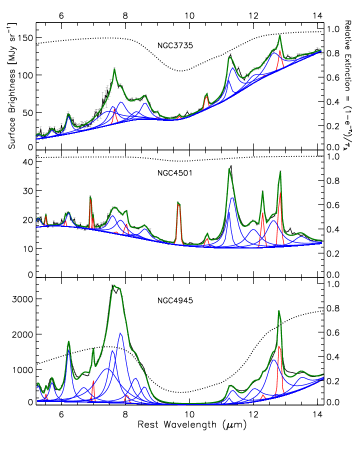
We then use a modified version of PAHFIT (Smith et al., 2007a) to determine the strength of the various aromatic features. This spectral fitting package includes aromatic features represented by Drude profiles, dust continuum emission represented by modified blackbodies at fixed temperatures, fine-structure lines and H2 rotational lines represented by Gaussian profiles, starlight represented by K blackbody emission, and dust extinction represented by a power-law and silicate features. Because Seyfert galaxies exhibit higher-ionization emission lines, silicate dust emission, and hot-dust continuum emission, we additionally include a [Ne vi] 7.652m emission line and a silicate emission component, both represented by Gaussian profiles, and we use temperatures of 1000, 750, 500, 350, 225, 150, and 100 K for the dust continuum emission. We show example PAHFIT decompositions for three sources exhibiting a range in continuum shape and silicate extinction in Figure 1.
3. Results
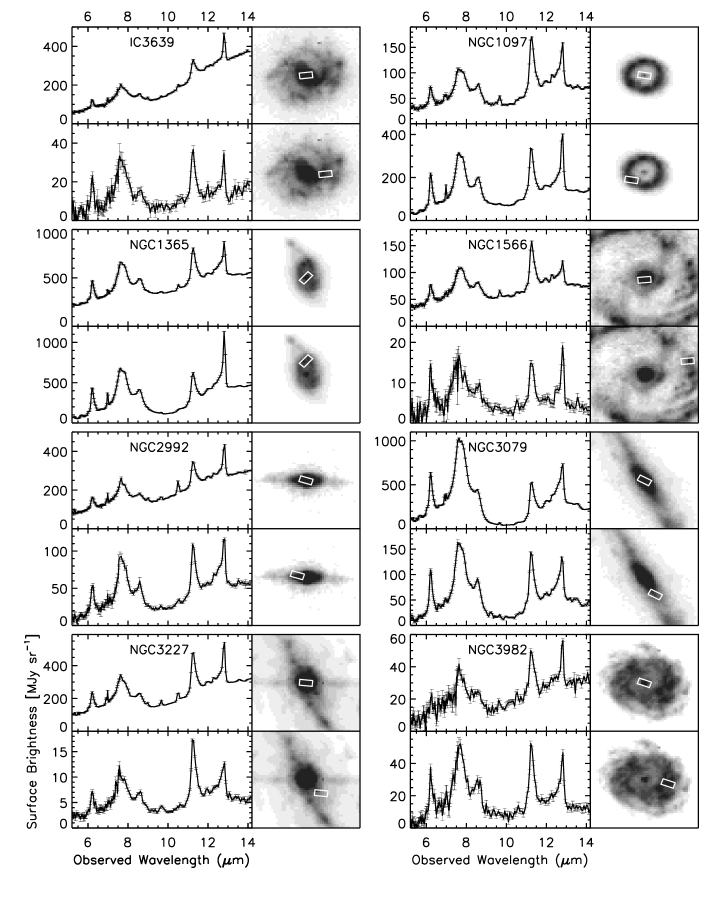
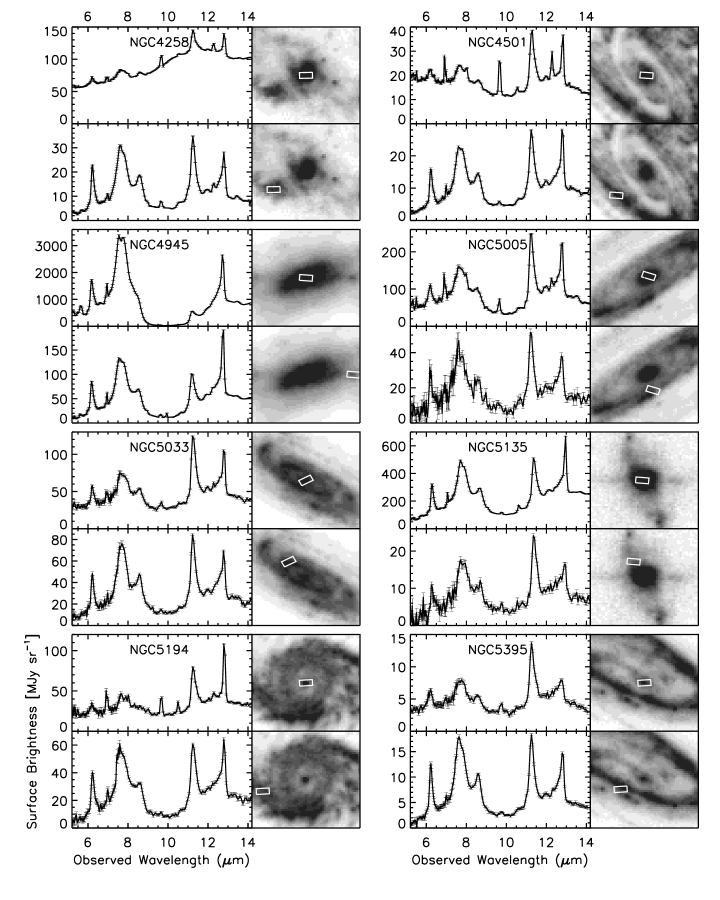
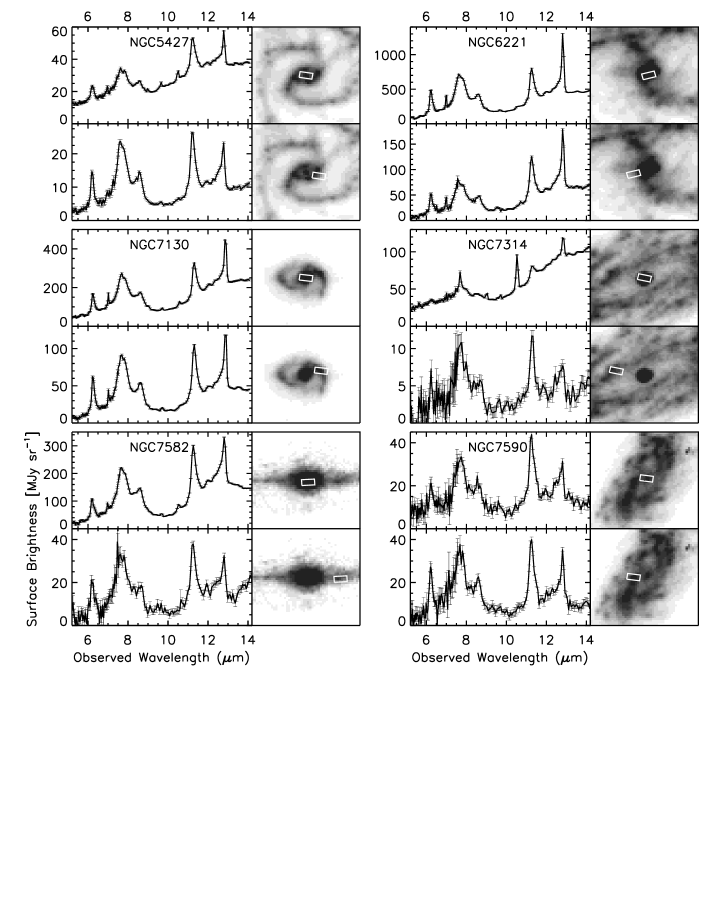
The data exhibit a range of signal-to-noise ratios (S/N), so we visually inspected all of the nuclear spectra to identify those that have clear detections of the relevant aromatic features and whose spectra are adequately described by the PAHFIT model. The spectra for these 35 sources are shown in Figure 2. Since many of the observations were executed with the mapping mode of IRS, it is also possible to extract spectra for off-nuclear regions in some galaxies, allowing for comparison between spectra dominated by the active nucleus and spectra dominated by H ii regions within the same galaxy. We identified off-nuclear regions that were covered by the IRS slit and had sufficient S/N to detect the relevant aromatic features in 21/35 galaxies. We show a comparison between the nuclear and off-nuclear extractions for these galaxies in Figure 5, and we compile relevant measurements in Tables 1 and 2.


3.1. Aromatic Feature Ratio Distributions
In Figure 8, we show the distribution of aromatic feature ratios for the 35 RSA Seyfert nuclei and 21 off-nuclear regions, as well as for 27/59 SINGS galaxies from Smith et al. (2007a) that have H ii nuclear classifications (i.e., those that are not Seyferts or LINERs). We find that the L(6.2 m)/L(11.3 m), L(7.7 m)/L(11.3 m), and L(8.6 m)/L(11.3 m) ratios are systematically lower for the Seyfert nuclei than for the off-nuclear regions or the SINGS H ii galaxies. These differences are all statistically significant with based on the two-sample Kolmogorov–Smirnov (K-S) test (see Table 3), a non-parametric test that considers the maximum deviation between two cumulative distribution functions (Press et al., 1992; Wall & Jenkins, 2003). On the other hand, there are no significant differences between these feature ratios for the off-nuclear regions and the SINGS H ii galaxies, so the feature strengths in regions of star formation are consistent with being drawn from the same parent distribution. Furthermore, the ratios among the 6.2, 7.7, and 8.6 m features show no significant differences between any of the samples.
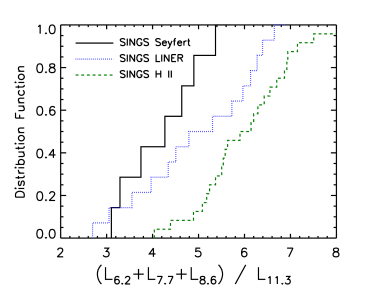
Smith et al. (2007a) noted that the LINERs and Seyferts in the SINGS sample were offset towards lower L(7.7 m)/L(11.3 m) ratios when compared to the H ii galaxies. We illustrate this result graphically in Figure 9, which shows the distribution functions of the ratio of 6.2, 7.7, and 8.6 m features to the 11.3 m feature for galaxies with Seyfert, LINER, and H ii optical classifications. Both Seyferts () and LINERs () have ratios that are significantly lower than the H ii galaxies. While the SINGS Seyferts have somewhat lower ratios than the LINERs, this difference is not statistically significant, and neither sample is statistically distinguishable from the RSA Seyferts.


3.2. Trends with H2 emission
Inspection of Figure 2 reveals that several Seyferts with small L(7.7 m)/L(11.3 m) aromatic feature ratios also exhibit a strong H2 S(3) rotational line at 9.67 m (e.g., NGC4501, NGC5194.) To investigate this behavior, we plot the strength of the H2 S(3) line, normalized to the strength of the aromatic features, as a function of the L(7.7 m)/L(11.3 m) ratio in Figure 10. We find a strong anti-correlation in this plot such that sources with the smallest L(7.7 m)/L(11.3 m) ratios also have the strongest H2 emission. The Spearman’s rank correlation coefficient is with a probability of no correlation, while Kendall’s is with ; these non-parametric tests consider the agreement between the ranks of quantities in pairs of measurements (Press et al., 1992; Wall & Jenkins, 2003), with coefficient values ranging from -1 (perfect disagreement) to 1 (perfect agreement). Roussel et al. (2007) found that H2 rotational lines scale tightly with the aromatic features for SINGS H ii galaxies, but that Seyferts and LINERs often exhibit excess H2 emission, which they attribute to shocks. We explore the hypothesis that shocks cause both the excess H2 emission and the anomalous aromatic ratios for AGNs in Section 4.4.
Among the sources excluded from the above analysis due to a lack of 6.2, 7.7, or 8.6 m aromatic feature detections, there are a significant number with clearly detected 11.3 m features and H2 S(3) lines. In Figure 11, we show the nuclear spectra for a dozen of these sources, sorted by the equivalent width of the 11.3 m feature. These spectra exhibit the small L(7.7 m)/L(11.3 m) ratios and strong H2 S(3) lines characteristic of sources in the top-left of Figure 10. Due to uncertainties associated with estimating the strength of weak, broad features and determining robust upper limits (e.g., proper continuum placement), we do not include any of these sources in our subsequent analysis. However, their behavior is consistent with that in Figure 10 and supports the reality of the trend between aromatic feature characteristics and H2 line strength.
3.3. Evidence for extinction of aromatic features
The sources with the largest L(7.7 m)/L(11.3 m) ratios, NGC4945 and NGC3079, also have the strongest silicate absorption features. This suggests that the 11.3 m feature is being significantly attenuated, consistent with previous results for starburst and luminous infrared galaxies (e.g., Brandl et al., 2006; Pereira-Santaella et al., 2010), and implies that a significant fraction of the silicate-absorbing material is extended relative to the regions that produce the aromatic features. Although the aromatic feature measurements in PAHFIT are corrected for extinction, in cases as extreme as these two galaxies the resulting feature strengths are highly uncertain. For all other galaxies in our sample, the inferred extinctions are for all features.
4. Discussion
The result that Seyfert galaxies exhibit weak 6.2, 7.7, and 8.6 m aromatic features relative to the 11.3 m feature could be explained by radiative or mechanical processing of the molecular carriers by the active nucleus. Here we explore the relevant physical and chemical effects that could modify the observed feature strengths.
4.1. Ionization Balance
Previous experimental (e.g., Szczepanski & Vala, 1993; Hudgins & Allamandola, 1995) and theoretical (e.g., DeFrees et al., 1993; Langhoff, 1996) work on PAHs has shown that the C–C stretching modes that produce the 6.2 and 7.7 m features, as well as the C–H in-plane bending modes that produce the 8.6 m feature, are more efficiently excited in ionized molecules. The ratios of these features to the 11.3 m feature, which is produced by C–H out-of-plane bending modes, are lower for neutral molecules (see Figure 1 of Allamandola et al., 1999). The fraction of ionized aromatic molecules is set by the balance between ionization and recombination, which depends on the UV radiation field density (), the gas temperature (, and the electron density () according to (Bakes & Tielens, 1994).
Galliano et al. (2008) argued that the variations in aromatic feature ratios for a heterogeneous sample of 50 objects (including Galactic regions, Magellanic H ii regions, and galaxies, as well as spatially resolved regions within seven of those objects) are controlled by this ionization balance. Similar to our results, they found that the relative strengths of 6.2, 7.7, and 8.6 m features showed little variation, while the ratios between these features and the 11.3 m feature varied by an order of magnitude. This hypothesis is also supported by observations of Galactic reflection nebulae by Joblin et al. (1996) and Bregman & Temi (2005), who found decreasing L(8.6 m)/L(11.3 m) and L(7.7 m)/L(11.3 m) ratios as a function of distance from the ionizing source, consistent with an increasing neutral fraction.
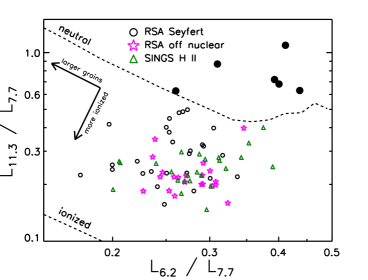
To compare with model expectations for ionized and neutral aromatic molecules, we plot L(11.3 m)/L(7.7 m) v. L(6.2 m)/L(7.7 m) for the Seyfert nuclei, off-nuclear sources, and SINGS H ii galaxies in Figure 12. This can be compared with Figure 16 of Draine & Li (2001) and Figure 5 of O’Dowd et al. (2009), although we use a condensed plot range. We find that a number of Seyferts lie beyond the range of model predictions, even for completely neutral aromatic molecules; these are the 6/35 Seyferts with L(11.3 m)/L(7.7 m: NGC5194, NGC4501, NGC4639, NGC1433, NGC2639, and NGC5005. While such L(11.3 m)/L(7.7 m) ratios could be produced by large ( C atoms) neutral molecules, they would be expected to have L(6.2 m)/L(7.7 m, which is inconsistent with the data. Similar extreme aromatic band strengths were observed by Reach et al. (2000) for the quiescent molecular cloud SMC B1 No. 1, and Li & Draine (2002) were unable to reproduce the observed band ratios even with completely neutral grains.
The above comparison is for a single Milky Way–based model, and laboratory studies have found larger L(11.3 m)/L(7.7 m) ratios for neutral PAHs, but it does illustrate the difficulty in explaining our results for Seyfert galaxies in terms of a low ionized fraction. Furthermore, under the assumption that aromatic features are produced by star formation (see Section 4.5), the temperatures and densities of the aromatic-emitting regions should be typical of PDRs, whereas the UV radiation field would likely be enhanced by the AGN. This implies that the ionized fraction would be higher, not lower. Thus, ionization balance arguments appear unable to explain the behavior of the aromatic features around AGNs.
4.2. Grain Size
Smaller aromatic molecules contribute preferentially to the shorter-wavelength features (e.g., Schutte et al., 1993), but they are subject to photodestruction by the UV radiation field and collisional destruction by shocks. Based on laboratory studies, Jochims et al. (1994) found a critical size of 30–40 C atoms, below which PAHs would mainly be photodissociated, while Allain et al. (1996) suggested a larger critical value of 50 C atoms based on their models. Le Page et al. (2003) agreed that small PAHs with –20 C atoms or fewer would be destroyed in most environments, but their models indicated that PAHs in the 20–30 C atom range may survive, albeit with most of their peripheral H atoms stripped away, while larger PAHs would survive with their H atoms intact. Micelotta et al. (2010a) found that PAHs with 50 C atoms would not survive in shocks with velocities greater than 100 km s-1, while PAHs with 200 C atoms would be destroyed by shocks with velocities above 125 km s-1.
Destruction of the smallest molecules is expected to result in the 6.2 and 7.7 m features being suppressed relative to the 11.3 m feature, as well as the 6.2 m feature being suppressed relative to the 7.7 m feature (e.g., Draine & Li, 2001; Galliano et al., 2008). The former effect is clearly seen in Figure 8, but the latter is not. Thus, the hypothesis that small-grain destruction can explain the observed ratios is only tenable if the molecules that produce the 6.2, 7.7, and 8.6 m features are destroyed with similar efficiency, which is inconsistent with existing models.
4.3. Hydrogenation and Molecular Structure
The level of hydrogenation of the aromatic molecules will affect the number of C–H bonds and therefore the relative strength of the C–H and C–C vibrational modes. An increase in the C–H/C–C ratio was proposed by Reach et al. (2000) to explain the large L(11.3 m)/L(7.7 m) ratio observed in SMC B1 No. 1, although Draine & Li (2001) and Li & Draine (2002) point out that PAHs with C atoms are already expected to be fully hydrogenated. Some range in C–H/C–C ratios, even for fully hydrogenated molecules, is facilitated by the structure of the C skeleton, which can be compact with more C–C bonds or open with more C–H bonds (e.g., pericondensed PAHs v. catacondensed PAHs, Tielens, 2005). The structure also affects the number of adjacent C–H groups per aromatic ring, and therefore the relative strengths of the 11.3 m feature, which is produced by solo C–H bonds, and the 12.7 m feature, which is produced by C–H multiplets (e.g., Hony et al., 2001). For example, based on the large L(12.7 m)/L(11.3 m) ratio for SMC B1 No. 1, Vermeij et al. (2002) argued for a compact structure with a higher incidence of C–H multiplets.
To investigate such behavior, we plot the L(12.7 m)/L(11.3 m) ratios for Seyfert nuclei, off-nuclear regions, and SINGS H ii galaxies in Figure 13. The Seyfert nuclei exhibit significantly smaller ratios (), while the ratios for off-nuclear regions and SINGS H ii galaxies are not distinguishable. This implies that the aromatic molecules in Seyfert nuclei may have fewer C–H multiplets. Thus a scenario where AGN processing or environment results in open, uneven molecular structures with higher C–H/C–C ratios and fewer adjacent C–H groups could qualitatively explain the observed 6–13 m aromatic spectra.

4.4. The role of AGN-driven shocks
As presented in Section 3.2 and Figure 10, the Seyfert galaxies with the smallest L(7.7 m)/L(11.3 m) aromatic feature ratios also exhibit the strongest H2 S(3) emission, which probes hot molecular gas (upper level temperature 2500 K). The incidence of this excess H2 emission does not scale with AGN luminosity, indicating that shock excitation is more important than X-ray heating (e.g., Roussel et al., 2007). A connection between shock-heated, H2-emitting gas and small L(7.7 m)/L(11.3 m) ratios was found by Ogle et al. (2007) for the radio galaxy 3C 326 and by Guillard et al. (2010) for Stephan’s Quintet, a compact group of interacting galaxies exhibiting a large-scale shock (e.g., Appleton et al., 2006; Cluver et al., 2010). Similarly, Kaneda et al. (2008) found strong H2 emission and small L(7.7 m)/L(11.3 m) ratios in a sample of local elliptical galaxies, many of which host low-luminosity AGNs. More recently, Vega et al. (2010) affirmed this result for a sample of four early-type galaxies classified as LINERs, and they argued that shock processing of aromatic molecules may be responsible for the observed behavior. As discussed above, the Seyferts and LINERs in the SINGS sample also exhibit smaller L(7.7 m)/L(11.3 m) ratios (Smith et al., 2007a) and stronger H2 emission (Roussel et al., 2007) than do the H ii galaxies.
.
Shocks are expected to have profound impacts on interstellar dust via shattering in grain-grain collisions and sputtering in ion-grain collisions (e.g., Jones et al., 1994, 1996). Aromatic features are nonetheless observed in the shocked environments of supernova remnants (e.g., Tappe et al., 2006; Reach et al., 2006) and galactic winds (e.g., Tacconi-Garman et al., 2005; Engelbracht et al., 2006). The observed emission may come from entrained clumps that are not fully exposed to the shock or the hot, post-shock gas (Micelotta et al., 2010a, b). Micelotta et al. (2010a) study the processing of small carbon grains (, corresponding to aromatic molecules) by interstellar shocks and find that their molecular structure is severely denatured for shock velocities of 75–100 km s-1 and they are completely destroyed when km s-1. The effect of this shock processing on the observed aromatic feature ratios is not known. A possibility that could explain the association of modified aromatic feature ratios with strong H2 emission is that shocks may leave open, uneven structures in the surviving aromatic molecules. We note that AGN-driven shocks, if responsible for the observed behavior, do not strongly suppress the 11.3 m feature (see Section 4.6).

4.5. Could the aromatic features be excited by the AGN?
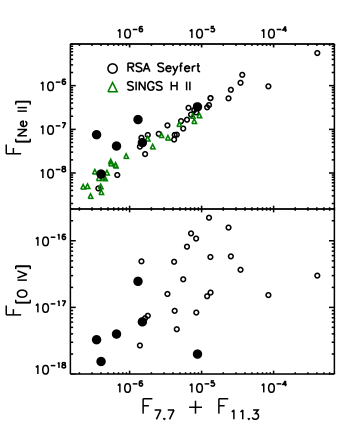
Smith et al. (2007a) speculated that the AGNs could directly excite aromatic emission. If this were the case, SFRs estimated from aromatic features would be overestimated due to this AGN contribution. To investigate the relationship between star formation rate, AGN luminosity, and aromatic feature strength, we plot the fluxes of the [Ne ii] and [O iv] emission lines versus those of the 7.7 m and 11.3 m aromatic features in Figure 14. The [Ne ii] line has an ionization potential of 21 eV and is a reasonable tracer of the SFR (e.g., Ho & Keto, 2007), while the [O iv] line has an ionization potential of 55 eV and traces the AGN intrinsic luminosity (e.g., Meléndez et al., 2008; Diamond-Stanic et al., 2009; Rigby et al., 2009). Figure 14 shows the strong correlation between [Ne ii] and aromatic feature strength for RSA Seyferts (Spearman’s ), which matches the relationship for SINGS H ii galaxies, and it shows the weak correspondence between [O iv] and aromatic feature strength (Spearman’s ). This confirms that the aromatic features are primarily tracing star-formation activity.
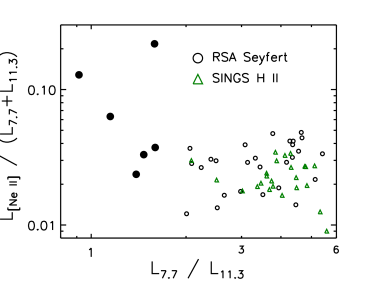
The Seyferts that are outliers in the [Ne ii]–aromatic feature relationship have weak aromatic features, and we show in Figure 15 that these correspond to the sources with the smallest L(7.7 m)/L(11.3 m) ratios. There are no examples with stronger aromatic features as might be expected if the AGN were exciting additional emission. The three obvious outliers, NGC2639, NGC4501, and NGC5194, all have , implying that the AGN contribution to [Ne ii] is % (e.g., Sturm et al., 2002). We note that the incidence of modified aromatic spectra does not show a dependence on AGN luminosity, confirming the results of Baum et al. (2010), who found no correlation between the L(6.2 m)/L(11.3 m) ratio and [Ne v] luminosity.
4.6. Use of Aromatic Features to Determine SFRs
Several studies (e.g., Schweitzer et al., 2006; Lutz et al., 2008; Shi et al., 2009) have used the 6.2 and 7.7 m aromatic features to measure the SFRs in AGN host galaxies. The result that some AGNs exhibit suppressed short-wavelength aromatic features (e.g., the outliers in Figure 15) suggests that such SFR measurements may be underestimated. To determine whether the 11.3 m feature is robust to such effects, we plot separately the relationships between [Ne ii] and the 7.7 and 11.3 m features in Figure 16. We find that almost all of the RSA Seyferts, including those with anomalously high L/L7.7 values, are within a factor of two of the median value L/L. Scatter in this ratio is expected as a function of the age of the stellar population because 21 eV photons from young stars ( Myr) are required to produce [Ne ii], while somewhat older stars can produce 6–13.6 eV UV photons that excite aromatic emission (e.g., Peeters et al., 2004; Díaz-Santos et al., 2010; Pereira-Santaella et al., 2010). Silicate absorption will tend to increase the observed ratio, but this is only a significant effect for sources like NGC4945 and NGC3079 (see Section 3.3). While SFR estimates based on the 11.3 m feature are still subject to the uncertainties that apply to H ii galaxies (e.g., Smith et al., 2007a), such measurements for AGN hosts appear to be robust to the effects of AGN- and shock-processing of aromatic molecules.
5. Conclusions
We have shown that the relative strengths of the mid-IR aromatic features for Seyfert galaxies differ significantly from those for star-forming galaxies, with the 6.2, 7.7, and 8.6 m features being suppressed relative to the 11.3 m feature in Seyferts. The sources with the smallest L(7.7 m)/L(11.3 m) aromatic feature ratios also exhibit the strongest H2 S(3) rotational lines, which likely trace shocked gas (see Figure 10). We explore the relevant physical and chemical effects that could produce the observed aromatic spectra. An enhanced fraction of neutral aromatic molecules could produce qualitatively similar behavior, but the observed ratios lie beyond model predictions for completely neutral molecules and the presence of an AGN would be expected to increase the level of ionization rather than reduce it. Destruction of the smallest aromatic molecules could explain the suppression of shorter wavelength features, but the expected variations in the relative strengths of the 6.2, 7.7, and 8.6 m features are not seen. A modification of the molecular structure that enhances the C–H/C–C ratio could reproduce the observed behavior, and an open C skeleton with fewer adjacent C–H groups would furthermore explain the reduced strength of the 12.7 m feature. Given the connection between strong H2 emission and modified aromatic ratios, we speculate that shock processing could produce such structures. Finally, we show that the aromatic features correlate well with [Ne ii] (i.e., star formation) but not with [O iv] (i.e., AGN luminosity), indicating that AGN excitation of aromatic emission is not significant and that aromatic-based estimates of the SFR are generally reasonable. There are a few outliers with strong H2 emission, small L(7.7 m)/L(11.3 m) ratios, and small aromatic/[Ne ii] ratios, but for these sources the 11.3 m feature is still a reasonably robust tracer of the SFR.
References
- Allain et al. (1996) Allain, T., Leach, S., & Sedlmayr, E. 1996, A&A, 305, 602
- Allamandola et al. (1985) Allamandola, L. J., Tielens, A. G. G. M., & Barker, J. R. 1985, ApJ, 290, L25
- Allamandola et al. (1989) Allamandola, L. J., Tielens, A. G. G. M., & Barker, J. R. 1989, ApJS, 71, 733
- Allamandola et al. (1999) Allamandola, L. J., Hudgins, D. M., & Sandford, S. A. 1999, ApJ, 511, L115
- Appleton et al. (2006) Appleton, P. N., et al. 2006, ApJ, 639, L51
- Bakes & Tielens (1994) Bakes, E. L. O., & Tielens, A. G. G. M. 1994, ApJ, 427, 822
- Bakes et al. (2001) Bakes, E. L. O., Tielens, A. G. G. M., & Bauschlicher, C. W., Jr. 2001, ApJ, 556, 501
- Baum et al. (2010) Baum, S. A., et al. 2010, ApJ, 710, 289
- Brandl et al. (2006) Brandl, B. R., et al. 2006, ApJ, 653, 1129
- Bregman & Temi (2005) Bregman, J., & Temi, P. 2005, ApJ, 621, 831
- Calzetti et al. (2007) Calzetti, D., et al. 2007, ApJ, 666, 870
- Cluver et al. (2010) Cluver, M. E., et al. 2010, ApJ, 710, 248
- Diamond-Stanic et al. (2009) Diamond-Stanic, A. M., Rieke, G. H., & Rigby, J. R. 2009, ApJ, 698, 623
- Díaz-Santos et al. (2010) Díaz-Santos, T., Alonso-Herrero, A., Colina, L., Packham, C., Levenson, N. A., Pereira-Santaella, M., Roche, P. F., & Telesco, C. M. 2010, ApJ, 711, 328
- DeFrees et al. (1993) DeFrees, D. J., Miller, M. D., Talbi, D., Pauzat, F., & Ellinger, Y. 1993, ApJ, 408, 530
- Draine & Li (2001) Draine, B. T., & Li, A. 2001, ApJ, 551, 807
- Duley & Williams (1981) Duley, W. W., & Williams, D. A. 1981, MNRAS, 196, 269
- Engelbracht et al. (2006) Engelbracht, C. W., et al. 2006, ApJ, 642, L127
- Galliano et al. (2008) Galliano, F., Madden, S. C., Tielens, A. G. G. M., Peeters, E., & Jones, A. P. 2008, ApJ, 679, 310
- Genzel et al. (1998) Genzel, R., et al. 1998, ApJ, 498, 579
- Guillard et al. (2010) Guillard, P., Boulanger, F., Cluver, M. E., Appleton, P. N., Pineau des Forets, G., & Ogle, P. 2010, arXiv:1004.0677
- Ho et al. (1997) Ho, L. C., Filippenko, A. V., & Sargent, W. L. W. 1997, ApJS, 112, 315
- Ho & Keto (2007) Ho, L. C., & Keto, E. 2007, ApJ, 658, 314
- Hony et al. (2001) Hony, S., Van Kerckhoven, C., Peeters, E., Tielens, A. G. G. M., Hudgins, D. M., & Allamandola, L. J. 2001, A&A, 370, 1030
- Houck et al. (2004) Houck, J. R., et al. 2004, ApJS, 154, 18
- Hudgins & Allamandola (1995) Hudgins, D. M., & Allamandola, L. J. 1995, J. Phys. Chem., 99, 3033
- Joblin et al. (1996) Joblin, C., Tielens, A. G. G. M., Geballe, T. R., & Wooden, D. H. 1996, ApJ, 460, L119
- Jochims et al. (1994) Jochims, H. W., Ruhl, E., Baumgartel, H., Tobita, S., & Leach, S. 1994, ApJ, 420, 307
- Jones et al. (1994) Jones, A. P., Tielens, A. G. G. M., Hollenbach, D. J., & McKee, C. F. 1994, ApJ, 433, 797
- Jones et al. (1996) Jones, A. P., Tielens, A. G. G. M., & Hollenbach, D. J. 1996, ApJ, 469, 740
- Kaneda et al. (2008) Kaneda, H., Onaka, T., Sakon, I., Kitayama, T., Okada, Y., & Suzuki, T. 2008, ApJ, 684, 270
- Kennicutt et al. (2003) Kennicutt, R. C., Jr., et al. 2003, PASP, 115, 928
- Langhoff (1996) Langhoff, S. R. 1996, J. Phys. Chem., 100, 2819
- Leger & Puget (1984) Leger, A., & Puget, J. L. 1984, A&A, 137, L5
- Le Page et al. (2003) Le Page, V., Snow, T. P., & Bierbaum, V. M. 2003, ApJ, 584, 316
- Li & Draine (2001) Li, A., & Draine, B. T. 2001, ApJ, 554, 778
- Li & Draine (2002) Li, A., & Draine, B. T. 2002, ApJ, 576, 762
- Lu et al. (2003) Lu, N., et al. 2003, ApJ, 588, 199
- Lutz et al. (2008) Lutz, D., et al. 2008, ApJ, 684, 853
- Maiolino & Rieke (1995) Maiolino, R., & Rieke, G. H. 1995, ApJ, 454, 95
- Meléndez et al. (2008) Meléndez, M., et al. 2008, ApJ, 682, 94
- Micelotta et al. (2010a) Micelotta, E. R., Jones, A. P., & Tielens, A. G. G. M. 2010, A&A, 510, A36
- Micelotta et al. (2010b) Micelotta, E. R., Jones, A. P., & Tielens, A. G. G. M. 2010, A&A, 510, A37
- O’Dowd et al. (2009) O’Dowd, M. J., et al. 2009, ApJ, 705, 885
- Ogle et al. (2007) Ogle, P., Antonucci, R., Appleton, P. N., & Whysong, D. 2007, ApJ, 668, 699
- Peeters et al. (2004) Peeters, E., Spoon, H. W. W., & Tielens, A. G. G. M. 2004, ApJ, 613, 986
- Pereira-Santaella et al. (2010) Pereira-Santaella, M., Alonso-Herrero, A., Rieke, G. H., Colina, L., Diaz-Santos, T., Smith, J. D. T., Perez-Gonzalez, P. G., & Engelbracht, C. W. 2010, arXiv:1004.1364
- Povich et al. (2007) Povich, M. S., et al. 2007, ApJ, 660, 346
- Press et al. (1992) Press, W. H., Teukolsky, S. A., Vetterling, W. T., & Flannery, B. P. 1992, Numerical Recipes: The Art of Scientific Computing, 2nd ed. (Cambridge: Cambridge Univ. Press)
- Reach et al. (2000) Reach, W. T., Boulanger, F., Contursi, A., & Lequeux, J. 2000, A&A, 361, 895
- Reach et al. (2006) Reach, W. T., et al. 2006, AJ, 131, 1479
- Rieke et al. (2009) Rieke, G. H., Alonso-Herrero, A., Weiner, B. J., Pérez-González, P. G., Blaylock, M., Donley, J. L., & Marcillac, D. 2009, ApJ, 692, 556
- Rigby et al. (2009) Rigby, J. R., Diamond-Stanic, A. M., & Aniano, G. 2009, ApJ, 700, 1878
- Roche et al. (1991) Roche, P. F., Aitken, D. K., Smith, C. H., & Ward, M. J. 1991, MNRAS, 248, 606
- Roussel et al. (2007) Roussel, H., et al. 2007, ApJ, 669, 959
- Roseboom et al. (2009) Roseboom, I. G., Oliver, S., & Farrah, D. 2009, ApJ, 699, L1
- Sandage & Tammann (1987) Sandage, A., & Tammann, G. A. 1987, A Revised Shapley–Ames Catalog of Bright Galaxies (2nd ed. Washington, DC: Carnegie Institution of Washington)
- Schutte et al. (1993) Schutte, W. A., Tielens, A. G. G. M., & Allamandola, L. J. 1993, ApJ, 415, 397
- Schweitzer et al. (2006) Schweitzer, M., et al. 2006, ApJ, 649, 79
- Shi et al. (2007) Shi, Y., et al. 2007, ApJ, 669, 841
- Shi et al. (2009) Shi, Y., Rieke, G. H., Ogle, P., Jiang, L., & Diamond-Stanic, A. M. 2009, ApJ, 703, 1107
- Smith et al. (2007a) Smith, J. D. T., et al. 2007, ApJ, 656, 770
- Smith et al. (2007b) Smith, J. D. T., et al. 2007, PASP, 119, 1133
- Sturm et al. (2002) Sturm, E., Lutz, D., Verma, A., Netzer, H., Sternberg, A., Moorwood, A. F. M., Oliva, E., & Genzel, R. 2002, A&A, 393, 821
- Szczepanski & Vala (1993) Szczepanski, J., & Vala, M. 1993, ApJ, 414, 646
- Tacconi-Garman et al. (2005) Tacconi-Garman, L. E., Sturm, E., Lehnert, M., Lutz, D., Davies, R. I., & Moorwood, A. F. M. 2005, A&A, 432, 91
- Tappe et al. (2006) Tappe, A., Rho, J., & Reach, W. T. 2006, ApJ, 653, 267
- Tielens (2005) Tielens, A. G. G. M. 2005, The Physics and Chemistry of the Interstellar Medium (Cambridge: Cambridge Univ. Press)
- Tielens (2008) Tielens, A. G. G. M. 2008, ARA&A, 46, 289
- Vega et al. (2010) Vega, O., et al. 2010, ApJ, in press, arXiv:1008.0009
- Vermeij et al. (2002) Vermeij, R., Peeters, E., Tielens, A. G. G. M., & van der Hulst, J. M. 2002, A&A, 382, 1042
- Voit (1992) Voit, G. M. 1992, MNRAS, 258, 841
- Wall & Jenkins (2003) Wall, J. V. & Jenkins, C. R. 2003, Practical Statistics for Astronomers (Cambridge: Cambridge Univ. Press)
- Werner et al. (2004) Werner, M. W., et al. 2004, ApJS, 154, 1
| NAME | 6.2 m | 7.7 maaConsists of sub-features at 7.42, 7.60, and 7.85 m. | 8.6 m | 11.3 mbbConsists of sub-features at 11.23 and 11.33 m. | 12.7 mccConsists of sub-features at 12.62 and 12.69 m. | [Ne ii] | H2 S(3) |
|---|---|---|---|---|---|---|---|
| IC3639 | 1.150.05e-06 | 5.190.79e-06 | 3.410.54e-07 | 1.380.05e-06 | 4.940.54e-07 | 3.110.05e-07 | 4.450.79e-08 |
| NGC1058 | 1.470.10e-07 | 4.810.64e-07 | 9.520.69e-08 | 1.910.06e-07 | 9.120.88e-08 | 9.001.09e-09 | 5.221.28e-09 |
| NGC1097 | 9.240.31e-07 | 3.690.19e-06 | 6.900.22e-07 | 1.480.03e-06 | 8.070.21e-07 | 1.540.02e-07 | 8.360.68e-08 |
| NGC1241 | 5.380.83e-07 | 1.950.44e-06 | 3.500.44e-07 | 5.860.71e-07 | 2.670.35e-07 | 7.890.48e-08 | 3.651.61e-08 |
| NGC1365 | 4.770.07e-06 | 1.980.05e-05 | 3.100.05e-06 | 3.850.04e-06 | 3.000.06e-06 | 5.120.05e-07 | 1.110.07e-07 |
| NGC1433 | 3.580.25e-07 | 8.931.79e-07 | 2.500.18e-07 | 6.080.15e-07 | 2.660.23e-07 | 4.960.21e-08 | 3.340.62e-08 |
| NGC1566 | 8.120.25e-07 | 3.160.14e-06 | 5.140.20e-07 | 1.060.01e-06 | 4.870.18e-07 | 7.460.20e-08 | 5.010.32e-08 |
| NGC2273 | 2.540.03e-06 | 9.230.14e-06 | 1.450.02e-06 | 2.690.03e-06 | 1.080.02e-06 | 3.200.03e-07 | 1.040.04e-07 |
| NGC2639 | 9.290.97e-08 | 2.130.61e-07 | 4.190.66e-08 | 1.340.05e-07 | 8.020.71e-08 | 7.550.09e-08 | 1.470.13e-08 |
| NGC2992 | 1.550.05e-06 | 6.820.35e-06 | 8.240.36e-07 | 1.560.03e-06 | 7.800.43e-07 | 3.490.04e-07 | 5.990.52e-08 |
| NGC3079 | 1.820.03e-05 | 7.320.08e-05 | 1.190.03e-05 | 1.150.03e-05 | 6.680.07e-06 | 9.660.10e-07 | 5.040.26e-07 |
| NGC3185 | 1.110.05e-06 | 3.510.26e-06 | 6.990.40e-07 | 1.000.04e-06 | 4.570.34e-07 | 7.560.36e-08 | 4.190.98e-08 |
| NGC3227 | 2.910.03e-06 | 9.990.15e-06 | 1.240.01e-06 | 3.240.03e-06 | 1.350.01e-06 | 5.170.05e-07 | 2.030.03e-07 |
| NGC3735 | 5.920.42e-07 | 3.390.34e-06 | 5.610.28e-07 | 7.590.30e-07 | 4.470.38e-07 | 5.840.37e-08 | 2.440.69e-08 |
| NGC4051 | 8.840.54e-07 | 4.420.31e-06 | 3.960.32e-07 | 1.120.03e-06 | 5.670.52e-07 | 1.040.06e-07 | 8.090.77e-08 |
| NGC4258 | 3.400.07e-07 | 1.450.07e-06 | 1.360.04e-07 | 3.380.03e-07 | 1.600.06e-07 | 7.430.07e-08 | 6.580.14e-08 |
| NGC4501 | 1.090.05e-07 | 3.510.35e-07 | 8.020.37e-08 | 3.050.04e-07 | 1.500.03e-07 | 4.150.04e-08 | 6.370.25e-08 |
| NGC4639 | 9.150.56e-08 | 2.330.30e-07 | 3.470.35e-08 | 1.670.03e-07 | 6.650.52e-08 | 9.470.57e-09 | 9.220.69e-09 |
| NGC4945 | 7.990.08e-05 | 3.800.04e-04 | 3.910.04e-05 | 2.510.03e-05 | 2.810.03e-05 | 5.590.06e-06 | 3.240.71e-08 |
| NGC5005 | 1.400.06e-06 | 5.390.31e-06 | 1.200.04e-06 | 3.380.05e-06 | 1.260.03e-06 | 3.270.04e-07 | 4.130.22e-07 |
| NGC5033 | 6.040.40e-07 | 2.250.25e-06 | 4.070.21e-07 | 1.100.03e-06 | 5.770.19e-07 | 1.230.03e-07 | 4.000.57e-08 |
| NGC5135 | 5.650.06e-06 | 2.070.02e-05 | 3.620.04e-06 | 4.760.05e-06 | 2.580.03e-06 | 8.040.08e-07 | 1.220.04e-07 |
| NGC5194 | 2.570.32e-07 | 6.231.25e-07 | 1.120.19e-07 | 6.820.16e-07 | 2.850.17e-07 | 1.680.02e-07 | 1.320.09e-07 |
| NGC5395 | 6.690.43e-08 | 2.450.34e-07 | 4.140.38e-08 | 1.220.05e-07 | 5.880.45e-08 | 4.440.50e-09 | 6.121.16e-09 |
| NGC5427 | 2.230.06e-07 | 1.120.06e-06 | 1.490.05e-07 | 2.680.04e-07 | 1.430.08e-07 | 4.030.06e-08 | 1.320.11e-08 |
| NGC5643 | 1.100.09e-06 | 4.320.87e-06 | 4.271.17e-07 | 1.930.09e-06 | 9.621.02e-07 | 1.660.10e-07 | 7.282.05e-08 |
| NGC5728 | 9.910.23e-07 | 5.030.17e-06 | 7.190.17e-07 | 2.100.02e-06 | 8.190.17e-07 | 2.180.07e-07 | 1.550.07e-07 |
| NGC6221 | 9.070.09e-06 | 3.020.03e-05 | 4.920.05e-06 | 6.500.07e-06 | 3.880.05e-06 | 1.770.02e-06 | 1.620.09e-07 |
| NGC6951 | 1.870.05e-06 | 6.390.26e-06 | 1.300.04e-06 | 2.040.06e-06 | 9.540.29e-07 | 2.440.04e-07 | 8.031.14e-08 |
| NGC7130 | 2.710.05e-06 | 1.080.03e-05 | 1.710.05e-06 | 2.480.06e-06 | 1.370.06e-06 | 5.210.07e-07 | 6.381.11e-08 |
| NGC7314 | 1.710.23e-07 | 1.200.17e-06 | 1.090.17e-07 | 2.570.11e-07 | 1.330.14e-07 | 6.410.15e-08 | 2.500.36e-08 |
| NGC7469 | 8.230.08e-06 | 2.930.06e-05 | 4.280.04e-06 | 5.410.05e-06 | 3.290.07e-06 | 1.160.01e-06 | 1.320.05e-07 |
| NGC7496 | 2.180.05e-06 | 6.480.25e-06 | 1.150.03e-06 | 1.420.03e-06 | 7.300.32e-07 | 2.770.04e-07 | 6.140.93e-08 |
| NGC7582 | 2.260.05e-06 | 8.550.26e-06 | 2.580.04e-06 | 4.100.04e-06 | 1.550.03e-06 | 3.600.04e-07 | 1.370.10e-07 |
| NGC7590 | 3.010.57e-07 | 1.190.31e-06 | 2.720.36e-07 | 4.490.48e-07 | 1.950.29e-07 | 2.720.30e-08 | 2.181.10e-08 |
Note. — Measurements are in units of W m-2 sr-1.
| NAME | RA | Dec | 6.2 m | 7.7 maaConsists of sub-features at 7.42, 7.60, and 7.85 m. | 8.6 m | 11.3 mbbConsists of sub-features at 11.23 and 11.33 m. | 12.7 mccConsists of sub-features at 12.62 and 12.69 m. |
|---|---|---|---|---|---|---|---|
| IC3639 | 12:40:53.13 | 36:45:10.3 | 4.240.32e-07 | 1.630.22e-06 | 1.940.28e-07 | 2.840.20e-07 | 1.630.32e-07 |
| NGC1097 | 02:46:19.06 | 30:16:20.0 | 4.260.07e-06 | 1.390.04e-05 | 2.630.05e-06 | 2.860.05e-06 | 1.620.03e-06 |
| NGC1365 | 03:33:36.71 | 36:08:18.0 | 8.530.09e-06 | 3.370.04e-05 | 6.680.08e-06 | 6.240.07e-06 | 4.150.05e-06 |
| NGC1566 | 04:20:02.13 | 54:56:37.1 | 2.690.18e-07 | 8.331.14e-07 | 1.160.13e-07 | 1.330.10e-07 | 7.921.39e-08 |
| NGC2992 | 09:45:42.07 | 14:19:29.4 | 1.050.10e-06 | 3.590.75e-06 | 6.480.84e-07 | 9.311.03e-07 | 6.070.47e-07 |
| NGC3079 | 10:01:57.49 | +55:40:58.5 | 2.610.10e-06 | 9.020.30e-06 | 1.580.09e-06 | 1.800.08e-06 | 9.900.27e-07 |
| NGC3227 | 10:23:30.87 | +19:51:43.1 | 1.040.08e-07 | 4.360.43e-07 | 7.230.46e-08 | 1.510.07e-07 | 7.300.49e-08 |
| NGC4258 | 12:18:59.31 | +47:18:24.8 | 4.440.05e-07 | 1.440.02e-06 | 2.600.03e-07 | 2.870.03e-07 | 1.510.04e-07 |
| NGC4501 | 12:32:00.42 | +14:25:25.2 | 2.970.08e-07 | 1.090.03e-06 | 1.920.05e-07 | 2.430.06e-07 | 1.330.04e-07 |
| NGC4945 | 13:05:28.26 | 49:27:39.6 | 2.240.06e-06 | 7.690.11e-06 | 1.610.07e-06 | 1.720.06e-06 | 9.130.19e-07 |
| NGC5005 | 13:10:56.89 | +37:03:24.8 | 4.870.65e-07 | 1.980.50e-06 | 3.280.32e-07 | 4.590.25e-07 | 2.710.34e-07 |
| NGC5033 | 13:13:27.87 | +36:35:25.6 | 9.140.28e-07 | 3.470.15e-06 | 6.730.34e-07 | 7.550.23e-07 | 4.720.21e-07 |
| NGC5135 | 13:25:44.60 | 29:50:08.6 | 1.900.13e-07 | 8.020.97e-07 | 1.310.09e-07 | 2.240.07e-07 | 1.270.25e-07 |
| NGC5194 | 13:29:50.36 | +47:11:36.0 | 7.640.25e-07 | 2.820.11e-06 | 4.080.24e-07 | 5.820.19e-07 | 3.600.20e-07 |
| NGC5395 | 13:58:38.82 | +37:25:38.2 | 2.490.04e-07 | 8.210.31e-07 | 1.470.04e-07 | 1.610.03e-07 | 8.410.56e-08 |
| NGC5427 | 14:03:26.11 | 06:01:43.2 | 2.640.07e-07 | 1.020.05e-06 | 1.870.05e-07 | 2.240.04e-07 | 1.240.07e-07 |
| NGC6221 | 16:52:46.03 | 59:13:08.8 | 1.050.04e-06 | 3.040.19e-06 | 6.220.25e-07 | 1.210.04e-06 | 6.460.31e-07 |
| NGC7130 | 21:48:19.38 | 34:56:56.1 | 1.310.03e-06 | 4.350.13e-06 | 8.070.25e-07 | 1.030.03e-06 | 5.140.14e-07 |
| NGC7314 | 22:35:46.89 | 26:03:13.7 | 1.110.13e-07 | 4.551.01e-07 | 8.011.30e-08 | 1.000.10e-07 | 5.261.40e-08 |
| NGC7582 | 23:18:22.64 | 42:21:57.7 | 4.140.29e-07 | 1.820.19e-06 | 2.290.24e-07 | 3.360.18e-07 | 1.760.31e-07 |
| NGC7590 | 23:18:55.05 | 42:14:28.0 | 5.190.53e-07 | 1.780.37e-06 | 2.810.29e-07 | 3.580.22e-07 | 1.790.29e-07 |
Note. — Measurements are in units of W m-2 sr-1.
| ratio | Seyferts v. SINGS | Seyferts v. off nuclear | SINGS v. off nuclear |
|---|---|---|---|
| 6/11 | 0.682 | ||
| 7/11 | 0.003 | 0.001 | 0.074 |
| 8/11 | 0.063 | ||
| 6/7 | 0.230 | 0.447 | 0.888 |
| 6/8 | 0.489 | 0.347 | 0.689 |
| 7/8 | 0.108 | 0.303 | 0.374 |
Note. — Values correspond to probabilities from two-sample K-S tests.