Variations of the spectral index of dust emissivity from Hi-GAL observations of the Galactic plane††thanks: Herschel is an ESA space observatory with science instruments provided by European-led Principal investigator consortia and with important participation from NASA.
Abstract
Context. Variations in the dust emissivity are critical for gas mass determinations derived from far-infrared observations, but also for separating dust foreground emission from the Cosmic Microwave Background (CMB). Hi-GAL observations allow us for the first time to study the dust emissivity variations in the inner regions of the Galactic plane at resolution below 1.
Aims. We present maps of the emissivity spectral index derived from the combined Herschel PACS 160 , SPIRE 250 , 350 , and 500 data, and the IRIS 100 data, and we analyze the spatial variations of the spectral index as a function of dust temperature and wavelength in the two Science Demonstration Phase Hi-GAL fields, centered at l=30 and l=59.
Methods. Applying two different methods, we determine both dust temperature and emissivity spectral index between 100 and 500 , at an angular resolution () of 4′.
Results. Combining both fields, the results show variations of the emissivity spectral index in the range 1.8-2.6 for temperatures between 14 and 23 K. The median values of the spectral index are similar in both fields, i.e. 2.3 in the range 100-500 , while the median dust temperatures are equal to 19.1 K and 16.0 K in the l=30 and l=59 field, respectively. Statistically, we do not see any significant deviations in the spectra from a power law emissivity between 100 and 500 . We confirm the existence of an inverse correlation between the emissivity spectral index and dust temperature, found in previous analyses.
Key Words.:
ISM:dust, extinction - Infrared: ISM1 Introduction
The large dust grains(big grain component as defined in Désert et al., 1990) dominate the total dust mass, as well as the observed emission in the far-infrared (FIR) domain (Draine Li, 2007). They radiate in thermal equilibrium with the interstellar radiation field, and their emission spectrum, assuming a fixed dust abundance and a single grain size, is well approximated by
| (1) |
where is the specific intensity or brightness, is the Planck function, Td is the dust temperature, is the emissivity at wavelength , and is the emissivity spectral index.
Previous observations in the submillimeter (submm), at arcminute resolution, such as those by the balloon-borne experiments PRONAOS (Dupac et al., 2003) and ARCHEOPS (Désert et al., 2008) found evidence of an inverse relationship between Td and in various environments of the interstellar medium (ISM). In PRONAOS data, variations of the spectral index were observed in the range 2.4 to 0.8 for dust temperatures between 11 and 80 K, whereas ARCHEOPS data showed a more pronounced inverse relationship with values going from 4 to 1 between 7 and 27 K. Recently Veneziani et al. (2010) highlighted a similar trend analyzing Td and for eight high Galactic latitude clouds, by combining IRAS, DIRBE, and WMAP data with BOOMERanG observations. The values vary from 5 to 1 in the temperature range 7-20 K, with a behavior similar to that derived from ARCHEOPS data. These variations of with dust temperature could be owing to intrinsic properties of amorphous dust grains, as proposed by Mény et al. (2007), but the impact of the noise and the temperature mixing along the line of sight (LOS) must be carefully taken into consideration, before a physical interpretation can be made.Variations of the apparent spectral index in a sample of cores in the Galactic plane have been observed (Hill et al., 2006) using SCUBA and SIMBA. However, because of the restricted wavelength range of their observations, these authors could not attribute them to temperature variations.
Moreover, none of the previous analyses allowed the study of the correlation at arcminute scales in the inner regions of the Galactic plane. Thanks to the Herschel Hi-GAL data (, 22 maps, centered in the Galactic plane at l=30 and l=59, see Molinari et al., 2010a, b), we can now extend for the first time this type of analysis to the inner Galactic plane, and on continuous fields of diffuse emission. An overview of the Herschel instruments is given in Pilbratt et al. (2010). In this paper we analyze emissivity variations between 100 and 500 . We then derive both the dust temperature and spectral index from Eq. (1), assuming a single temperature along the LOS. This assumption is relatively correct for the l=59 field, where there is less contamination along the LOS in comparison with the l=30 field. Indeed, the LOS toward the inner l=30 field crosses several regions with a presumably wider range of temperatures. An accurate temperature determination requires sampling both sides of the emission peak. The 70 brightness is generally contaminated by out-of-equilibrium emission from very small grains (VSGs) and cannot be used to derive thermal dust temperature without an accurate subtraction of this component. This contribution has been investigated by Compiegne et al. (2010). Therefore we include the IRAS data at 100 in our analysis, for which we estimate an average VSG contamination of less than 10. This implies degrading the original resolution of the Hi-GAL data by adopting the IRAS angular resolution of 4′. We note, as a consequence, an averaging effect within the resolution element, which also needs to be taken into account in the interpretation of the results of the present analysis.
One of the key aspects in the analysis of CMB is the ability to separate its emission from the other astrophysical foregrounds (including thermal dust) through multifrequency observations. While it is not easy to achieve successful component separation over the Galactic plane, determining the dust spectral index variations across the sky can efficiently help in reducing the number of unknowns in the problem (Ricciardi et al., 2010).
2 Data
We use the ROMAGAL Herschel PACS and SPIRE maps described in Traficante et al. (2010), combined with the IRIS (Improved Reprocessing of the IRAS Survey, see Miville-Deschênes Lagache, 2005) 100 data. Multiplicative factors (0.78,1.02, 1.05 and 0.94 at 160, 250, 350 and 500 , respectively) have been applied to the data (Poglitsch et al., 2010; Griffin et al., 2010; Swinyard et al., 2010). An absolute calibration accuracy of 20 and 15 for PACS and SPIRE has been adopted. We applied the offsets given in Bernard et al. (2010) 111see their Table 1. All maps have been convolved with a Gaussian kernel, with a FWHM of 4′, i.e. equal to the IRIS 100 angular resolution. In addition, the maps have been rebinned on a uniform grid with a pixel size of 1.65′. The IRIS 100 calibration uncertainty is taken to be 13.5 (see Miville-Deschênes Lagache, 2005).
3 Variations of the emissivity spectral index with temperature
We use two different methods for the simultaneous derivation of the dust temperature and the emissivity spectral index. Both allow us to fit the data with a modified blackbody function (see Eq. 1). In the first method we perform an minimization, applying the same code as described in Dupac et al. (2001), using the IDL least-square fit curvefit function to deduce the Td and parameters, as well as their 1 uncertainties. The second method estimates the best-fit parameters by looking for the maximum likelihood, using a Monte Carlo Markov Chain (MCMC) algorithm (Lewis Bridle, 2002) and represents a bayesian approach to parameter estimation. The posterior distribution for the parameters is sampled by using the Metropolis-Hastings algorithm, and a maximum likelihood estimate is derived jointly for and . We chose a wide flat a priori probablity density of the parameters, i.e. 0 K60 K and -15, in order not to constrain the fit results. A benefit of this method is that it also recovers the joint posterior distribution of the two estimated parameters. We make use of this feature to explore the - correlation as explained below.
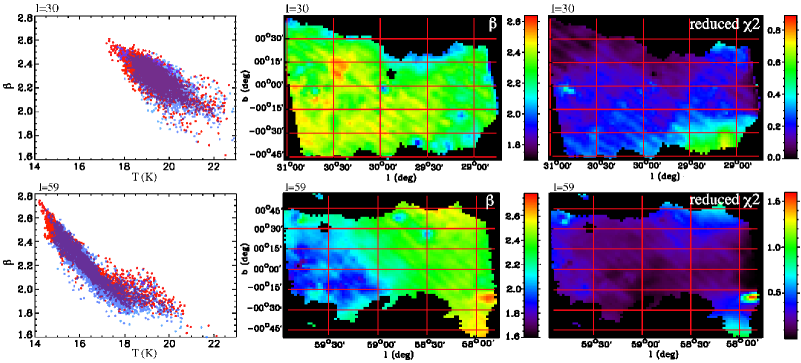
We fit the spectral energy distribution (SED) between 100 and 500 for each pixel of the maps, using both methods. The color correction is computed iteratively in all channels. Results of the Td- determination for each field are shown in Fig. 1. Only pixels with a surface brightness at 500 higher than 105 MJy/sr and 50 MJy/sr for the l=30 and l=59 fields, respectively, have been considered. Both methods show a clear anti-correlation Td- in each field. These two independent methods also highlight a good agreement. The values range from to for temperatures between 17.5-23 K for the l=30 field, and from to , between 14 and 21 K, for the l=59 field. The assumption made of a single temperature along the LOS may hold in the l=59 field, but is certainly too simplistic for the l=30 field, since temperature variations along the LOS are larger in the inner field (see Bernard et al., 2010). The analysis of the l=30 field would certainly require an accurate combination of temperatures and column densities. However, our methods do not allow the simultaneous fitting of a complex mixture of spectra. Even if the l=30 field is potentially characterized by several grain temperatures along the LOS (associated to Sagittarius, Scuttum-Crux and Perseus, as described in Bernard et al., 2010), and therefore could induce a spurious Td- inverse correlation (Masi et al., 1995; Shetty et al., 2009), the l=59 field, less contaminated by various dust mixing effects, still highlights a pronounced behavior in the Td- parameter space. Both fields, with a different mixture of temperatures, present a Td- anti-correlation. We therefore interpret this as an indication that the mixture of temperatures is probably not the dominant responsible effect for the observed anti-correlation.
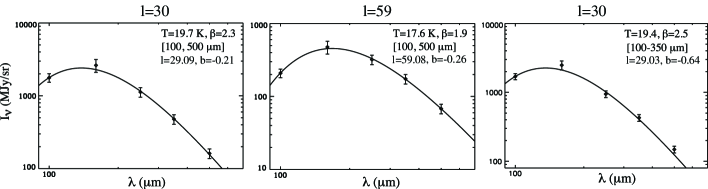
The spatial distribution of is shown in Fig. 1. Warmer regions, which most often correspond to bright regions, show lower beta values. However, the l=59 field presents a gradient along the East-West direction, which is not observed in the PACS or SPIRE surface brightness maps. The stripes visible in the maps are associated to low-level residual stripes in the IRIS data. In the l=59 field, values higher than 2.6 located at l=5748′, b=-020′ correspond to one of the less active star-forming regions, although the PACS 160 data show an artifact at this location, disclosed by a high (see Fig. 1). In the same field, the lowest values () are found for an HII region, with a bright source nearby at l=5938′, b=+038′. Representative examples of SEDs with a gray-body fit are presented in Fig. 2, illustrating the agreement between the data and the model.
The two parameters Td- are degenerate in the parameter space,
creating a spurious inverse relation (Shetty et al., 2009) that has to be considered while
investigating if an intrinsic physical correlation indeed exists. In
order to properly estimate the relationship between Td and
, we have to take into account
the correlation that is shown by the spectral shape in
Eq. (1) and caused by calibration uncertainties. One way to include the effect of the degeneracy is
to estimate this effect not only for the Td- best-fit values but for
points included in the 68 contours of the two-dimensional posterior
probability obtained with the MCMC method. Within the 68 contours
the points are not uniformly distributed, but their density is higher
close to the maximum of the probability, increasing their weight, and lower close to the boundaries.
Assuming the model , between 100 and 500 in both fields,
the fit is then performed on all the Td- couples inside
a posteriori probability contour of each pixel, chosen randomly, one for each pixel and weighted as described.
We then take a point within the contour for each pixel of the map and
fit the trend to estimate the A and parameters. We repeat
this procedure until we obtain a good sampling of the shape of the
distribution of posterior probabilities. This method has been
successfully tested on BOOMERanG data (Veneziani et al., 2010) and allows
us to include the effects of degeneracy in the error bars. The
resulting A and ditributions are well approximated by
Gaussian functions, even if a slight asymmetry is present. The center of the Gaussian is the more likely value, while the error is estimated by marginalizing over the other parameter.
The best-fit values so obtained are
| (2) |
| (3) |
Figure 3 shows the results of the fitting method over the probability contours with only a few pixels out of contours for clarity. The best-fit Hi-GAL Td- relation is plotted, as well as the ARCHEOPS, BOOMERanG, and PRONAOS ones for comparison.
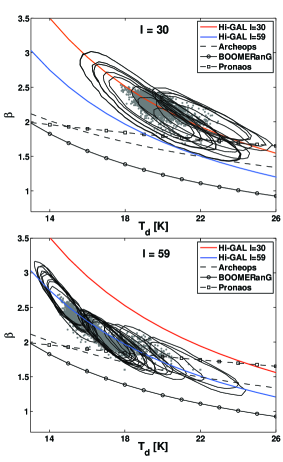
Our results highlight a steeper Td- law in the inner Galactic plane in both fields than in external regions and high latitude clouds observed with ARCHEOPS and BOOMEranG. Whereas the wavelength range covered by PRONAOS is almost the same as that of Herschel, the Td- relation () is flatter, with values going from 2.0 to 1.7, in the range 13-26 K. These results could indicate different dust properties in the inner Galactic plane, as compared to the outer galaxy observed with ARCHEOPS, the solar neighborhood observed with PRONAOS, and high latitude clouds observed with BOOMEranG. We therefore think that these different Td- relations could be caused by changes in dust properties with the environments.
4 Variations of the emissivity spectral index with wavelength
In the previous section we have found evidence of spectral index variations with temperature. As predicted by Mény et al. (2007), a flattening of the emissivity spectrum (and so a lower ) is expected for wavelengths longer than 500 as a consequence of the internal structure of the grains. Recently, Gordon et al. (2010) highlighted an emission excess at 500 in the Large Magellanic Cloud that could be of the same origin. However, this excess is of about 10, which is lower than the SPIRE calibration uncertainties of 15. The Herschel data do not allow us to study emissivity variations at longer wavelengths than 500 .
Although the SEDs in each field (left and central panel of Fig. 2) do not provide evidence for any departures from a power law, we analyze the possibility of an emissivity excess at 500 . To properly perform this study, the temperature estimates need to be done independently of the 500 data. Therefore we have redone the Td and determination with the least-square fit method using only data between 100 and 350 , and we compare the emission at 500 with the value predicted by extrapolating the emissivity power law between 100 and 350 . The predicted values are systematically lower than the data at 500 in both fields, by 16 in l=30 and 13 in l=59, which could favor the hypothesis of an emissivity excess at this wavelength. These values are not significant compared to the uncertainties on the SPIRE data. Moreover, we suspect that the PACS 160 data suffer from calibration issues, as discussed in Bernard et al. (2010). The calibration uncertainty at 160 does not impact the results of the global analysis described above, but here the limitation of the wavelength range (100-350 ) removes some constraints on the fit, resulting in an overestimate with respect to the data at 250 , and an underestimate at 500 (see Fig. 2, right panel). However, if we slightly shift down the 160 data points, the apparent underestimate at 500 would disappear. For this reason, we do not claim that this excess is real and we think instead that the emissivity spectra are relatively constant between 100 and 500 with similar median values in both fields, i.e. 2.3, even if the median temperature is statistically lower in the l=59 field (T K for l=30 and T K for l=59).
5 Conclusions
We investigated variations in the spectral index of the dust emissivity, with temperature and wavelength, in the inner Galactic plane, using the new Herschel observations in two Hi-GAL fields, centered at l=30 and l=59, acquired during the Herschel Science Demonstration phase, combined with the IRIS 100 data. We fitted the SEDs for each pixel of the two fields with two independent methods, deriving simultaneously the emissivity spectral index and the dust temperature by adjusting a modified blackbody function to the data. The results are similar with both methods. Using a Monte Carlo Markov Chain algorithm method we computed the 68 likelihood contours for each point. We find a Td- inverse correlation, with the local variation going from 1.8 to 2.6 for temperatures between 14 and 23 K, shown for the first time in the inner Galactic plane. Moreover, our results indicate a different trend with respect to previous investigations based on BOOMERanG, ARCHEOPS, and PRONOAS data, probably because of different dust properties in the inner Galactic plane compared to other environments. An extensive follow-up analysis will be required to take into consideration the mixture of temperatures along the line of sight. The median value of is similar in both fields, equal to 2.3, slightly higher than the usual reference value of 2. We do not favor the hypothesis of an emissivity excess at 500 , as suggested for the Large Magellanic Cloud. A complementary forthcoming study will combine Planck with Herschel data to investigate possible changes in the dust emissivity spectrum at wavelengths larger than 500 , as reported in previous studies of dust emission in our Galaxy.
6 Acknowledgments
Data processing and maps production have been possible thanks to ASI generous support via contract I/038/080/0. M.V. is grateful to Davide Pietrobon for software support.
References
- Bernard et al. (2010) Bernard, J.-P., Paradis, D., Marshall, D., et al. 2010, AA, 518L, 88
- Compiegne et al. (2010) Compiegne, M., Flagey, N., Noriega-Crespo, et al. 2010, ApJ, submitted
- Désert et al. (1990) Désert, F.-X., Boulanger, F., Puget, J. L. 1990, AA, 237, 215
- Désert et al. (2008) Désert, F.-X., Macías-Pérez, J. F., Mayet, F., et al. 2008, AA, 481, 411
- Draine Li (2007) Draine, B. T. Li, A. 2007, ApJ, 657, 810
- Dupac et al. (2001) Dupac, X., Giard, M., Bernard, J.-Ph., et al. 2001, ApJ, 553, 604
- Dupac et al. (2003) Dupac, X., Bernard, J.-Ph., Boudet, N., et al. 2003, AA, 404, L11
- Gordon et al. (2010) Gordon, K., Galliano, F., Hony, S., et al. 2010, AA, 518L, 89
- Griffin et al. (2010) Griffin, M., Abergel, A., Abreu, A., et al. 2010, AA, 518, L3
- Hill et al. (2006) Hill, T., Thompson, M. A., Burton, M. G., et al. 2006, MNRAS, 368, 1223
- Lewis Bridle (2002) Lewis, A., Bridle, S. 2002, Phys. Rev., 66, 103511
- Masi et al. (1995) Masi, S., Aquilini, E., Boscaleri, A., et al. 1995, ApJ, 452, 253
- Mathis et al. (1983) Mathis, J. S., Mezger, P. G., Panagia, N. 1983, AA, 128,212
- Mény et al. (2007) Mény, C., Gromov, V., Boudet, N., et al. 2007, AA, 468, 171
- Miville-Deschênes Lagache (2005) Miville-Deschênes, M. A., Lagache, G. 2005, ApJS, 157, 302
- Molinari et al. (2010a) Molinari, S., Swinyard, B., Bally, J., et al. 2010, PASP, 122, 314
- Molinari et al. (2010b) Molinari, S, Swinyard, B., Bally, J., et al. 2010, AA, 518L, 100
- Pilbratt et al. (2010) Pilbratt, G., Riedinger, J. R., Passvogel, T., et al. 2010, AA, 518, L1
- Poglitsch et al. (2010) Poglitsch, A., Waelkens, A., Geis, N., et al. 2010, AA, 518, L2
- Ricciardi et al. (2010) Ricciardi, S., Bonaldi, A., Natoli, P. et al. 2010, MNRAS, arXiv:1006.2326
- Shetty et al. (2009) Shetty, R., Kauffmann, J., Schnee, S., et al. 2009, ApJ, 696, 2234
- Stepnik et al. (2003) Stepnik, B., Abergel, A., Bernard, J. P., et al. 2003, AA, 398, 551
- Swinyard et al. (2010) Swinyard, B. M., Ade, P., Baluteau, J. P., et al. 2010, AA, 518L, 4
- Traficante et al. (2010) Traficante, A., Calzoletti, L., Veneziani, M., et al. 2010, AA, submitted
- Veneziani et al. (2010) Veneziani, M., Ade, P. A. R., Bock, J. J., et al. ApJ, 2010, 713, 959