Ultra-Compact Dwarfs in the Core of the Coma Cluster 11affiliation: Based on observations made with the NASA/ESA Hubble Space Telescope, obtained at the Space Telescope Science Institute, which is operated by the Association of Universities for Research in Astronomy, Inc., under NASA contract NAS5-26555. These observations are associated with program 10861.
Abstract
We have discovered both a red and a blue subpopulation of Ultra-Compact Dwarf (UCD) galaxy candidates in the Coma galaxy cluster. We analyzed deep F475W (Sloan ) and F814W (I) Hubble Space Telescope images obtained with the Advanced Camera for Surveys Wide Field Channel as part of the Coma Cluster Treasury Survey and have fitted the light profiles of 5000 point-like sources in the vicinity of NGC 4874 — one of the two central dominant galaxies of the Coma cluster. Although almost all of these sources are globular clusters that remain unresolved, we found that 52 objects have effective radii between 10 and 66 pc, in the range spanned by Dwarf Globular Transition Objects (DGTO) and UCDs. Of these 52 compact objects, 25 are brighter than mag, a magnitude conventionally thought to separate UCDs and globular clusters. The UCD/DGTO candidates have the same color and luminosity distribution as the most luminous globular clusters within the red and blue subpopulations of the immensely rich NGC 4874 globular cluster system. Unlike standard globular clusters, blue and red UCD/DGTO subpopulations have the same median effective radius. The spatial distribution of UCD/DGTO candidates reveal that they congregate towards NGC 4874, and are not uniformly distributed. We find a relative deficit of UCD/DGTOs compared with globular clusters in the inner 15 kpc around NGC 4874, however at larger radii UCD/DGTO and globular clusters follow the same spatial distribution.
Subject headings:
galaxies: star clusters - galaxies: elliptical and lenticular, cD - globular clusters: general1. Introduction
Within galaxy clusters, cD galaxies are swarming with tens of thousands of globular clusters. Like most galaxies with rich Globular Cluster Systems (GCS), the cD galaxies of Virgo (M87: Peng et al. 2009; Harris 2009b) and Fornax (NGC 1399: Dirsch et al. 2003) display evident bimodality in their color distribution. Bimodal fits to the GCS around NGC 3311, the central cD galaxy of the Hydra galaxy cluster, also reveal the presence of a red (metal-rich) and a blue (metal-poor) subpopulation (Wehner et al. 2008). Six additional giant elliptical galaxies studied by Harris (2009a) also show clear bimodality.
In the analysis of the color-magnitude diagram (CMD) of the NGC 3311 GCS, Wehner & Harris (2007; their Figure 1) find an ”upward” extension towards brighter magnitudes of the red subpopulation. This continuation to brighter magnitudes (and higher masses) is absent among the blue subpopulation. Wehner & Harris (2007) postulate that given their magnitudes ( mag) and inferred masses (), the extension of the CMD corresponds to Ultra-Compact Dwarfs (UCDs, Phillipps et al. 2001). While Wehner & Harris (2007) suggest that UCDs are the bright extension of the GCS, the ground-based data used for their work do not allow them to derive characteristic radii for their UCD candidates. Peng et al. (2009) over-plotted 18 objects with extended effective radii ( pc) on their CMD of the M87 GCS. Some of these objects are confirmed UCDs or Dwarf/Globular Transition Objects (Hasegan et al. 2005) and most of them lie exactly at the bright end of the blue subpopulation of globular clusters.
Ultra-compact dwarfs are a relatively newly discovered class of stellar system (Hilker et al. 1999; Drinkwater et al. 2000) and their origin is not yet clearly established. In color, and structural parameters, UCDs lie between supermassive globular clusters and compact dwarf elliptical galaxies. Not surprisingly, the origin of UCDs has been linked to both globular clusters and dwarf elliptical galaxies (Hilker 2006, and references therein). UCDs are typically associated with galaxy clusters and were originally identified in the Fornax cluster (Hilker et al. 1999; Drinkwater et al. 2000, 2003). Subsequently, the presence of UCDs was reported in several additional galaxy clusters: Virgo, Centaurus, Hydra, Abell S040 and Abell 1689 (Evstigneeva et al. 2008; Chilingarian & Mamon 2008; Mieske et al. 2004, 2007; Wehner & Harris 2007; Blakeslee & Barber DeGraaff 2008). However, Romanowsky et al. (2009) report the presence of UCDs in the galaxy group hosting NGC 1407. Most recently, a spectroscopically confirmed UCD in the low density environment surrounding the Sombrero Galaxy was discovered by Hau et al. (2009). UCDs are difficult to find since they are often mistaken for stars, or simply bright globular clusters, and their structural parameters can only be derived using the Hubble Space Telescope. The formation of UCDs and possible links between UCDs and globular clusters (either red or blue) remains a subject of debate.
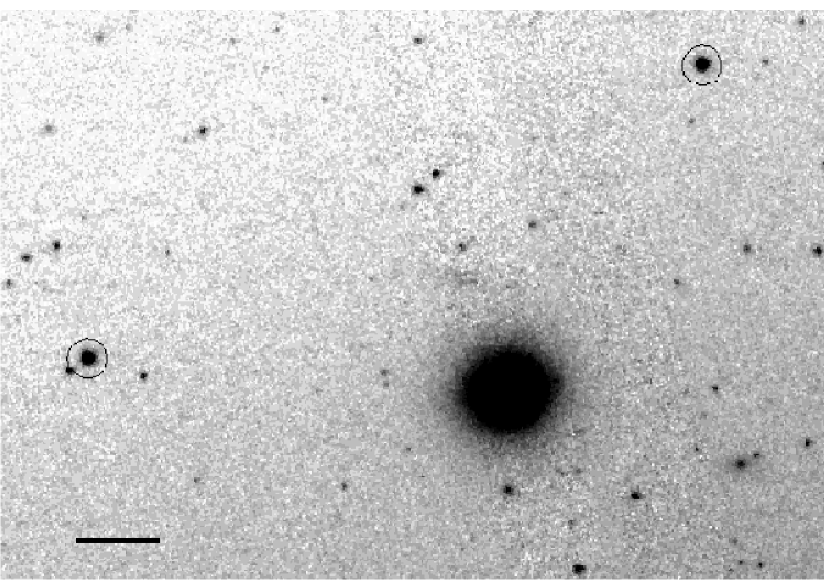
We analyze high resolution Advanced Camera for Surveys (ACS) data of the core of the Coma cluster, the richest galaxy cluster in the nearby Universe (Colless 2001). The Coma cluster provides the unique opportunity to study a very large number of distinct galaxies within a small area of the sky, as shown in Figure 1. Coma contains a diverse sample of stellar systems ranging from globular clusters to giant elliptical galaxies. The core of this cluster contains two giant elliptical galaxies (NGC 4874 and NGC 4889) with globular cluster systems that, when combined, have more than 30000 members (Blakeslee & Tonry 1995; Harris et al. 2009). We specifically study an ACS pointing containing NGC 4874, one of the two central galaxies of Coma, and the only central galaxy with ACS imaging. The globular cluster system of NGC 4874 alone has an estimated minimum of 18700 members (Harris et al. 2009), the largest published globular cluster system.

We derive a color-magnitude diagram for this immense GCS allowing us to clearly define its color distribution. We also estimate the structural parameters of sources that show extended structure using ishape (Larsen 1999), a specially designed software to derive the structural parameters of slightly resolved astronomical objects. We find that 52 objects have effective radii 10 pc. These objects have colors, and magnitudes similar to the brightest globular clusters. We postulate that these objects constitute the UCD and DGTO population of the core of the Coma Cluster.
There is a vast terminology to define objects larger than GCs and smaller than dwarf elliptical galaxies: Intermediate Mass Object, Dwarf Galaxy Transition Object, super-massive star cluster, etc. (see Hilker 2006 for a review). UCDs, in particular, are conventionally defined as objects with radii of 10-100 pc, although departures from this size range have been reported (e.g. Evstigneeva et al. 2008). A commonly quoted lower limit for the mass of UCDs is (Mieske et al. 2008) and their magnitude limit is typically mag (Mieske et al. 2006). UCDs also have higher mass-to-light ratios than globular clusters and the presence of dark matter in these stellar systems is still under debate (Hasegan et al. 2005; Dabringhausen et al. 2008). In this paper we will refer to the ensemble of 52 objects with an effective radius pc as UCD/DGTOs. The term UCDs will be reserved for the subset of 25 objects which are additionally brighter than the luminosity requirement for the UCD label.
Independent methods give estimates of the distance to the Coma cluster between 84 and 108 Mpc, see Table 1 of Carter et al. (2008). We adopt a fiducial distance of 100 Mpc and thus a scale of 23 pc per 0.05 (one ACS pixel).
2. Data
We use data taken during the Coma Cluster Survey (Carter et al. 2008). This HST Treasury program was able to obtain eighteen pointings of the core of the Coma Cluster with the ACS Wide Field Channel detector before the electronics failure of the instrument. Each field comprises imaging in two different filters: F475W (similar to Sloan ) and F814W (Cousins I) (Mack et al. 2003).
The science data from this observing program were prepared through a dedicated pipeline that is described in detail by Carter et al. (2008). The final images were created using the pyraf task multidrizzle (Koekemoer et al. 2002). We use the public data products from the second release of the Coma Cluster Treasury program which provide the best relative alignment between the two filters. In the nomenclature of the second data release, we use field number 19 with target name Coma 3-5. The exposure times for this field are 2677 s and 1400 s for the F475W and F814W filters, respectively.
3. PSF
We build the PSF using the daophot package within pyraf. We perform photometry of candidate stars using the task phot, the selection of optimal stars is carried out using pstselect which selects 12 bright, uncrowded, and unsaturated stars across the field. The computation of a luminosity weighted PSF is done with the task psf. ishape requires the PSF to be oversampled by a factor of ten, that is the pixel size should be a tenth of the native pixel size of the science image. We create an oversampled PSF with the task seepsf, and we provide the resulting PSF as input to ishape. While several options to calculate the PSF for the HST exist, it has been shown that with the sequence of daophot tasks described above a reliable and accurate model of the PSF core can be constructed (Spitler et al. 2006; Price at al. 2009).
4. Detection
We median filter the images in both bands with a box size of pixels and then subtract the result from the original images to obtain a residual free of galaxy light. We thus facilitate the detection of the position of point-like sources. A first catalogue of sources is generated running SExtractor (Bertin & Arnouts 1996) on the image created by adding the median-subtracted images of the two filters. Within SExtractor we use a detection threshold of with a minimum of five pixels above the threshold to trigger an extraction. A lower detection limit would generate a large number of spurious detections while more conservative parameters would leave globular clusters undetected.
We perform a first round of careful visual inspection of all detections and eliminate spurious sources such as background galaxies and objects along the edge of the chip. We use a novel method to carry out a secondary visual inspection of our 4976 remaining detections. We take advantage of the short computation time needed to derive an initial set of structural parameters with ishape. In order to discard spurious sources from our analysis we follow the steps described below. With the initial set of structural parameters obtained with ishape we create a list of objects with dubious values such as very large ellipticity or conspicuously large effective radii ( pc) for visual inspection. By virtue of the high-resolution imaging of the ACS we can determine that most of these objects are background galaxies, irregular structures, or gradients of surface brightness without link to any real source. Examples of objects flagged and eliminated due to their suspicious structural parameters (i.e. large ellipticity or large effective radius) are presented in Figure 2. Using this method we are able to eliminate 170 false detections in a short time. We are left with 4806 sources, most of them globular clusters belonging to the NGC 4874 GCS.
5. Structural Parameters
5.1. Effective radius
The high resolution of the Hubble Space Telescope has enabled the measurement of structural parameters of vast numbers of extragalactic globular clusters. Using WFPC2 data, Larsen et al. (2001) derived size estimates from globular clusters of seventeen nearby, early-type galaxies and found that the majority of clusters have effective radii of two to three parsecs. Based on ACS data, and an independent technique, Jordán et al. (2005) derived the effective radii of thousands of globular clusters from 100 early-type galaxies in the Virgo cluster and report a median GC effective radius of 2.7 pc. Masters et al. (2010), studying the globular clusters around 43 early-type galaxies in the Fornax cluster found that the median of a GC is 2.9 pc. These results are in remarkable agreement with size measurements of GCs in spirals (Spitler et al. 2006; Harris et al. 2010) and with the known median effective radii of Galactic globular clusters, i. e. pc (Harris et al. 1996). At present, no correlation has been found between the luminosity (or mass) of globular clusters and their effective radius, however their median is pc.
We fit the light profiles of 4806 sources using ishape (Larsen 1999), a software commonly used to derive the structural parameters of barely resolved astronomical objects, such as, extragalactic globular clusters. ishape convolves the point-spread function (PSF) with an analytical model of the surface brightness profile and searches for the best fit to the data by varying the full width half maximum (FWHM) of the synthetic profile. The output given by ishape for each source comprises the effective radius (or equivalently half-light radius), the ratio of the minor over major axis, the position angle, the signal-to-noise level, and the reduced (or goodness of fit).
Within ishape the user can choose among several analytical models for the light profile that will be used during the fitting process, e.g. King, Sérsic, Gaussian. We adopt a King profile with a concentration parameter of ; the concentration parameter is defined as the ratio of the tidal radius over the core radius (King 1962, 1966).
The value of accurately represents the average concentration parameter for Milky Way, M31, and NGC 5128 globular clusters (Harris et al. 1996; Harris 2009a and references therein). Moreover, the concentration parameters for UCDs in Fornax and Virgo derived by Evstigneeva et al. (2008) are consistent with a choice of . In addition, by using c=30 we facilitate comparison with similar studies e.g. Blakeslee & Barber DeGraaff (2008). Also, quantitative tests show that for partially resolved objects the solution for is very insensitive to the particular choice of (Harris et al. 2010).
A signal-to-noise ratio of S/N50 is necessary to obtain reliable measurements of the structural parameters with ishape. This requirement for the S/N was demonstrated through extensive testing of ishape by Harris (2009a). Of our initial 4806 sources for which we derived structural parameters, 631 sources conform to this S/N requirement simultaneously in both bands. Hereafter, when considering structural parameters we will refer only to those 631 objects with S/N50 in both bands.
At the distance of the Coma cluster, namely 100 Mpc, the effective radius of a globular cluster (3 pc) is equivalent to six milliarcseconds, a radius practically irrecoverable in ACS/WFC data with a pixel size of 0.05. Using WFPC2 data, Harris et al. (2009a) demonstrated that at the distance of Coma objects with pc have light profiles indistinguishable from those of stars. As expected, the vast majority of clusters for which we attempted to obtain reliable structural parameters remain unresolved and thus an estimate of their effective radius cannot be made, see Figure 3. However, with ishape we find 52 sources that are positively resolved.
We derive the structural parameters of all sources independently in both bands. We minimize systematics between the two measurements by strictly following the same set of steps. We also use the same set of stars to create both PSFs. In Figure 3 we present the ratio plotted against . This figure shows how the ratio converges to 1 at pc. At larger radii ( pc) the agreement between the two measurements is excellent and reveals a small but real offset. This small but significant difference (12%) in the value of in these two bands can be expected due to physical reasons, notably color gradients within globular clusters (Larsen et al. 2008). These authors find that can vary by up to 60% between the measurements in blue (F333W) and red (F814W) bands. For our measurements of UCD/DGTOs the median of the ratio is .
We select as UCD/DGTO candidates only those objects that are resolved in both bands. The vertical line in Figure 3 shows that all objects with pc are consistently resolved in both bands. Most of the UCD/DGTO candidates (45 of them) have an effective radius larger than 10 pc in at least one band, the minimum size commonly quoted for UCDs (Mieske et al. 2004). We include in our list of candidates seven objects slightly below this, somehow arbitrary, cut: these seven objects have an 9.5 in one band and are within the errors ( or pc, Harris 2009a) in agreement with the standard size definition of UCDs. Objects resolved in one band but having zero size in the other are rejected as UCD/DGTO candidates, see Figure 3.
We also explore the impact of the fitting radius in pixels (fitrad) that we use as an input of ishape. The UCD candidates are barely resolved in the ACS images, that is, they have a FWHM of pixels. ishape is limited to a fit radius of a few pixels (Blakeslee & Barber DeGraaff 2008) and the optimal fitting radius is the result of a balance between signal and noise, similar to the evolution of the S/N ratio as a function of aperture radius in photometric measurements. The selection of candidates is carried out using a fitrad=6 pixels. The consistency of the measurements with fitrad=6 pixels is shown in Figure 3 where we compare the values of in both bands.
ishape yields robust values of effective radius independent of the model selected by the user i.e. the value of measured with a King profile is expected to be similar to obtained using a Sérsic profile. We exploit this property of ishape in Figure 4. The aim of Figure 4 is twofold: we show the impact on the value of measured by ishape of i) two different analytical models, ii) two different fitting radii. The values of returned by ishape should be equivalent for different (but reasonable) analytical models of the surface brightness profile. In fact, a King profile (King 1962, 1966) with a concentration parameter of c=30, and a Sérsic model (Sérsic 1968) with a Sérsic index of are equivalent for our measurements. This is particularly true for the smaller UCD candidates as noted by Evstigneeva et al. (2008). A larger fitting radius, fitrad=15 pixels instead of fitrad=6 pixels, gives generally a larger . Given that a larger fitting radius is more appropriate for bigger sources, we report in Table 1 the values obtained using fitrad=15 pixels for those sources with pc in the initial run with fitrad=6 pixels.
Globular clusters have a median of 3 pc but their size distribution extends up to eight parsecs (Harris 2009a, Masters et al. 2010). UCDs studied by Evstigneeva et al. (2008) range in between 4.0 and 93.2 pc while Blakeslee & Barber DeGraaff (2008) report UCDs with ranging from 11.2 to 90.3 pc with a tentative gap between large globular clusters (or the most compact UCDs) with pc and large UCDs with pc. We find objects with almost continuously spanning the range from 10 to 40 pc, we find no indication for a break in the size distribution of these compact stellar systems.
Metal-poor globular clusters are on average larger than metal-rich ones. This size difference has been well documented by several studies (Jordán et al. 2005; Spitler et al. 2006, Harris 2009a; Masters et al. 2010). This size difference has been explained as the result of mass segregation combined with the metallicity dependence of main sequence stars (Jordán 2004). Harris (2009a) postulates that the conditions of formation can also be responsible for this size difference while Larsen & Brodie (2003) argue that a size-galactocentric distance trend and projection effects are the decisive factors. The correlation between size and color (or metallicity) observed for globular clusters is blurred at higher masses. In our sample blue UCD/DGTO candidates have a median effective radius of pc while the median for red UCD/DGTO candidates is pc.


5.2. Ellipticity
ishape computes the minor/major (b/a) axis ratio for each object. We use this ratio to derive the ellipticity () and to set a selection limit of for our UCD/DGTO candidates. Figure 5 shows the ellipticity values of our UCD/DGTO candidates which span the whole range set by our selection criterion. The smallest ellipticity of this sample is 0.03, only two candidates have an ellipticity of less than 0.1. Blakeslee & Barber DeGraaff (2008) found that all their UCD candidates have an ellipticity between 0.16 and 0.46. The largest ellipticity in our sample of UCD candidates is 0.49 and the median of the distribution is 0.24.
The complete list of UCD/DGTO candidates with their effective radius and ellipticity is presented in Table 1. Given that ishape measures the effective radius along the major axis, we apply a correction to obtain the circularized effective radius that we present in Table 1:
6. Photometry
We perform photometric measurements with the task phot of the pyraf/daophot package. We execute aperture photometry with a four pixel radius and apply aperture correction following the formulas of Sirianni et al. (2005). We use the ACS/WFC Vega zero points for each filter that we obtain from the updated tables maintained by the STScI, i.e. mag, and mag (Sirianni et al. 2006). Note that the main catalogue of sources for the Coma Treasury Survey uses AB magnitudes (Hammer et al. 2010). Foreground Galactic extinction is calculated using E(B-V)=0.009 mag (from NED) and the extinction ratios of Sirianni et al. (2005), from which we obtain mag and mag.
We obtain photometric measurements of 4806 sources in F475W and F814W. Most of these sources are globular clusters likely belonging to the NGC 4874 GCS. As shown in Figure 1, crowding is not an issue in our data.
6.1. Color-Magnitude Diagram
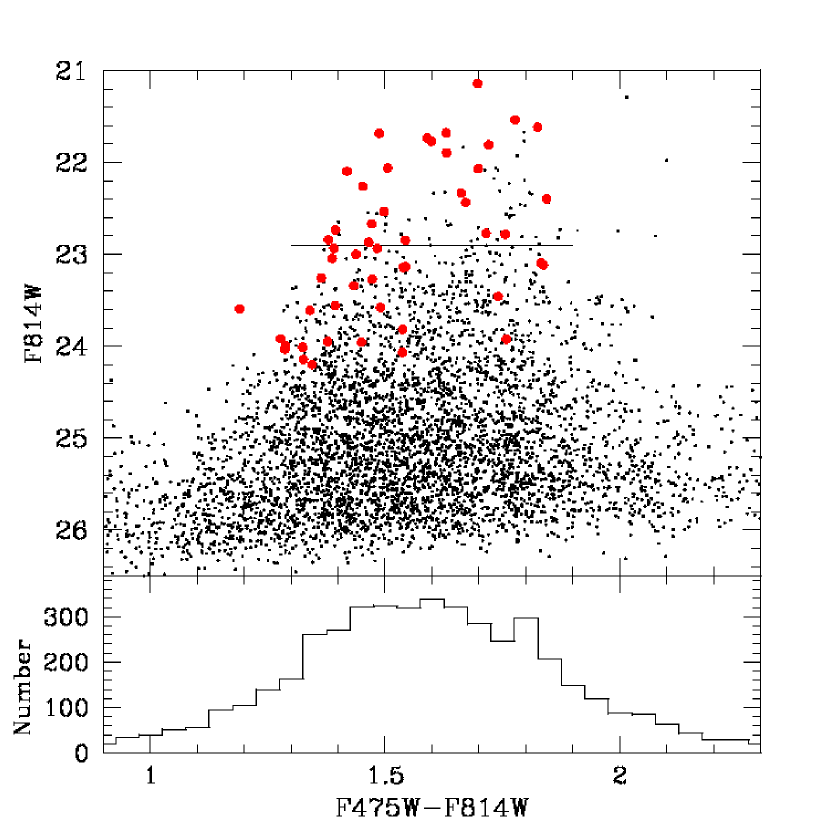
In the color-magnitude diagram of Figure 6 we also plot the size information derived with ishape. Unresolved globular clusters belonging to the NGC 4874 GCS are plotted as black dots. Some of these globular clusters might also be intracluster globular clusters of Coma similar to those found in the Virgo cluster (Williams et al. 2007; Lee et al. 2010). UCD/DGTO candidates are plotted as filled red circles. Our UCD/DGTO candidates coincide in color with the brightest members of the metal-poor and metal-rich subpopulations of globular clusters.
The color distribution of the brightest GCs is clearly defined in the CMD. Background galaxies removed while cleaning spurious detections have different colors than globular clusters. This was demonstrated by Dirsch et al. (2003; their Figure 3) studying a field containing the NGC 1399 GCS and a background field; see also Harris (2009b) for his study of contamination in the M87 field. Moreover, evolutionary synthesis models predict that elliptical galaxies of any age, which are the background objects most likely to appear as UCDs, have colors (Buzzoni 2005).
Mieske et al. (2004) set a magnitude limit of mag for their UCD selection criteria while Hasegan et al. (2005) adopt mag. Mieske et al. (2006) identified a metallicity break and thus set the onset of the size-luminosity relation at mag. Assuming mag and a distance modulus to the Coma Cluster of mag we find that UCDs should have mag if we set a selection limit of mag. We have assumed (Sirianni et al. 2005).
There are 110 objects in total with mag in the color-magnitude diagram of Figure 6, i.e. above the horizontal bar, 25 of these objects also have effective radii characteristic of UCDs. These 110 objects are of similar or higher mass than Centauri (, van de Ven et al. 2006). Higher resolution data should reveal that the remaining 85 objects have an extended structure given that marks the onset of a size-luminosity relation for stellar structures (Hasegan et al. 2005; Forbes et al. 2008; Murray 2009). We also present the color histogram in the bottom panel of Figure 6, which is consistent with the histogram presented by Harris et al. (2009).
6.2. Size-magnitude
We attempt to show the onset of the size luminosity relation in Figure 7. This figure is divided in four quadrants that are limited by the luminosity limit of UCDs and the ability of our data to obtain reliable size estimates i.e. a size of pc. Among the large scatter of the data points characteristic of such a plot (Masters et al. 2010; Forbes et al. 2008) we find that the fraction of unresolved stellar structures brighter than the minimum luminosity limit is particularly low around mag, a hint of the onset of a size-luminosity dependence. More data points are needed to confirm this trend.
6.3. Color Bimodality
We use the software R for our statistical calculations presented in this work. R is a freely available, open source environment for statistical computing. The code RMIX, run within R, is specially designed to evaluate the mixture of multiple distributions within a histogram. RMIX is particularly well suited for the analysis of the underlying distributions present in the color-magnitude diagram. The code and its application to the analysis of a CMD has been presented, for example, by Wehner et al. (2008) and Harris (2009a).
The CMD of globular cluster systems is expected to be bimodal and, as noted earlier, for central dominant galaxies this bimodality should be evident. The bimodal UCD color distribution sits atop a bimodal globular cluster distribution well identified for GCs brighter than F814W 24 mag, see both panels of Figure 8.
We use the best bimodal fit to the color distribution of the 52 UCD/DGTO candidates to estimate the color boundary between blue and red UCD candidates (Figure 8). We define this point as the intersection of the two Gaussians fitting each subpopulation (Peng et al. 2006). We thus set the boundary between blue and red UCD/DGTO candidates at F475W-F814W = 1.61. According to this fit, 63% of our UCD/DGTOs belong to the blue subpopulation, while 37% are red. For UCDs only (i.e. mag), 44% of them are blue and 56% are red.
The brightest candidates are thus red. Self-enrichment models developed by Bailin & Harris (2009) predict a mass-metallicity relationship (MMR) for the most luminous globular clusters (with masses ). Due to self-enrichment blue massive globular clusters and UCDs are expected to migrate in color towards the red. The visible effect of this mass-metallicity relationship in the CMD is the truncation towards higher luminosities of the blue subpopulation of globular clusters and a red color for the brightest UCDs, as observed in Figure 6 and 8.


7. Spatial Distribution
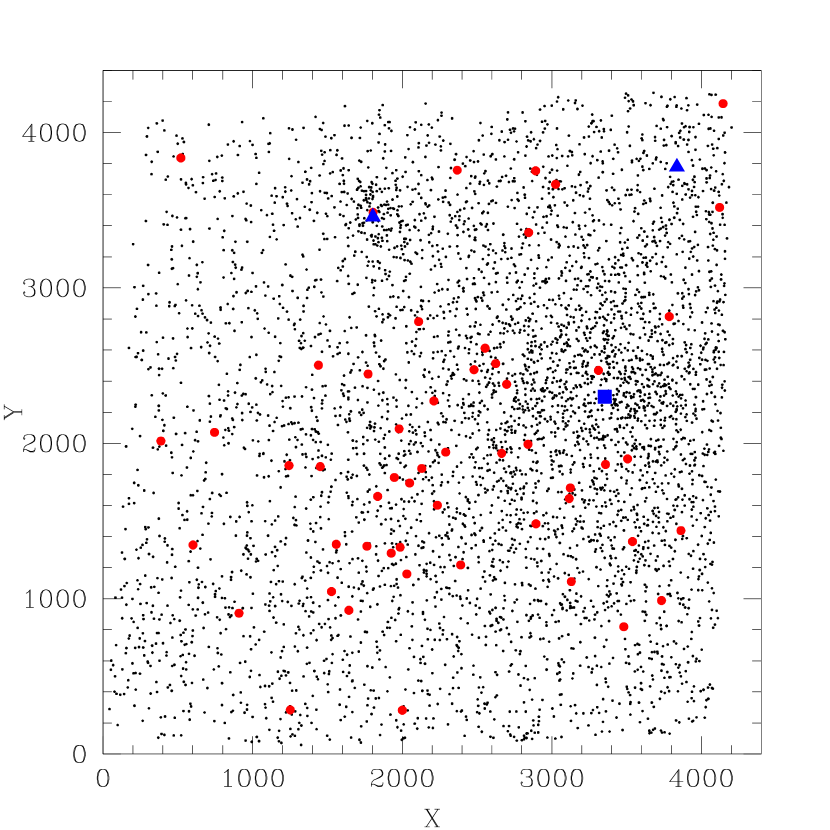
In Figure 9 we plot the spatial distribution of globular clusters, UCD/DGTO candidates and large galaxies in the ACS frame. At the Coma distance an ACS/WFC field of view covers an area of kpc2. A clear over-density of globular clusters appears to be associated with NGC 4874 and to a lesser extent with NGC 4873. No over-density is visible around NGC 4871. In this image, NGC 4874 is off-center, towards the edge of the field of view. The adjacent ACS field was part of the original observing program but was not acquired due to the failure of the instrument. A definitive conclusion on the spatial distribution of UCD/DGTO candidates is difficult to reach without the missing adjacent field. With the available data we observe that UCD/DGTO candidates appear to congregate around NGC 4874 and more importantly their spatial distribution is not random. The non-uniformity of the spatial distribution of UCD/DGTO candidates and their colors argue against background sources masquerading as UCD/DGTOs.
The cumulative fraction of globular clusters and UCD/DGTO candidates as a function of radial distance to NGC 4874 is plotted in Figure 10. Both stellar systems follow the same distribution. In fact a formal two sample Kolmogorov-Smirnov test yields a maximum difference between the two, azimuthally averaged, cumulative distributions of with a corresponding . This result is valid if we compare UCDs and GCs, the maximum difference in their cumulative fractions is with , see Figure 10. In Figure 10 we also plot the surface density of compact stellar systems in the vicinity of NGC 4874. There is a deficit of UCD/DGTOs in the inner 15 kpc around NGC4874. This deficit of DGTOs and UCDs can be explained, at least in part, by tidal interactions with the host galaxy. At small galactocentric distances tidal interactions with the host galaxy destroy or truncate the size of large stellar systems (Hodge 1960, 1962). For the Milky Way the relation between GC effective radius and galactocentric distance is (van den Bergh et al. 1991). Similar relations have been found for several extragalactic GCS but using projected galactocentric distances (e.g. Jordán et al. 2005).
8. Final remarks
We do not observe any stark discontinuity between the characteristics of globular clusters, Dwarf Globular Transition Objects and Ultra-Compact Dwarfs in the core of the Coma Cluster. On the contrary, bright globular clusters, DGTO, and UCDs have similar luminosity, color, and effective radius. This is suggestive of a continuous distribution of stellar systems gradually increasing in size and luminosity (mass) from globular clusters to UCDs.
A spectroscopic survey is currently being carried out by Chiboucas et al. (2009); this project includes several of our UCD candidates as targets and will be the next obvious step to confirm the nature of our brighter detections.
References
- Bailin (2009) Bailin, J. & Harris, W. E. 2009, ApJ, 695, 1082
- Blakeslee & Barber DeGraaff (2008) Blakeslee, J. P. & Barber DeGraaff, R. 2008, AJ, 136, 2295
- Blakeslee & Tonry (1995) Blakeslee, J. P. & Tonry, J. L. 1995, ApJ, 442, 579
- Bertin (1996) Bertin, E., & Arnouts, S. 1996, A&AS, 117, 393
- Buzzoni (2005) Buzzoni, A. 2005, MNRAS, 361, 725
- Carter (2008) Carter, D., et al. 2008, ApJS, 176, 424
- Chiboucas (2009) Chiboucas, K., et al. 2009, BAAS, 41, 234
- Chilingarian (2008) Chilingarian I. V. & Mamon, G. A. 2008, MNRAS, 385, L83
- Colles (2001) Colless, M. 2001, Coma Cluster in Encyclopedia of Astronomy and Astrophysics, Nature Publishing Group, Basingstoke, UK
- Dabringhausen (2008) Dabringhausen, J., Hilker, M., & Kroupa, P. 2008, MNRAS, 386, 864
- Drinkwater (2000) Drinkwater, M. J. et al. 2000, PASA, 17, 227
- Drinkwater (2003) Drinkwater, M. J. et al. 2003, Nature, 423, 519
- Dirsch (2003) Dirsch, B. et al. 2003, AJ, 125, 1908
- Evstigneevaetal (2008) Evstigneeva, E. A. et al. 2008, AJ, 136, 461
- Forbes (2008) Forbes, D. A. et al. 2008, MNRAS, 389, 1924
- Hammer (2010) Hammer, D. et al. arXiv:1005.3300
- Harris (1996) Harris, W. E. 1996, AJ, 112, 1487
- Harris (2009) Harris, W. E. 2009a, ApJ, 699, 254
- Harris (2009) Harris, W. E. 2009a, ApJ, 699, 254
- Harris (2009) Harris, W. E. 2009b, ApJ, 703, 939
- Harrisetal (2009) Harris, W. E., et al. 2009, AJ, 137, 3314
- Harris (2010) Harris, W. E., et al. 2010, MNRAS, 401, 1965
- Hasegan (2005) Hasegan, M., et al. 2005, ApJ, 627, 203
- Hau (2009) Hau, G. K., et al. 2009, MNRAS, 394, L97
- Hilker (1999) Hilker, M., et al. 1999, A&AS, 134, 75
- Hilker (2006) Hilker, M. 2006, UCDs- A mix bag of objects, in ESO Astrophysics Symposia: Globular Clusters Guides to Galaxies, Springer, Berlin
- Hodge (1960) Hodge, P. W. 1960, ApJ, 131, 351
- Hodge (1962) Hodge, P. W. 1962, PASP, 74, 248
- Jordan (2004) Jordán, A. 2004, ApJ, 613, L117
- Jordan (2005) Jordán, A., et al. 2005, ApJ, 634, 1002
- King (1962) King, I. R. 1962, AJ, 67, 471
- King (1966) King, I. R. 1966, AJ, 71, 64
- Koekemoer (2002) Koekemoer, A. M., Fruchter, A. S., Hook, R. N., & Hack,W. 2002, in The 2002 HST Calibration Workshop: Hubble after the Installation of the ACS and the NICMOS Cooling System, ed. S. Arribas, A. Koekemoer, & B. Whitmore, Baltimore, STScI, 339
- Larsen (1999) Larsen, S. S. 1999, A&AS, 139, 393
- Larsen & Brodie (2003) Larsen, S. S. & Brodie 2003, ApJ, 593, 263
- Larsen et al. (2001) Larsen, S. S., et al. 2001, AJ, 121, 2974
- Larsen et al. (2008) Larsen, S. S., et al. 2008, MNRAS, 383, 263
- Lee (2010) Lee, M. G., et al. 2010, Science, 328, 334
- Mack (2003) Mack, J., et al. 2003, ACS Data Handbook, Version 2.0, Baltimore, STScI
- Masters (2010) Masters, K., et al. 2010, ApJ, 715, 1419
- Mieske (2004) Mieske, S., et al. 2004, AJ, 128, 1529
- Mieske (2006) Mieske, S., et al. 2006, AJ, 131, 2442
- Mieske (2007) Mieske, S., et al. 2007, A&A, 472, 111
- Mieske (2008) Mieske, S., et al. 2008, A&A, 487, 921
- Murray (2009) Murray, N. 2009, ApJ, 691, 946
- Peng (2006) Peng, E. W., et al. 2006, ApJ, 639, 95
- Peng (2008) Peng, E. W., et al. 2008, ApJ, 703, 42
- Phillipps (2001) Phillipps, S. et al. 2001, ApJ, 560, 201
- Price (2009) Price, J. et al. 2009, MNRAS, 397, 1816
- Romanowsky (2009) Romanowsky, A. J. et al. 2009, AJ, 137, 4956
- Sersic (1968) Sérsic, J. L. 1968, Atlas de Galaxias Australes (Córdoba: Observatorio Astronómico, Univ. Nac. Córdoba)
- Sirianni (2005) Sirianni, M. et al. 2005, PASP, 117, 1049
- Sirianni (2006) Sirianni, M., Gilliland, R., & Sembach, K. 2006 Technical Instrument Report ACS 2006-02, Baltimore, STScI
- Spitler (2006) Spitler, L. R. et al. 2006, AJ, 132, 1593
- vandeven (2006) van de Ven G. et al. 2006, A&A, 445, 513
- vandeven (2006) van den Bergh, S. et al. 1991, ApJ, 375, 594
- Wehner (2007) Wehner, E. M. H. & Harris, W. E. 2007, ApJ, 668, L35
- Wehneretal (2008) Wehner, E. M. H., et al. 2008, ApJ, 681, 1233
- Williams (2007) William, B. F. et al. 2007, ApJ, 654, 835
| X | Y | RA | Dec | Color | fitrad | |||||
|---|---|---|---|---|---|---|---|---|---|---|
| 387 | 2015 | 12:59:39.22 | 27:59:54.7 | 19.76 | 1.74 | 41.9 | 47.7 | 0.28 | 40.5 | 15 |
| 2390 | 1217 | 12:59:40.60 | 27:58:08.4 | 21.14 | 1.70 | 34.0 | 36.8 | 0.22 | 28.7 | 15 |
| 1252 | 284 | 12:59:44.94 | 27:58:54.4 | 21.54 | 1.78 | 8.5 | 9.5 | 0.27 | 8.1 | 6 |
| 2894 | 1482 | 12:59:39.22 | 27:57:46.5 | 21.62 | 1.83 | 14.6 | 16.7 | 0.14 | 15.4 | 6 |
| 1979 | 2093 | 12:59:37.68 | 27:58:37.6 | 21.68 | 1.63 | 15.6 | 17.7 | 0.34 | 14.4 | 6 |
| 1836 | 1658 | 12:59:39.40 | 27:58:40.1 | 21.68 | 1.49 | 12.6 | 12.2 | 0.17 | 11.2 | 6 |
| 3130 | 1110 | 12:59:40.41 | 27:57:31.1 | 21.74 | 1.59 | 11.9 | 9.5 | 0.34 | 7.7 | 6 |
| 3481 | 819 | 12:59:41.21 | 27:57:10.9 | 21.77 | 1.60 | 11.2 | 11.9 | 0.20 | 10.6 | 6 |
| 2212 | 2273 | 12:59:36.83 | 27:58:28.1 | 21.81 | 1.72 | 10.5 | 10.5 | 0.24 | 9.2 | 6 |
| 1764 | 1338 | 12:59:40.64 | 27:58:40.3 | 21.90 | 1.63 | 8.8 | 12.2 | 0.15 | 11.3 | 6 |
| 1527 | 1046 | 12:59:41.91 | 27:58:48.9 | 22.06 | 1.51 | 6.1 | 11.2 | 0.03 | 11.1 | 6 |
| 2698 | 2380 | 12:59:36.06 | 27:58:05.4 | 22.07 | 1.70 | 16.0 | 20.1 | 0.18 | 18.2 | 6 |
| 2291 | 1943 | 12:59:37.99 | 27:58:20.8 | 22.10 | 1.42 | 24.1 | 26.5 | 0.32 | 21.9 | 6 |
| 2891 | 3754 | 12:59:30.83 | 27:58:10.2 | 22.26 | 1.45 | 6.5 | 9.9 | 0.27 | 8.4 | 6 |
| 2554 | 2612 | 12:59:35.31 | 27:58:14.9 | 22.33 | 1.66 | 54.1 | 66.0 | 0.04 | 64.7 | 15 |
| 2845 | 3357 | 12:59:32.33 | 27:58:08.4 | 22.40 | 1.84 | 9.9 | 11.2 | 0.11 | 10.6 | 6 |
| 2001 | 282 | 12:59:44.36 | 27:58:17.8 | 22.44 | 1.67 | 7.5 | 10.9 | 0.35 | 8.8 | 6 |
| 2031 | 1159 | 12:59:41.09 | 27:58:25.4 | 22.53 | 1.50 | 8.5 | 10.2 | 0.14 | 9.5 | 6 |
| 2625 | 2513 | 12:59:35.62 | 27:58:10.4 | 22.67 | 1.47 | 8.2 | 9.9 | 0.15 | 9.1 | 6 |
| 2235 | 1601 | 12:59:39.30 | 27:58:20.0 | 22.74 | 1.39 | 19.4 | 22.1 | 0.15 | 20.4 | 6 |
| 3785 | 2816 | 12:59:33.60 | 27:57:16.8 | 22.77 | 1.72 | 9.9 | 11.9 | 0.20 | 10.6 | 6 |
| 909 | 907 | 12:59:42.90 | 27:59:17.7 | 22.78 | 1.76 | 8.2 | 9.5 | 0.17 | 8.7 | 6 |
| 3863 | 1438 | 12:59:38.62 | 27:56:58.7 | 22.84 | 1.38 | 9.9 | 9.2 | 0.27 | 7.8 | 6 |
| 3539 | 1368 | 12:59:39.14 | 27:57:13.8 | 22.85 | 1.54 | 11.9 | 12.2 | 0.39 | 9.6 | 6 |
| 4121 | 3518 | 12:59:30.74 | 27:57:07.6 | 22.87 | 1.47 | 10.2 | 9.5 | 0.26 | 8.2 | 6 |
| 3124 | 1713 | 12:59:38.19 | 27:57:37.7 | 22.94 | 1.48 | 16.0 | 16.0 | 0.32 | 13.2 | 6 |
| 1440 | 2503 | 12:59:36.59 | 27:59:08.3 | 22.94 | 1.39 | 9.9 | 9.2 | 0.47 | 6.7 | 6 |
| 602 | 1346 | 12:59:41.52 | 27:59:37.2 | 23.00 | 1.44 | 26.6 | 31.7 | 0.14 | 29.4 | 15 |
| 746 | 2071 | 12:59:38.73 | 27:59:37.7 | 23.05 | 1.39 | 16.0 | 20.7 | 0.15 | 19.1 | 6 |
| 3507 | 1900 | 12:59:37.20 | 27:57:20.9 | 23.10 | 1.83 | 10.9 | 13.9 | 0.24 | 12.2 | 6 |
| 3359 | 1864 | 12:59:37.45 | 27:57:27.7 | 23.12 | 1.84 | 10.5 | 10.5 | 0.46 | 7.7 | 6 |
| 3311 | 2469 | 12:59:35.25 | 27:57:36.4 | 23.14 | 1.54 | 6.5 | 10.2 | 0.15 | 9.4 | 6 |
| 1559 | 1350 | 12:59:40.76 | 27:58:50.5 | 23.14 | 1.54 | 8.2 | 11.6 | 0.43 | 8.7 | 6 |
| 1644 | 925 | 12:59:42.26 | 27:58:41.9 | 23.26 | 1.36 | 6.1 | 9.9 | 0.43 | 7.4 | 6 |
| 2368 | 3758 | 12:59:31.23 | 27:58:35.9 | 23.27 | 1.47 | 12.2 | 13.9 | 0.40 | 10.8 | 6 |
| 3025 | 3667 | 12:59:31.05 | 27:58:02.8 | 23.34 | 1.43 | 9.2 | 10.5 | 0.20 | 9.4 | 6 |
| 520 | 3837 | 12:59:32.38 | 28:00:07.1 | 23.46 | 1.74 | 55.1 | 56.9 | 0.21 | 50.6 | 15 |
| 3733 | 988 | 12:59:40.39 | 27:57:00.4 | 23.56 | 1.39 | 11.9 | 12.9 | 0.38 | 10.2 | 6 |
| 2480 | 2474 | 12:59:35.88 | 27:58:17.1 | 23.58 | 1.49 | 10.2 | 12.2 | 0.11 | 11.5 | 6 |
| 2110 | 2783 | 12:59:35.03 | 27:58:38.4 | 23.59 | 1.19 | 17.7 | 11.9 | 0.36 | 9.5 | 6 |
| 3116 | 1645 | 12:59:38.44 | 27:57:37.4 | 23.61 | 1.34 | 23.8 | 30.3 | 0.16 | 27.7 | 6 |
| 4144 | 4187 | 12:59:28.25 | 27:57:13.4 | 23.82 | 1.54 | 11.9 | 13.3 | 0.24 | 11.6 | 6 |
| 1926 | 1293 | 12:59:40.68 | 27:58:31.9 | 23.92 | 1.28 | 21.4 | 18.0 | 0.15 | 16.6 | 6 |
| 2049 | 1744 | 12:59:38.92 | 27:58:30.6 | 23.92 | 1.76 | 10.9 | 9.2 | 0.44 | 6.9 | 6 |
| 2665 | 1936 | 12:59:37.72 | 27:58:02.4 | 23.95 | 1.38 | 50.0 | 58.2 | 0.28 | 49.4 | 15 |
| 1986 | 1331 | 12:59:40.49 | 27:58:29.4 | 23.96 | 1.45 | 24.8 | 39.2 | 0.38 | 24.9 | 6 |
| 2841 | 1994 | 12:59:37.37 | 27:57:54.4 | 24.00 | 1.29 | 16.7 | 19.4 | 0.14 | 18.0 | 6 |
| 1772 | 2446 | 12:59:36.54 | 27:58:51.4 | 24.01 | 1.32 | 11.2 | 14.3 | 0.26 | 12.3 | 6 |
| 1948 | 1780 | 12:59:38.86 | 27:58:35.9 | 24.03 | 1.29 | 9.2 | 13.6 | 0.49 | 9.7 | 6 |
| 1243 | 1857 | 12:59:39.13 | 27:59:11.2 | 24.07 | 1.54 | 18.7 | 9.2 | 0.45 | 6.8 | 6 |
| 1452 | 1850 | 12:59:38.99 | 27:59:00.9 | 24.16 | 1.33 | 12.2 | 11.9 | 0.12 | 11.2 | 6 |
| 2131 | 1838 | 12:59:38.51 | 27:58:27.6 | 24.22 | 1.34 | 14.6 | 12.9 | 0.28 | 11.0 | 6 |
Note. — Columns 1 & 2: x and y position in pixels of the ACS Camera; Columns 3 & 4: RA and Dec (J2000); Column 5: magnitude in the F814W band; Column 6: F475W-F814W color; Column 7: in F475W in pc; Column 8: in F814W in pc; Column 9: Ellipticity in F814W; Column 10 Circularized effective radius (F814W) in pc; Column 11 fitrad in pixels used for the given measurement