The dynamically hot stellar halo around NGC 3311: a small cluster-dominated central galaxy††thanks: Based on observations collected at the European Organisation for Astronomical Research in the Southern Hemisphere, Chile, during the observing program 082.A-0255(A) on 2009 March 25.
Abstract
Context. An important open question is the relation between intracluster light and the halos of central galaxies in galaxy clusters.
Aims. Here we report results from an on going project with the aim to characterize the dynamical state in the core of the Hydra I (Abell 1060) cluster around NGC 3311.
Methods. We analyze deep long-slit absorption line spectra reaching out to kpc in the halo of NGC 3311.
Results. We find a very steep increase in the velocity dispersion profile from a central to at . Farther out, to kpc, appears to be constant at this value, which is of the velocity dispersion of the Hydra I galaxies. With its dynamically hot halo kinematics, NGC 3311 is unlike other normal early-type galaxies.
Conclusions. These results and the large amount of dark matter inferred from X-rays around NGC 3311 suggest that the stellar halo of this galaxy is dominated by the central intracluster stars of the cluster, and that the transition from predominantly galaxy-bound stars to cluster stars occurs in the radial range 4 to 12 kpc from the center of NGC 3311. We comment on the wide range of halo kinematics observed in cluster central galaxies, depending on the evolutionary state of their host clusters.
Key Words.:
galaxies:clusters:general – galaxies:clusters:individual (Hydra I) – galaxies:kinematics and dynamics – galaxies:individual (NGC 3311)1 Introduction
An important open question is the physical and evolutionary relation between the intracluster light (ICL) and the extended halo of the brightest cluster galaxies (BCGs), whether they are truly independent components or whether the former is a radial extension of the latter. Using a sample of 683 SDSS clusters Zibetti et al. (2005) found a surface brightness excess with respect to an inner profile that characterizes the mean profile of the BCGs, but it is not yet known whether this cD envelope is simply the central part of the cluster’s diffuse light component, or whether it is distinct from the ICL and part of the host galaxy (Gonzalez et al. 2005).
In the Southern hemisphere, the cD galaxy NGC 3311 and the giant elliptical NGC 3309 dominate the central region of the Hydra I cluster, an X-ray bright, non-cooling flow, medium compact cluster with a velocity dispersion (Misgeld et al. 2008). The X-ray observations show that the hot intracluster medium centered on NGC 3311 has a fairly uniform distribution of temperature and metal abundance from a few kpc out to a radius of kpc (Tamura et al. 2000; Yamasaki et al. 2002; Hayakawa et al. 2004, 2006). Given the overall regular X-ray emission and temperature profile, the Hydra I cluster is considered as a prototype of an evolved and dynamically relaxed cluster; it is therefore a suitable candidate for a dynamical study of a relaxed extended stellar halo around a BCG.
The primary goal of this work is to establish the dynamical state of the stellar halo of NGC 3311. We use long-slit spectra to uncover the kinematics in the halo region of NGC 3311 out to kpc from its center. In Sect. 2 we present observations with FORS2 at VLT and the GEMINI GMOS archive data, which we reanalyze. We describe the data reduction and the kinematic measurements in Sect. 3. The newly measured halo kinematics and their implications are discussed in Sect. 4, and our conclusions are summarized in Sect. 5.
We adopt a distance to NGC 3311 of (NED), equivalent to a distance modulus of mag. Then corresponds to .
2 Observations and archive data
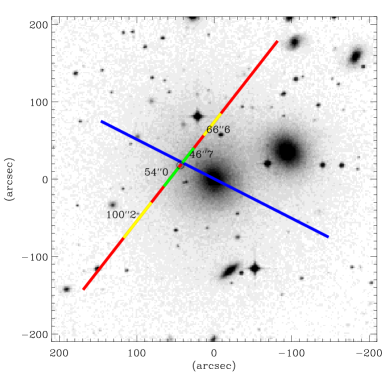
VLT FORS2 long slit spectra - The long-slit spectra were obtained during the nights of 2009 March 25-28, with FORS2 on VLT-UT1. The instrumental setup had a long-slit wide and long, Grism 1400V+18, with instrumental dispersion of 0.64 Å pixel-1 and spectral resolution , and a spatial resolution along the slit of . The seeing during observations ranged from to . The wavelength coverage of the spectra is from 4655 Å to 5965 Å, including absorption lines from Hβ, MgI ( Å) and Fe I ( Å). We obtained eight spectra of 1800 sec each, for a total exposure time of 4 hrs. In the FORS2 observations, the long slit is centered on the dwarf galaxy HCC 26 at and (J2000), with a position angle of P.A.=; HCC 26 is seen in projection onto the NGC 3311 halo. The position of the FORS2 long slit is shown in Fig. 1. Its center is located at P.A.= with respect to NGC 3311, approximately along the major axis of the galaxy.
Gemini GMOS-South long slit spectra - We use Gemini archive long-slit spectra in the wavelength range from 3675 Å to 6266 Å observed with the B600 grating, a dispersion of Å pixel-1, a spectral resolution of , and a spatial scale of pixel-1; a detailed description of the instrumental setup is presented in Loubser et al. (2008). The seeing was typically in the range from to . We target the same absorption lines as for the FORS2 spectra, i.e. Hβ, MgI ( Å) and Fe I ( Å). The wide and long Gemini slit is centered on NGC 3311, at and (J2000), along P.A. = , the direction of the galaxy major axis. Its position is shown in Fig. 1.
3 Data reductions
The data reduction of the FORS2 long slit spectra is carried out in . After the standard operations of bias subtraction and flat-fielding, the spectra are registered, co-added and wavelength calibrated. The edges of the FORS2 slit reach well into sky regions, which are then used to interpolate the sky emission in the regions covered by the stellar spectra.
In the low surface brightness regions, spectra are summed along the spatial direction in order to produce one-dimensional spectra with an adequate S/N ratio ( per Å). Four independent one-dimensional spectra are extracted along the slit where the light is dominated by the halo of NGC 3311; of these, two are from regions north and two from regions south of HCC 26, respectively. We extract spectra from slit regions of and at distances of about and from the center of NGC 3311, and of and at central distances of about and . We properly mask the spectra of foreground stars in those areas.
The data reduction for the GMOS long slit spectra is carried out independently here, also in and with the standard tasks in the Gemini package. The procedure is described in Loubser et al. (2008) for the wavelength calibration and background subtraction; also in this case the edges of the slit are used to interpolate the sky emission in the regions covered by the stellar continuum. Because our goal is to sample the kinematics well into the halo, the one-dimensional spectra for the absorption line measurements are summed along the slit direction so that a minimum S/N per Å is obtained in each radial bin, out to a radial distance of about from the center of NGC 3311.
Stellar kinematics - The stellar kinematics is measured from the extracted 1D spectra in the wavelength range 4800 Å Å, using both the “penalized pixel-fitting” method (PPXF, Cappellari & Emsellem (2004)) and the Fourier correlation quotient (FCQ) method (Bender 1990), in order to account for possible systematic errors and template mismatch.
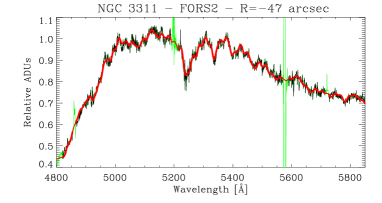
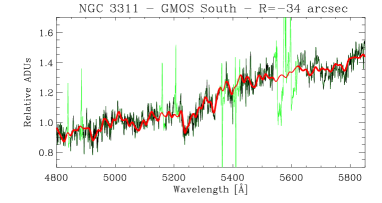
In the PPXF method, stellar template stars from the MILES library (Sanchez-Blazquez et al. 2007) are combined to fit the one-dimensional extracted spectra; the rotational velocity, the velocity dispersion and Gauss-Hermite moments (e.g. Gerhard (1993)) are measured simultaneously. Fig. 2 shows two of the extracted spectra and the broadened templates fit by PPXF. In the FCQ method, the rotational velocity and velocity dispersion are derived for each extracted one-dimensional spectrum by assuming that the LOSVD is described by a Gaussian plus third- and fourth- order Gauss-Hermite functions. Before to the fitting procedure the MILES template spectra are smoothed to the GMOS and FORS2 spectral resolution with the measured broadening offsets. While FCQ provides error estimates along with the measured kinematics, errors for the PPXF kinematic parameters are calculated with a series of Monte Carlo simulations adopting the appropriate S/N for each bin.
Because the stellar populations in cD halos may have different metal abundances and ages from those of the inner regions (Coccato et al. 2010a, b), systematic effects caused by template mismatch must be evaluated and accounted for. We therefore extract kinematic measurements with PPFX and FCQ as follows:
-
1.
fit with PPFX the best stellar template from the MILES library in the central regions with the highest S/N, and extract and at all radii, using the same stellar template;
-
2.
simultaneously fit the best stellar template, and in each radial bin with PPFX;
-
3.
adopt the respective best-fit PPXF stellar template to derive the LOSVD with FCQ for all radial bins;
-
4.
finally, average rotational velocities and velocity dispersions are computed as weighted means of the three values extracted in each radial bin as detailed above. Errors for these weighted average values are computed from those of the three measurements, but if the reduced is greater than one, they are increased by in order to take into account systematic differences. I.e., where , are the errors on the individual measurements and the weighted mean , respectively.
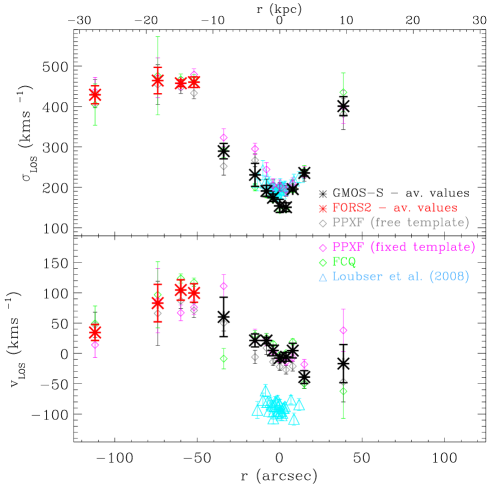
Mean velocities and velocity dispersions in all radial bins are listed in Table 1, and the profiles are shown in Fig. 3 together with the previous measurements from Loubser et al. (2008). Table 1, which is available in electronic form, contains the following information: source of data (Col. 1), distance from galaxy center (Col. 2), P.A. (Col. 3), , with errors for each of the procedures 1.-4. described in the text, in Col. (4-5), (6-7), (8-9), and (10-11), respectively. Heliocentric and relativistic corrections have been applied to the mean velocities. The systemic velocity is and has been subtracted.
In the central region of NGC 3311, our new velocity dispersion profile marginally agrees with that of Loubser et al. (2008). The new mean line-of-sight velocity measurements agree with the systemic velocity of NGC 3311 obtained by Misgeld et al. (2008), but have a systematic offset from the data of Loubser et al. (2008), by about 91 km s-1. The agreement between the new FORS2 measurements at and the revised value at from archive GMOS data gives us confidence that the systematic effects from wavelength calibration offsets, template mismatch, etc., are sufficiently small in the new, independent data reductions. However, several tests have convinced us that the data do not allow us to reliably determine full line-of-sight distributions (e.g., , ), which could be used to test for subcomponents, which one would expect in particular at radii .
4 The kinematics of the NGC 3311 stellar halo
The combined new velocity dispersion profile for NGC 3311 reaches to from the center of NGC 3311 along the galaxy’s major axis (P.A.=), and to an off-axis distance of along the FORS2 slit. It shows a very unusual steep rise with increasing radial distance from the galaxy center: from a central value , to at , and then on to a flat outside . The steep outward gradient is supported by two independent data sets and data reductions. The measurements of Loubser et al. (2008) near the galaxy center had already hinted at a positive gradient from at to at a radius of , and data shown in Fig. 1 of Hau et al. (2004) reach at . With the new data we now have very clear evidence of a dynamically hot stellar halo in NGC 3311.

To put the extremely rapid rise of the velocity dispersion profile of NGC 3311 in context, we compare its kinematic properties with those of early-type galaxy (ETG) halos mapped using planetary nebula data (Coccato et al. 2009) and with the halos of the two Coma BCG galaxies NGC 4889, NGC 4874 from deep absorption line spectroscopy (Coccato et al. 2010a). Fig. 4 shows the mean , X-ray luminosity, and total absolute B-band magnitude for these galaxies versus their outermost halo velocity dispersion. For NGC 3311, we use a bolometric X-ray luminosity within , erg s-1 (based on the flux in the 0.5-4.5 keV energy range from Yamasaki et al. (2002) and corrected to bolometric according to Table 1 of O’Sullivan et al. (2001)), and the total extinction corrected B-band magnitude (12.22) from de Vaucouleurs et al. (1991). For the velocity dispersion of NGC 3311, we use the values at the center, at () and at (). Only the central puts NGC 3311 in the middle of the ETG distribution; deviates strongly, with a much larger than expected for the given , .
The natural interpretation for these results is that the outer stellar halo of NGC 3311 is dominated by the central intracluster star component of the Hydra cluster. This is supported by several pieces of evidence: (i) The steep rise of the -profile; more isolated ETGs all have slightly or even steep falling -profiles (Coccato et al. 2009). (ii) The saturation of at , outside of which the dynamically hot component dominates completely. is of the galaxy velocity dispersion in the cluster core. (iii) The large amount of dark matter inferred from X-ray observations around NGC 3311 ( within 20 kpc, Hayakawa et al. (2004)).
In recent cosmological hydrodynamic simulations of cluster formation, Dolag et al. (2010) applied a kinematic decomposition to the stellar particles around cD galaxies. With a double Maxwellian fit to the velocity histogram of star particles centered on a simulated cD, they were able to separate an inner, colder Maxwellian distribution associated with the central galaxy, and an outer, hotter component of stars that orbit in the cluster potential. For both components they derived radial density profiles and, fitting Sersic profiles, found that the inner stellar component is much steeper than the outer diffuse stellar component. A comparison with these simulations indicates that the steep velocity dispersion gradient in the halo of NGC 3311 traces the transition from central galaxy stars to the diffuse intracluster stellar component. In the NGC 3311 halo, the transition between the two occurs at smaller radii than in other BCGs in nearby clusters, in the range between 4 and 12 kpc.
NGC 3311 appears to have a similar halo as the cD galaxy NGC 6166 in the Abell 2199 cluster (Kelson et al. 2002), whose -profile rises to cluster values at kpc. But NGC 3311 is even more extreme; it is a fairly small galaxy, based on its central , and it is already dominated by the surrounding cluster component at kpc. Presumably, this is because the core of the “relaxed” Hydra cluster has had time to collapse onto the galaxy. For comparison, the two BCG galaxies in the Coma cluster core, which have a nearly constant -profile (Coccato et al. 2010a), may be in the middle of an ongoing merger (Gerhard et al. 2007), so that their previous subcluster halos would have been stripped and a new cluster halo could have been built only after the merger was completed; and in the outer halo of the more isolated M87, the velocity dispersion appears to drop (Doherty et al. 2009) towards the edge.
5 Conclusions
Based on two independent long-slit data sets and reductions, we find a steep gradient in the velocity dispersion profile of the central galaxy NGC 3311 in the Hydra I cluster, from to km s-1 outside 12 kpc (60% of the velocity dispersion of the galaxies in the surrounding cluster).
The new data provide evidence that NGC 3311 is a fairly small galaxy dominated by a large envelope of intracluster stars already beyond kpc, whose orbits are dominated by the cluster dark matter potential. Comparison with other BCG galaxies shows a wide range of dynamical behavior in their halos.
Acknowledgements.
The authors wish to thank the ESO VLT staff for their support during the observations and the referee for a constructive report. This research has made use of the Gemini archive data, the NASA/IPAC Extragalactic Database (NED), which is operated by the Jet Propulsion Laboratory, California Institute of Technology, under contract with the National Aeronautics and Space Administration.References
- Bender (1990) Bender, R. 1990, A&A, 229, 441
- Cappellari & Emsellem (2004) Cappellari, M. & Emsellem, E. 2004, PASP, 116, 138
- Coccato et al. (2010a) Coccato, L., Arnaboldi, M., Gerhard, O., et al. 2010a, ArXiv e-prints
- Coccato et al. (2010b) Coccato, L., Gerhard, O., & Arnaboldi, M. 2010b, MNRAS, L97+
- Coccato et al. (2009) Coccato, L., Gerhard, O., Arnaboldi, M., et al. 2009, MNRAS, 394, 1249
- de Vaucouleurs et al. (1991) de Vaucouleurs, G., de Vaucouleurs, A., Corwin, Jr., H. G., et al. 1991, Third Reference Catalogue of Bright Galaxies, ed. de Vaucouleurs, G. and de Vaucouleurs, A. and Corwin, Jr., H. G. and Buta, R. J. and Paturel, G. and Fouque, P.
- Doherty et al. (2009) Doherty, M., Arnaboldi, M., Das, P., et al. 2009, A&A, 502, 771
- Dolag et al. (2010) Dolag, K., Murante, G., & Borgani, S. 2010, MNRAS, 405, 1544
- Gerhard et al. (2007) Gerhard, O., Arnaboldi, M., Freeman, K. C., et al. 2007, A&A, 468, 815
- Gerhard (1993) Gerhard, O. E. 1993, MNRAS, 265, 213
- Gonzalez et al. (2005) Gonzalez, A. H., Zabludoff, A. I., & Zaritsky, D. 2005, ApJ, 618, 195
- Hau et al. (2004) Hau, G. K. T., Hilker, M., Bridges, T., et al. 2004, in IAU Colloq. 195: Outskirts of Galaxy Clusters: Intense Life in the Suburbs, ed. A. Diaferio, 491–495
- Hayakawa et al. (2004) Hayakawa, A., Furusho, T., Yamasaki, N. Y., Ishida, M., & Ohashi, T. 2004, PASJ, 56, 743
- Hayakawa et al. (2006) Hayakawa, A., Hoshino, A., Ishida, M., et al. 2006, PASJ, 58, 695
- Kelson et al. (2002) Kelson, D. D., Zabludoff, A. I., Williams, K. A., et al. 2002, ApJ, 576, 720
- Loubser et al. (2008) Loubser, S. I., Sansom, A. E., Sánchez-Blázquez, P., Soechting, I. K., & Bromage, G. E. 2008, MNRAS, 391, 1009
- Misgeld et al. (2008) Misgeld, I., Mieske, S., & Hilker, M. 2008, A&A, 486, 697
- O’Sullivan et al. (2001) O’Sullivan, E., Forbes, D. A., & Ponman, T. J. 2001, MNRAS, 328, 461
- Sanchez-Blazquez et al. (2007) Sanchez-Blazquez, P., Peletier, R. F., Jimenez-Vicente, J., et al. 2007, VizieR Online Data Catalog, 837, 10703
- Tamura et al. (2000) Tamura, T., Makishima, K., Fukazawa, Y., Ikebe, Y., & Xu, H. 2000, ApJ, 535, 602
- Yamasaki et al. (2002) Yamasaki, N. Y., Ohashi, T., & Furusho, T. 2002, ApJ, 578, 833
- Zibetti et al. (2005) Zibetti, S., White, S. D. M., Schneider, D. P., & Brinkmann, J. 2005, MNRAS, 358, 949
| Instr. | R | P.A. | ||||||||
|---|---|---|---|---|---|---|---|---|---|---|
| (arcsec) | () | () | () | () | () | () | () | () | ||
| (1) | (2) | (3) | (4) | (5) | (6) | (7) | (8) | (9) | (10) | (11) |
| GMOS-S | ||||||||||
| GMOS-S | ||||||||||
| GMOS-S | ||||||||||
| GMOS-S | ||||||||||
| GMOS-S | ||||||||||
| GMOS-S | ||||||||||
| GMOS-S | ||||||||||
| GMOS-S | ||||||||||
| GMOS-S | ||||||||||
| FORS2 | ||||||||||
| FORS2 | ||||||||||
| FORS2 | ||||||||||
| FORS2 |
Notes – Col. 1: instrument. Col. 2: Radial distance from center of NGC 3311. Col. 3: Position angle of data with respect to NGC 3311’s center. Col. 4: Velocity measured with PPXF (using template determined at ), relative to the galaxy systemic velocity. Col. 5: Velocity dispersion measured with PPXF (using template determined at ). Col. 6: Velocity measured with PPXF (free template), relative to the galaxy systemic velocity. Col. 7: Velocity dispersion measured with PPXF (free template). Col. 8: Velocity measured with FCQ, relative to the galaxy systemic velocity. Col. 9: Velocity dispersion measured with FCQ. Col. 10: Weighted average velocity. Col. 11: Weighted average velocity dispersion.