Piezonuclear reactions
Abstract
In this paper, we deal with the subject of piezonuclear reactions, namely nuclear reactions (of new type) triggered by pressure waves. We discuss the experimental evidences obtained in the last two decades, which can be summarized essentially as follows: experiments in cavitation of liquids, where transmutation of elements, creation of elements and emission of neutrons have been observed; emission of neutrons in brittle failure of solids subjected to mechanical pressure; alteration of the lifetime of un unstable element (thorium) subjected to cavitation. A theoretical model to explain these facts is proposed. Future perspectives of these experimental and theoretical investigations are also underlined.
1 Introduction
The application of elastic waves of suitable power and frequency (in particular ultrasounds) to a liquid with gas dispersed in it gives rise to the phenomenon known as acoustic cavitation [1, 2]. The main physical effects occurring in a cavitated liquid can be accounted for in terms of a hydrodynamic model based on the formation and the collapse of imploding gas bubbles in the liquid [1, 2]. The processes occurring during the collapse, and the collapse itself, are quite complex and a good deal of research has been carried out in order to clarify their physical and chemical aspects.
In particular, theoretical and experimental studies on sonoluminescence (i.e. the emission of light bursts from a cavitated liquid [3]) led to conclude that the temperature in the core of a collapsing bubble can reach and more [4, 5]. Actually, even simple-minded calculations show that cavitation can produce an extreme concentration of energy for unit time in the collapsing gaseous bubble. To this regard, let us consider a typical bubble, whose initial radius, as experimentally found, is of the order of 10-6 m. If we suppose that nothing can stop the contraction down to a radius of atomic dimensions, namely 10-10 m, then, by assuming that the total initial power stored within the bubble be constant, the surface power density at the end of contraction will be 108 times greater than the initial one. For an initial power of 100 , this means that within the final bubble we will have an equivalent temperature of 1011 (corresponding to an energy for particle of 10 ). So high temperatures could cause thermonuclear fusion (sonofusion or acoustic inertial confinement fusion, AICF).
The research on AICF (pioneered by Flynn in 1982 [6]) carried out in the last years [7]-[18] attempted to produce known nuclear reactions by means of pressure or ultrasounds and cavitation. To this aim, the solutions involved contained deuterium and/or unstable nuclides. Let us notice that this is by no means a completely new approach to standard nuclear reactions (except for the use of cavitation). Indeed, we recall that in the past some investigations [19]-[22] have highlighted the ability of pressure and shock waves to generate autocatalytic fission-fusion reactions in compounds containing also uranium, tritium and deuterium.
On the other hand, experiments on the electric explosion of titanium foils in liquids [23]-[27] have evidenced changes in the concentrations of elements and alteration of the secular equilibrium of unstable nuclides. Since one might argue that the shock waves caused by the foil explosion act on the matter in a way similar to ultrasounds in cavitation, all such experiments, together with those obtained by cavitating liquids, support the evidence for nuclear reactions induced by high mechanical pressures (piezonuclear reactions, piezo from the ancient Greek verb piezéin which means to press).
Moreover, since cavitation in liquids is basically a mean to generate pressure waves acting on the elements diluted in solutions, we hypothesized that mechanical waves may give rise to piezonuclear effects also in solids subjected to pressure during crashing failure. In other words, compenetration of molecular layers in solids would be the analogous of cavitation in liquids. This hypothesis was tested and proved indeed to be true [57, 36].
These considerations stress the need for (and the importance of) experiments looking at the physical features and implications of piezonuclear reactions, with special emphasis on the mass spectrum of the samples (either liquid or solid) before and after cavitation and on the possible emission of ionizing radiation and neutrons.
To this aim, in the last years, we carried out a series of experiments on piezonuclear reactions [28]-[35]. They can be roughly divided in three groups: 1) experiments on cavitating water [28]-[31]; 2) experiments on cavitating salt solutions [32]-[34]; 3) experiments on fracture of solids [35, 36]. In the first group, we looked for transformations of elements, whereas the other two sets of experiments were devoted to the detection of emitted neutrons. Two points need to be stressed. First, our research, although it might seem to deal with the same physical terms such as nuclear reactions, nuclear radiation and to point towards the same technological direction, is based on a different theoretical framework [37]-[39], according to which nuclear processes (not necessarily of the standard type) can be induced in stable nuclides too only by suitable mechanical waves, i.e. without any application of radioactive or nuclear active substances. Then, it never involved any radioactive source or unstable nuclide (except for the case of [34]), unlike other experiments [9]-[18],[23]-[27]. Our work concentrated on absolutely stable elements111These stable elements are all but deuterium, since we are not looking for Deuterium-Deuterium fusion., and in this sense it is moving along a parallel path with respect to the other research streams.
The paper is organized as follows. In Sect.2, we discuss all the experiments carried out by cavitating water. The results obtained by cavitation of liquid solutions of metal salts are described in Sect.3, where the fundamental role of iron salts in order to get neutron emission is stressed. Sect.4 deals with the problem of the effect of cavitation on a solution containing thorium, which apparently shows its reduction at a rate 104 times faster than its natural decay. In Sect.5 we discuss the evidence for piezonuclear reactions in brittle fracture of solids, in which neutron emissions is observed too. Sect.6 is devoted to a brief comparison with other experiments of similar kind (although a deep discussion with LENR phenomenology deserves a paper by its own). In Sect.7 we propose a possible theoretical explanation of piezonuclear reactions, partly classical and partly based on the formalism of a deformed Minkowski space-time (in which the metric coefficients are functions of energy). The last section contains some possible developments and perspectives.
2 Piezonuclear Reactions in Cavitated Water
In our first three experiments on cavitation [28]-[31], we restricted ourselves to detect the mass spectrum changes, after cavitation, together with possible presence of ionizing radiation. As regards the substance undergoing cavitation, two main considerations led us to choose the deionized and distilled water. In first place, we know from both theoretical and experimental studies that its phenomenological behaviour during cavitation satisfies the Rayleigh-Plesset equation. In this respect, we remark that, although at the present time we don’t have a simple theory of phenomena (such as sonoluminescence), connected to the cavitation process, and the use of this equation was not accepted by all researchers [3], the latter is, however, the starting point for a determination of the macroscopic phenomenological parameters needed to implement the cavitation itself.
2.1 First Experiment
In the first experimental work (carried out at Perugia University in 1998) [28, 29], we utilized a new type of sonotrode (”cavitator”) with a very long working time ( 30 )222This new kind of cavitator was developed by P. Diodati at Perugia University.. Its main feature consisted in the cooling system, that allows one to keep constant the resonance frequency for a time interval much longer that possible with the presently available sonotrodes. This cavitator was composed by a titanium tip shaped with an exponential profile, connected to a column of piezoelectrics cooled by oil in a pressure circuit with dry ice choke.
Through such a device we subjected to cavitation a sample of bidistilled and deionised water at room temperature. The vessel of the cavitator was made of optical flint glass. During the cavitation process, the titanium tip of the cavitator was directly immersed and the water surface was free. The water sample was subjected to ultrasounds without stopping for a total time of 210 at the constant power of 630 and at the frequency of 20 , in order to induce cavitation according to the Rayleigh-Plesset equation [2].
We performed a gamma spectrometry on samples of cavitated and uncavitated water without finding any radioactivity increase in cavitated water. After cavitation, we analyzed the cavitated water sample, confining our analysis to the stable chemical elements (from Z = 1 to Z = 92), and we compared the new results with those obtained from the uncavitated water. The analysis of the water both before and after cavitation was carried out by three different procedures, reaching the precision of 1 and with a standard deviation on concentration given by = 10-5 . The three procedures consisted in:
- mass atomic absorption (ICP);
- cyclotron spectrometry (ICR);
- mass spectrometry (MS).
All these measurements have been carried out using different apparatuses and by different personnel staff.
Therefore, the concentration of each element was measured at least three times. More precisely: the ICP and the ICR measurements were carried out for all elements; as a check, the ICP measurement was repeated for the elements with decreasing and increasing concentrations; the MS measurements were carried out only for the elements from H to Pd.
We carried out also a measurement of device background, without water, for each vacuum chamber used.
Very surprisingly, we found relevant changes in the concentrations of the elements (in units of ) in the cavitated sample (despite the very low original concentration). In order to asset the changes in the chemical elements, the variation factors have been accepted only for a value 2 in the concentration ratios in water after and before cavitation. Evidence was found for 10 increasing and 19 decreasing elements. Let us notice, in particular, that the decrease concerned stable elements with low mass number.
We checked the possible contributions to changes due to impurities, possibly arising from the titanium tip of the cavitator and the flint glass of the vessel, by three different methods:
- mass atomic absorption (ICP) on cavitated water sample;
- electron microscopy on dusts of tip and vessel;
- X-ray microanalysis, carried out by two different laboratories on both the dusts of tip and vessel and the dry residues of the two (cavitated and uncavitated) water samples.
The obtained results let us exclude contributions due to impurities to the observed concentration changes [28, 29].
During cavitation, we looked for the possible emission of radiation by putting, on the external walls of the vessel, slabs of colloid LR115, sensitive to ionisation energies in the range 100 - 4 , which are typical e.g. of -particles. We measured, by means of the same kind of slabs, the background radiation in the laboratory room where water cavitation was being carried out, and we found a flux intensity of (210 - 150) . We analyzed the slabs and observed no significant differences between the two sets of slabs, those put on the vessel walls and those which recorded the background radiation. Subsequently, five months later, we carried out again a -spectrometry on samples of both uncavitated and cavitated water without finding any appreciable difference, thus confirming the previous evidence.
A basic point to be stressed is that, even if the cavitation gave rise to an increase of the concentration of some elements and to a decrease of others, the number of protons was actually conserved. This is easily seen if we take into consideration the difference , defined as
| (1) |
where () is the average concentration ratio after cavitation of the i-th (d-th) increasing (decreasing) element, and () the corresponding atomic number. From our data we found:
| (2) |
which is actually negligible, being about 10-3 of the number of protons involved (on account of the variation factors), say , for each element undergoing a concentration change. On the contrary, the number of neutrons between increasing and decreasing elements was not conserved.
Moreover, a huge increase in the concentration of uranium was found, of about two orders of magnitude. This result led us to perform the second experiment.
2.2 Second Experiment:Transuranic Evidences
The measurements of the first experiment were confined to the stable chemical elements. We therefore performed a second cavitation experiment and analyzed the mass composition of cavitated water by a spectrometer in the mass region 210M271 [30].
We subjected to cavitation by a standard sonotrode a mass of bidistilled and deionised water of about 30 , contained in a pyrex vessel at room temperature. The cavitation was carried out in an underground laboratory at the Tuscia University of Viterbo.
Four mass measurements were carried out on samples from water cavitated one, two, three and four times. Therefore, the whole cavitation time ranged from 10 for the first water sample to 40 for the last water sample. Each measurement was performed immediately after each cavitation run. We confined ourselves to merely counting the different masses identified by the spectrometer. An error was accepted in the mass value determination.
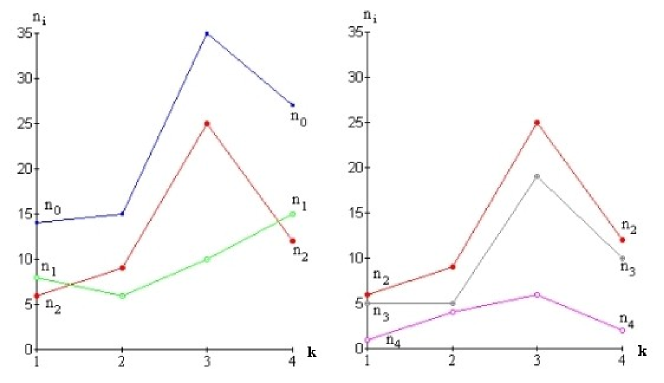
Let us label by and (; ), respectively, the four measurement runs carried out and the mass intervals (the total interval 0: 210M271, was split in the two subintervals 1: 210M238, and 2: 238M271; the subinterval 2 was in turn split in the subintervals 3: 238M264, and 4: 264M271). The numbers are defined as
| (3) |
where is the number of nuclei measured in the -th mass interval in the -th water sample cavitated times, and is the number of nuclei measured in the -th mass interval in the background/blank measurement (which of course includes the masses of the calibration compound).
In Fig.1 the numbers of nuclides () are plotted as functions of the cavitation runs . On the left it is seen that the excess in the number of masses identified in run 3, in the water sample cavitated 3 times, has to be ascribed to masses in region 2, 238M271. In such a region 2, the contribution to the excess in the number of masses appears to be due to masses in the transuranic region, 238M264, as shown on the right in Fig.1.
One might argue that the excess in the number of masses could be due to the formation of macromolecules by processes like e.g. dimerization. However, such a possibility is unable to explain why the excess is just concentrated in a definite mass interval, i.e. in the transuranic region. On the other hand, possible contributions from cosmic-rays induced phenomena (like spallation) even at altitudes less than 200 a.s.l.— as it is indeed the case of the experiment sites — could give rise to an excess of light nuclei, but cannot explain an increment of heavy nuclei (even less the presence of nuclei heavier than uranium). Moreover, the actual presence of transuranic elements is supported by the huge increase of uranium found in the first experiment, which might just be explained in terms of the formation and subsequent decay of transuranic elements. The results of the first experiment do agree with the results of the second one, showing the rearrangement of elements, with the decrease in the concentrations of light-medium elements, and the increase in those of the heavy ones. Although a definite conclusion can only be drawn by carrying out a further experiment in the whole mass range, including both stable and transuranic elements, it is reasonable to assume that the excess of masses in the transuranic region are compensated by a simultaneous deficit of masses in the stable element region.
Such a picture is supported by the different behavior of the ’s (). The net increase of is due to the fact that in the mass range 210M238 there are mainly stable nuclei, and therefore their number increases following the production. On the contrary, in the range and 238M270, there are only unstable radionuclides (either experimentally known or theoretically predicted). Thus, their number first increases, then decreases (after the third cavitation) as soon as the decay rate overcomes the rate of production.
2.3 Third Experiment:Europium Isotope Production
We have seen that the first two experiments provided evidence for a change in concentrations of stable and transuranic chemical elements in cavitated water [28, 29]. The third experiment was aimed at looking for the production of the so-called rare earth elements, and was performed at the University of Rome ”La Sapienza” [31]. To cavitate water, the same sonotrode device of the second experiment was employed, but with a reduced power setup (still able to induce cavitation), in order to account for the different contributions to the phenomenon due to both the cavitation and the ultrasounds at different powers. The sonotrode tip, shaped like a truncated cone, was plunged into an open vessel at atmospheric pressure, filled with water at room temperature. The water surface was free. The sonotrode was cooled by air at room temperature (20) and had a working frequency = 20 , and transmitted power = 100 . The continuous operation folding time of this sonotrode was 15 , followed by a cooling period (15 ) of the column of piezoelectrics. During the cooling period the sonotrode was off.
It was chosen to examine, through ICP, two mass intervals, from 90 to 150 and from 200 to 255 , since they include also the rare earth elements we were looking for.
For every mass value in the two intervals, subdivided into steps of 0.01, the results of the ICP mass count were analyzed. The count series coincided with the measure series; the latter were obtained using the count data acquisition program PQ Vision supplied by Thermo Elemental. The aim of this analysis was to highlight the count variations (decrease or increase compared with the previous count).
For each mass the upper limit for the count background was evaluated, including both blank and noise. One took into consideration the masses whose upper count was higher than this upper limit. A given mass was taken into account only if its count was at least twice greater than the upper limit.
This criterion was applied to the counts obtained, for the same mass values, from measures performed with scanning times of both 10 and 150 .
No mass whose counts satisfied the described criterion was identified for scanning times of 150 , whereas only one mass was found for the scanning time of 10 , namely =(137.93 0.01) .
We performed differential measurements with a time interval of 300 , corresponding to the cavitation interval time. Then one got the differential counts, from which we derived the integral counts plotted in Fig. 2 as function of the cavitation interval time. In this way the data have been ensured from instrumental pile-up effects.
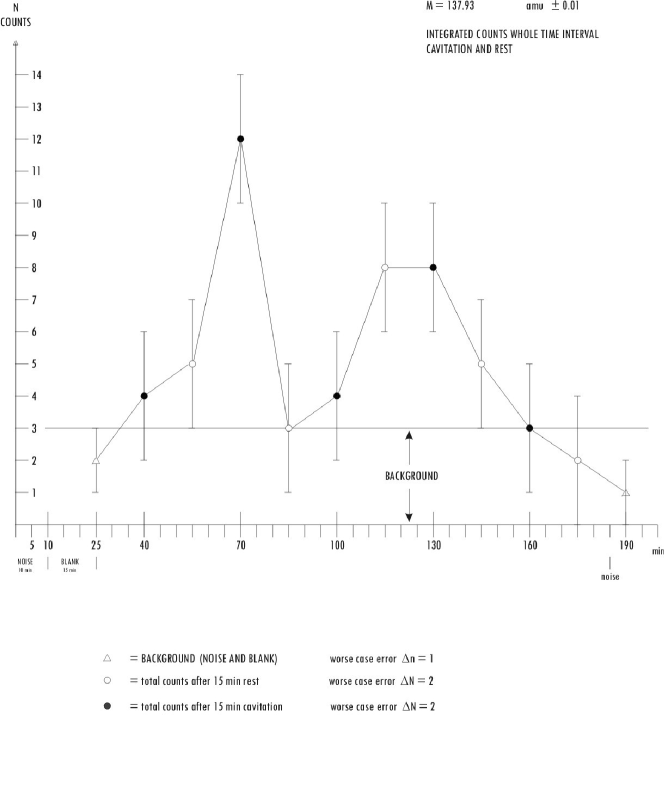
The identification of the observed peak with a given radionuclide required the determination of the lifetime. This could be done by analyzing Fig.2, and interpreting it as two subsequent cycles of production and decay of the observed element[30, 31]. Thus it was possible to evaluate its halftime (121) within 1.5 .
During the first experiment the concentration of was not changed. It is known that the abundance on Earth of stable europium is less than 1.06 (the natural is a mixture of two isotopes, with a percentage abundance of 47.77% and with a percentage abundance of 52.23%). The candidate identified during the third experiment does not exist in nature; it is an artificial radionuclide (discovered only in 1995-97 [40]) that can be produced at the present time in nuclear reactors and by synchrotrons.
There are two ways whereby can be produced: by nuclear fission or by nuclear fusion. The former process requires less energy. However, from the results of the first two experiments [28, 29], the quantity of heavy nuclei which can produce by nuclear fission is very much smaller (by two-three orders of magnitude) than that of the intermediate nuclei which can produce it by fusion (on account also of the impurities of the tip). As a matter of fact, a rough estimate (just based on the detected abundance of heavy nuclei in the second experiment) yields a probability of 10-6-10-8 for the production of by fission. Moreover, nuclear fusion is the only possible explanation of the changes in concentration of stable elements, induced by cavitation, observed in the first experiment.
3 Piezonuclear Reactions in Cavitated Solutions of Stable Elements and Evidence for Neutron Emission
We recall that, in our first experiment (see Sect.2), proton number was practically conserved, whereas neutron number was apparently not. This constitutes an indirect hint of some sort of neutron production in such cavitation processes. Since, as is well known, nuclear reactions in most cases involve neutron emission, it is a fundamental issue to check whether neutrons are produced indeed in processes possibly involving piezonuclear reactions. We point out that e.g. the experiments of refs.[9]-[11] have shown that cavitation of deuterated acetone can produce neutrons. In order to shed some light on this issue of neutron emission during cavitation, in 2004-2007 we carried out some experiments in which we cavitated controlled solutions of salts in water at CNR National Laboratories (Rome 1 Area) and Italian Armed Forces technical facilities (also with the support of ENEA, Ansaldo Nucleare and ARPA-Lazio). We focused our attention on ionizing radiation and neutron emission. The details of these experiments are reported in the following.
3.1 Experimental Equipment
The employed ultrasonic equipment was the robust ultrasound welder DN20/2000MD by Sonotronic [41]. We slightly modified the piezoelectrics and the sonotrode configuration in order to provide the equipment with a compressed air cooling system which allowed it to work for 90 minutes without stopping, at a frequency of 20 . As cavitation chamber, we used a Schott Duran® vessel made of borosilicate glass of 250 and 500 [42]. The truncated conical sonotrode that conveyed ultrasounds was made of AISI grade 304 steel. In all the experiments, the cavitated solutions were made using deionized and bidistilled water (18.2 ).
A magnetometer was used in order to take under control the local magnetic field (always found compatible with the local magnetic field of Earth, measured in absence of cavitation) and along with it possible currents generated by the converting piezoelectric units that might have affected the electronics of the geiger counters and of the gamma spectrometer.
Let’s now focus our attention on the technique used to reveal the possible neutron emission that we may expect during cavitation from the results of our previous experiments (see Sect.2). The only hint that we got from them is the non-conservation of the number of neutrons (according to the mass spectrometer analyses), which suggests a possible neutron emission, but does not say anything about their spectrum, their isotropy and homogeneity in space and their constancy in time. This wide range of possibilities convinced us that the first step to be moved in order to ascertain this hint was just to reveal the presence of neutrons in a sort of a ’yes or no’ detecting procedure, by leaving a complete and more exhausting proper measurement to a second higher and more accurate level of investigation, grounded on the possible positive answer from this first level of inquiry. Thus, we decided at first to use neutron passive detectors which are capable of integrating neutron radiation within their energy range, regardless of the time feature of their emission. Such devices do not require any sort of adaptive electronic calibration which would be necessary with an electronic detector in order to track and follow an emission that, as far as we know, could be the most variable one in terms of energy and time. The passive detectors that we utilized were the so-called Defenders and the CR-39 plates. Once that an initial but solid evidence of neutron emission was gathered by these passive detectors, we increased the quality of our investigation by moving to electronic Boron Trifluoride detectors. Before presenting the experiments and their results, it is important to stress at this stage some features of the detectors and state what was done in order to keep them under control.
The Defenders were produced by BTI (Bubble Technology Industries)333Let us notice that they are no longer in production and have been replaced by similar devices. However on the BTI there still is a web page dedicated to them [45]. and consisted of minute droplets of a superheated liquid dispersed throughout an elastic polymer gel. When neutrons strike these droplets, they form small gas bubbles that remain fixed in the polymer. The number of bubbles is directly related to the amount and the energy of neutrons, so the obtained bubble pattern provides an immediate visual record of the neutron dose (see Fig.3). Each Defender was provided with its own calibration number ( ), so it was possible to convert the number of bubbles into dose equivalent.
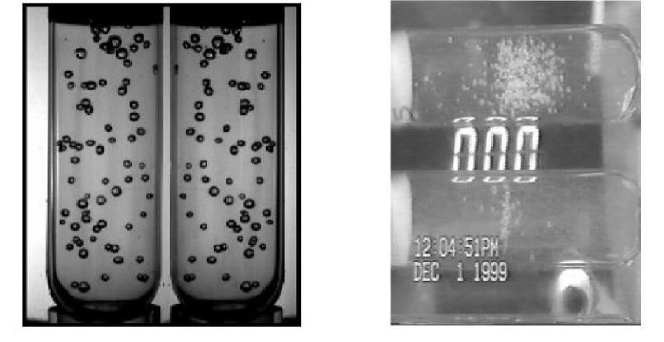
We shall present two sets of experiments during which two different kinds of bubble detectors were used: Defender and Defender XL. Their specifications are slightly different. The Defender are cylinders 19.4 long (their active part is 10 long) and with a diameter of 2.1 . Their minimum detection level is a tenth of an ounce of Plutonium in seconds at 1 meter. It was determined to be about 100 counts/ to 252Cf at 20 . The Defender XL are cylinders 47 long (their active part is 30 long) with a diameter of 5.7 . They have a sensitivity higher (by one order of magnitude) than that of the Defenders, their minimum detection level being a hundredth of an ounce of Plutonium in seconds at 1 meter. Their response was determined to be about 1000 counts/ to 252Cf at 20 ∘C. Both types of Defenders are sensitive to neutrons in the energy range between 10 and 15 , and their response is dose rate-independent and spatially isotropic. Moreover, both Defender and Defender XL are completely unaffected by gamma radiation, as stated by the manufacturer and it was experimentally checked by irradiating them with a known source of 60Co for several minutes without producing the tiniest bubble. Due to their very operation way, both kinds of Defender detectors are sensitive to ionizing radiation too. However, the morphology and the distribution of the bubbles are quite different, as shown by Fig.3 (supplied by the manufacturer, BTI). In the picture on the left one sees the effect produced by neutrons in two Defenders. The bubbles are big and spread out the whole volume. Conversely, the two detectors on the right show a different type and a different distribution of bubbles (generated by heavy ions), gathered in a cluster and much smaller than those produced by neutrons.
The CR-39 (PADC) plastic track detector is a C12H18O7 polymer with density 1.3 which is used for registration of heavy charged particles and is a very convenient mean of detection. Charged particles are registered directly, and neutrons are detected through a secondary recoil particles or nuclear reactions. The CR39 energy range sensitivity is very wide, from tens of to hundreds of . Particle tracks on the detector become visible after chemical etching and are investigated using a microscope. In order to detect neutrons by the CR39, we used the nuclear reaction (,) and hence spread a 2 layer of natural Boron (80.1% , 19.9% ) on the CR39 detecting surface which had to convert neutrons into alpha particles, following a well known technology [46, 47, 48].
Measurements of ionizing (, and ) radiation background were carried out by using three types of detectors: Geiger counter Gamma Scout [43] with a mica window transparent to , and radiation, and provided with two aluminium filters 1 and 3 thick, to screen radiation and and , respectively; polycarbonate plate detectors PDAC CR39 sensitive to ionizing radiation in the energy range 40 -4 and Tallium (Tl) activated, Sodium Iodine (NaI), -ray spectrometer GAMMA 8000 [44].
3.2 Experimental Results
3.2.1 First Investigation:Thermodynamical Detectors
Two separate investigations have been carried out. In the first one, we subjected to cavitation not only bidistilled deionized water, but also solutions of four different salts in H2O (with concentration of 1 ), namely:
-
•
250 of H2O;
-
•
250 of H2O solution of Iron Chloride FeCl3;
-
•
250 of H2O solution of Aluminium Chloride AlCl3;
-
•
250 of H2O solution of Lithium Chloride LiCl;
-
•
500 of H2O solution of Iron Nitrate Fe(NO3)3.
Each of the first four cavitations lasted 90 , while the Iron Nitrate solution was cavitated for 120 . The schematic layout of the experimental equipment is shown in Fig.4.
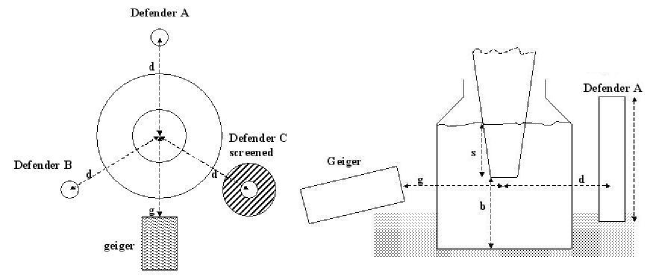
The cavitation chamber (vessel) was in the centre and the sonotrode has to be imagined perpendicular to the plane of the figure, just over the vessel and lined up with it. The immersion of the sonotrode and the distance of its tip from the bottom of the vessel were about 4 and 5 respectively. They were suitably studied with reference to the cavitation chamber, in order to maximize the concentration of energy utilized for cavitation (by taking advantage also of the pressure waves reflected by the bottom of the cavitation chamber toward the sonotrode tip, and reducing the energy dispersion in the piezoconvective motions of the cavitated liquid).
For each cavitation experiment, we used three neutron detectors Defender. They were placed vertically and parallel to the vessel or the sonotrode axis, arranged as shown in Fig.4. One of the Defenders was screened by immersing it in a cylinder of carbon (moderator) 3 thick. The Geiger counter was pointed towards the area inside the vessel where cavitation took place. A second equal arrangement of three Defenders and the vessel containing the same uncavitated solution (blank), was placed in a different room and was used to measure the neutron radiation background at the same time when cavitation was taking place. The measurements of fast neutron radiation carried out in the experiments with H2O, Aluminium Chloride and Lithium Chloride were compatible with the background level (20 ). On the contrary, in the second and the fifth experiment, with Iron Chloride and Iron Nitrate respectively, the measured neutron radiation was incompatible with the neutron background level.
Let us remark that the appearance of bubbles in these detectors can be brought about by other sources than neutrons. Since the droplets are in a metastable state, they can be turned into bubbles as they receive the correct amount of energy, which can be conveyed to them by heat and mechanical compressions, just like ultrasounds. As to heat, the Defender detectors are temperature-compensated and their correct operation is guaranteed in the range from 15 to 35 . Besides, the temperature of the laboratory (a small room) was kept constant at about by a heat pump that could work in reverse mode as well. Of course we monitored by an infrared thermometer the temperature of the Defenders all over their body and with particular care on the area nearer to the vessel that became warm during cavitation. The temperature of this specific part never exceeded 26 , which is well within the working temperature guaranteed by the manufacturer. By comparing the number of bubbles popped up during each experiment, one can unmistakably state that they cannot be brought about by heat, since the temperature increases of the solutions treated by ultrasounds in all the experiments were always compatible with each other within 5 , while the number of bubbles ranged from less than 10 up to 70. As to the second possible source of bubbles, i.e. ultrasounds, the ultrasound power and the experimental setup were the same for all the five experiments, but only in two out of five we got a neutron signal higher than the background444The neutron background measurements were carried out at the same time of the cavitation, but in a different room, by means of equal detectors placed around a similar vessel containing the same solution. The results obtained were compatible with the background. The same compatibility was found with detectors immersed in carbon both in presence and in absence of cavitation. This last result is a further confirmation of the neutronic origin of the bubble signals in the Defenders.. This evidence rules out ultrasounds as the possible cause of bubbles in the Defenders.
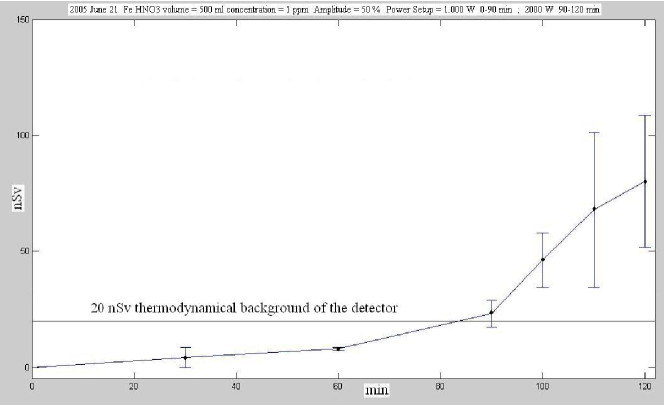
A more quantitative behavior of the phenomenon is illustrated by Fig.5 and Fig.6, which report the neutron doses in nano-Sievert as function of the cavitation time. The horizontal black line represents the sum of the measured thermodynamical instability of the detectors555Indeed, when the detectors are activated one faces an initial thermodynamical instability due to the almost sudden decrease of pressure applied to the superheated droplets dispersed in the gel. Some of them evaporate and form bubbles which have to be taken into account as a background level of blindness of the detector beyond a real, although very low, neutron background level. and of the measured neutron background level and is equal to 20 . In both graphs, the values correspond to the mean of the two equivalent doses obtained by the two defenders without moderator used during cavitation666The number of bubbles was visually determined by two of the experimenters independently and the mean value of the two counts (which were always absolutely compatible and almost always equal to each other) was taken as the number of bubbles to calculate the dose.. The error bars were determined by taking the root mean square of the differences of the two equivalent doses and the mean value.
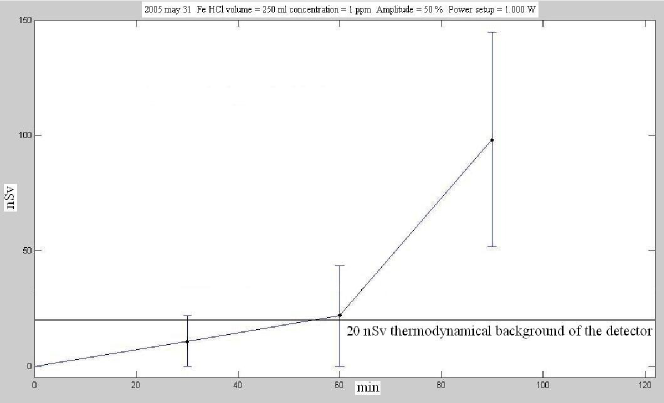
In the last thirty minutes of cavitation of the iron salt solutions, the measured dose (~100 ) was significantly higher (even 5 times) than the background. Precisely, the final measured dose was (98.50 4.5) for FeCl3 (Fig.5)and (76.00 4.5) for Fe(NO3)3 (Fig.6). Therefore, the neutron emission induced by cavitation exhibits a marked threshold behaviour in time.
The radiations , and , measured in all
the
cavitation runs, turned out to be compatible with the background radiation777This agrees with the results on the absence of radiation emission in
the first cavitation experiments [28, 29]. See
Sect.2.
Let us comment the above results. The negative outcomes of the three experiments with water, aluminium chloride and lithium chloride allow one to conclude that the neutrons emitted during the cavitation of iron chloride cannot be related to the presence of and in this experiment. As to the positive outcomes of the fifth experiment with iron nitrate, although it cannot be excluded that the neutron emission be related to the presence of nitrogen, we can certainly state that this emission took place when iron was part of the cavitated solution.
Moreover, the absence of ionizing radiation , and above the background level in all the experiments — even in those two in which we got the evidence of neutron emission — means that neutrons were produced without the usual consequent emission of gamma radiation.
One can therefore state that only the presence of iron in the cavitated solution gave rise to neutron emission (and therefore to nuclear processes induced by cavitation), but without the accompanying emission of radiation. Of course, this could mean either that gamma radiation was not emitted at all as it usually is when neutrons are emitted, or that the sensitivity of our detectors was not sufficient to reveal their slight presence. Besides, we have to point out that even if neutron emission took place without any consequent gamma radiation888A possible explanation of this fact, based on a space-time deformation of the interaction region between two nuclei[38], will be discussed in Sect.7. from nuclei de-excitation, one would expect gamma rays to be emitted from neutron capture by the proton of Hydrogen anyway.This is an issue which will certainly be addressed in future experiments.
Moreover, the increase of the derivative that appears quite evidently in the last 30 minutes of cavitation for FeCl3 (Fig.5) and Fe(NO3)3 (Fig.6). may be read as a first corroborating evidence for the phenomenological model proposed by two of us (F.C. and R.M.) [38], which assumes the existence of a threshold in power and energy (and hence time) for piezonuclear reactions to happen. In this sense, provided the ultrasonic power transmitted into the solution is higher than the required threshold [38], the emission of neutrons produced by these reactions begins only after that a certain amount of energy was conveyed into the solution or, equivalently, after a certain time interval. This will be discussed in detail in Sect.7.
Further, if the bubble collapse is the main microscopical mechanism to induce piezonuclear reactions (and hence neutron radiation) [38], then it is expected on physical grounds that the emission of neutrons does not take place as from a stable source but, conversely, it happens in bursts (as it occurs for sonoluminescence [3]). However, this consideration can be considered at this stage only as a heuristic hypothesis. We shall come back to this point in the following.
3.2.2 Second Investigation:Enhanced Thermodynamical Detectors
Since the first investigation highlighted the basic role of Iron in producing piezonuclear reactions, the second one was devoted to a systematic study of such an evidence, by using solutions with only Iron Nitrate, since it gave rise, in the previous investigation, to the maximum flux of emitted neutrons. Then, six cavitation runs (each lasting 90 ) were carried out on the same quantity (250 ) of pure water and of a solution of Fe(NO3)3 with different concentration, subjected to ultrasounds of different power. Namely, the cavitated solutions could have three possible concentrations, 0 (H2O), 1 and 10 . Moreover, the oscillation amplitude and hence the transmitted ultrasonic power took two different values, 50% and 70%, corresponding to about 100 and 130 , respectively. The energy delivered to the solution within the whole cavitation time was 0.54 and 0.70 in the two cases. In order to measure neutron radiation we employed five neutron detectors of the Defender XL type. Background neutron measurements were accomplished at the beginning of the whole set of cavitations. During each cavitation we carried out ionizing radiation measurements by two Geiger counters Gamma Scout [43] , one with no aluminum filter and the other with a 3 filter, used simultaneously. A picture and the layout of the experimental apparatus used in the six cavitation runs are shown in Fig.7.
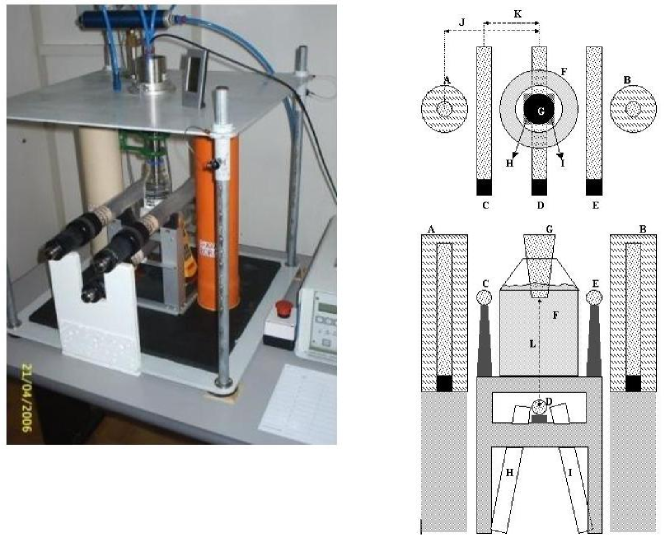
The two vertical cylinders (A and B) contained one Defender XL each, of the same type of the three horizontal ones. The detectors were surrounded, and hence screened, by 3 of Boron powder (B) (thermal neutron absorber) and by 3 of Carbon powder (A) (neutron moderator), respectively. In all of the six experiments of this second investigation, the three horizontal, unscreened Defender XL’s measured a neutron emission significantly higher than the background level. The two vertical, screened Defender XL’s (both by boron and carbon) always detected a reduced neutron dose, comparable with the background one (thus again providing further evidence of the neutron origin of the bubble signals).
For all the six experiments, we plotted the measured doses of neutrons (in nano-Sievert) as function of the cavitation time. The number of bubbles was counted every 10 . Each curve corresponds to one concentration of the Fe(NO3)3 solution, from 0 to 10 , and one oscillation amplitude (and therefore ultrasonic power), 50% (100 ) or 70% (130 ). The six graphs are reported in Fig.8.
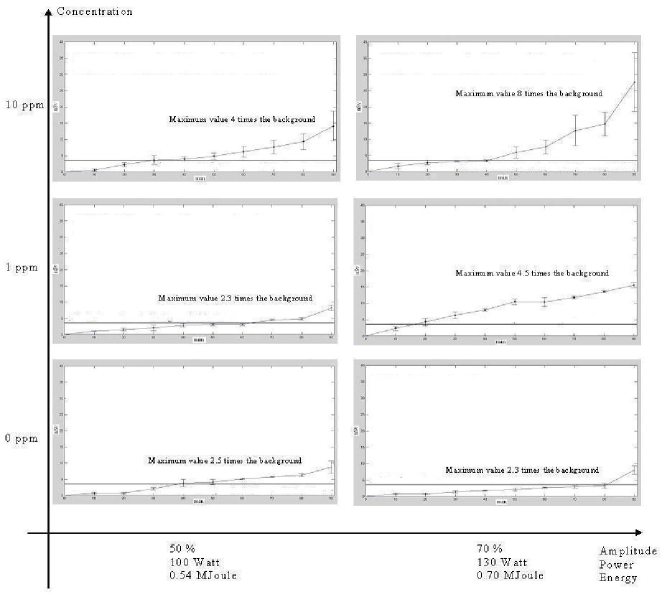
They are displaced in a Cartesian coordinate system with concentration on the y-axis and amplitude (power) on the x-axis. As in the first investigation, the horizontal black line represents the sum of the measured thermodynamical instability of the detectors and of the measured neutron background level. The six graphs of Fig.8 do not show the threshold behaviour in energy that we found in the first investigation, namely the sharp and sudden increase of the curve derivative in the last 30 minutes of cavitation. Despite that, according to our heuristic hypothesis (which will be experimentally supported in the following) about the neutron emission taking place in bursts, it will be wrong to interpret these curves as a sign of a stable neutron emission. Conversely, still considering valid this hypothesis, one can ascribe this different behaviour between the first and the second investigations to the different immersions of the sonotrode in the solution, which was about 4 (about 5 from the bottom of the vessel) in the former and only 1 (about 10 from the bottom of the vessel) in the latter. This means that both the height of the neutron peaks (bursts) and, hence, the emitted dose can be controlled somehow by this geometrical parameter. This consideration allows one to ascribe this apparent lack of threshold behaviour to the reduced height of the neutron peaks emitted during the cavitations performed in the second investigation with respect to those emitted in the first one. This reduced height spreads the neutron dose over a longer period of time, thus preventing the threshold behaviour from showing up. It will be the purpose of our future investigations to establish the time of appearance of the first neutron burst and verify whether it takes place beyond the energy (or time) threshold.
Moreover, Fig.8 further disproves the possible criticism about a possible generation of the bubbles by ultrasounds rather than by neutrons. Indeed, by looking at the compound graph and reading it along its columns, i.e. keeping the amplitude (power) fixed, it is seen that the curves are different, while the ultrasonic power is always the same. Conversely, had ultrasounds been the real cause of the bubbles, one should have had equal effects. A possible origin of the bubbles due to heath must be discarded on the basis of the precautions we took as in the previous investigation (stabilization of the laboratory temperature and check of the temperature of the body of the two Defenders XL). As a further proof against any possible influence of temperature or IR irradiation on the number of bubbles in the Defenders, we checked that at equal temperature of the solution in the vessel, and equal ultrasonic power, the bubble distribution in the Defender XL did not show any systematic concentrations (qualitatively and quantitatively in term of number of bubbles) near the warmest part of the vessel and in the surroundings where possible thermal gradients might have had some effect on the stability of the detectors.
Let us remark that in the second investigation one got evidence for neutron emission also in cavitating pure water, unlike the case of the first one. This is obviously due to the higher sensitivity of the detectors employed in the second investigation 999One has not to be surprised by the emission of neutrons from the cavitation of bidistilled deionized water since a mass spectrometer analysis of its content cleary shows that it contains every chemical element.. Such a result agrees with the indirect evidence for neutron emission obtained in the first experiment of water cavitation, in which the changes in concentration of the stable elements occurred with a variation in neutron number [28, 29].
A difference between the two series of cavitations is provided by the different amount of neutron doses in the two cases. Actually (as it can be seen by comparing Fig.8 with Figs.5, 6) the neutron doses yielded by cavitation in the experiments of the first investigation are nearly one order of magnitude higher than the neutron doses yielded by cavitation in the second one (indeed, in the last cavitation run we got a maximum of (28.0 7) ). This fact is even more puzzling since one would expect higher doses in those experiments carried out with a greater amplitude and hence higher ultrasonic power. A possible explanation can be found in the different immersion depth of the sonotrode in the solution. Indeed, the immersion depth in the first investigation, about 6 , was just chosen in order to get the cavitation process more effective. However, this circumstance needs further researches in new experiments, in which neutron emission be studied as a function of the immersion depth of the sonotrode, by investigating both how the sonotrode tip wears out (in connection with its oscillation mode, first or second Bessel harmonic) and how the piezoconvective motions of the cavitated liquid go on.
At the light of the above results, we can say that the cavitating device behaves as an ultrasonic nuclear reactor. As we have already said, we performed measurements of the ionizing radiation by means of the above mentioned (filtered and unfiltered) Geiger counters. The measured radiation was always compatible with the background level. As a further check of the absence of radiation, we carried out, in absence of cavitation and during cavitation of Iron Nitrate (70% amplitude, concentration 10 , duration 90 ), simultaneous measurements by means of the two Geigers and through a tallium (Tl) activated, Sodium Iodine (NaI), -ray spectrometer. We found again a perfect compatibility between the background spectrum and that during cavitation both for the two Geigers and for the NaI (Tl), -ray spectrometer (in spite of the neutron signal with maximum of (9.1 0.5) measured by the Defender XL’s). Thus, the results of the second investigation too provided evidence for the emission of anomalous nuclear radiation, since neutrons were not accompanied by gamma rays. The NaI(Tl) spectrometer allowed us to increase by several orders of magnitude the accuracy and sensitivity of gamma ray detection. Despite that, we need again to raise the question about the lack of gamma rays from neutron capture by the proton of Hydrogen which need to be addressed in future experiments.
The systematic analysis carried out by cavitating water solutions of Iron Nitrate, for all of which evidence of neutron radiation was gotten, shows that the phenomenon is perfectly reproducible. Moreover, we have been able, by changing the immersion depth of the sonotrode tip, to reduce the emitted neutron dose by one order of magnitude. This implies that neutron emission can be somehow controlled.
3.2.3 Further Check and Features of Neutron Emission:Polycarbonate Detectors
In the previous two investigations, the evidence for neutron emission was highlighted by means of the detectors Defender through the analysis of the bubble signals. As a further check, we carried out a further experiment utilizing not only the Defender XL’s but also boron-screened CR39 detectors.
By the same experimental apparatus used in the second investigation (see Fig.7), we subjected to cavitation 250 of a water solution of Iron Chloride (FeCl3) with concentration 10 . The cavitation lasted 90 at the ultrasound frequency of 20 , with oscillation amplitude of 70% of the maximum amplitude, corresponding to a power of 130 (namely to a total energy of 0.70 ). The choice to use again a solution of FeCl3 was due to the fact that, all the other conditions being equal, we noted that with Iron Chloride there is a higher release of macroscopic energy than with Iron Nitrate (the liquid evaporation is from 2 to 5 times that observed with the latter solution). Due to the equality of thermodynamical conditions, this cannot be explained in terms of ultrasounds only. The two unscreened lateral Defender XL’s (C and E) measured a maximum dose of neutrons of 14.5 , 4 times higher than the detector thermodynamic noise of 3.5 . Moreover, we placed, externally to the cavitation chamber, two pairs of 1 by 1 plate CR39 detectors (R,S and T,U) as shown in Fig.9.
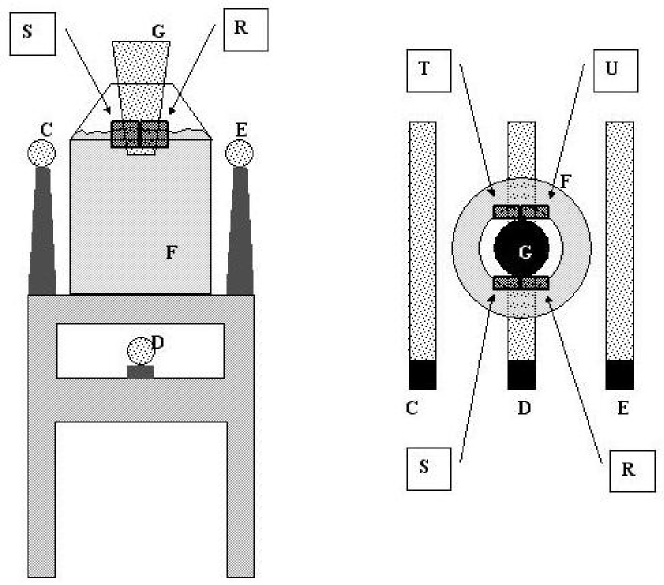
Each plate was at a distance of about 4 from the vertical axis of the cavitation chamber, at the same level of the sonotrode tip. In between the CR39 plates and the axis of the vessel there were 3.5 of solution, 2 of borosilicate glass and about either 3 of air or 3 of Boron. The two couples were diametrically opposite to each other. In each pair, a CR39 was in air (S and T), whereas the other detector was immersed in boron (R and U) (whose interaction with neutrons gives rise to alpha radiation to which CR39 are sensitive). The results obtained are displayed in the second and third row of Fig.10. By the boron CR39 we were able to detect neutrons with energies below 10 too and, above all, thermal neutrons.
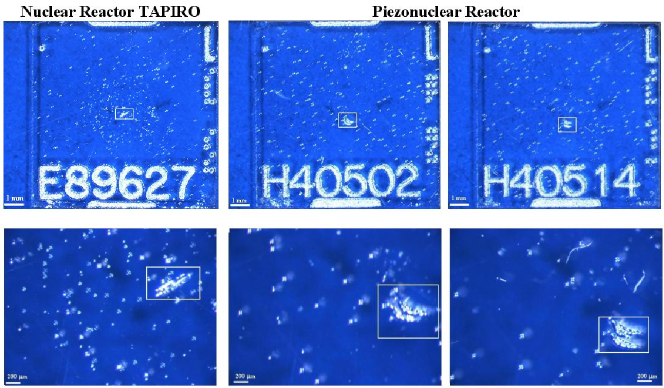
In order to have an idea of what the traces should look like on these detectors after etching, four more detectors were irradiated by neutrons using as source the fast neutron nuclear reactor TAPIRO at Casaccia ENEA Rome. The neutron equivalent dose conveyed onto the detectors was 2.1 through a diagnostic neutron channel101010Not knowing what kind of neutron spectrum to expect from the cavitated solution, as already stated, we decided to produce our comparison model of traces by a source whose spectrum were the widest possible, i.e. a nuclear reactor. According to [46] these kind of detectors can detect fast, epithermal and thermal neutrons, of course with different sensitivities . Hence the integral effect on the detectors, due to almost the whole neutron spectrum, would be traces whose quantity and shape have to be compared with those obtained from the piezonuclear reactor. Let us repeat that the main target of these investigations was to reveal the presence of neutrons in a sort of a ’yes or no’ detecting procedure.. A boron CR39 was used to measure the background level around the reactor, other two, one in air and the other immersed in boron, were placed at about 3 from the reactor core and radiated for 5 . The results are shown in the first column of Fig.10. The Boron-CR39 with code E89627 was placed with its detecting surface orthogonal to the neutron channel of the nuclear reactor TAPIRO with its centre on the channel axis. It clearly shows the expected tracks at its centre (a 50 magnification photo is presented as well for a better vision). The other three CR39 used to measure the background around the nuclear reactor do not show any thick track and the number of tracks on them is much lower than that on the E89627. The CR39 detectors with code H40502 and H40514 were used during cavitation and show tracks absolutely compatible with that produced by the neutrons of the nuclear reactor111111The chemical etching of all the CR-39 foils was carried out in a 6.25N NaOH (Carlo Erba standard) solution at 90∘C for 4.5 hours according to the specifications given by the firm FGM Ambiente which provided them..The comparison between the traces produced by neutrons in the CR39 immersed in boron in the nuclear reactor case (first column) and in the ultrasound one (second and third column) shows that their pattern (although not their extension) is perfectly similar. It is also possible to notice that the area of the thick trace produced by the reactor neutrons is about half of the areas of the thick traces produced by the neutrons generated by ultrasounds during cavitation. The Boron-CR39 detectors can reveal neutrons of any energy. While fast neutrons are not affected by Boron and leave their own traces on the polycarbonate surface, slow neutrons and, above all, thermal neutrons, are converted into alpha particles by interacting with Boron-10 (10B) (according to 10B(n,)7Li) and through this mechanism produce a much wider and deeper trace on the polycarbonate surface than fast neutrons. By using this fact and comparing the CR39 traces obtained in this experiment (compatible with equivalent doses of 4-5 in 90 minutes), with the bubble signals collected by the Defender XL’s in this same experiment (14.5 in 90 minutes), and with those by the Defenders of the first investigation (between 80 and 100 in 90 minutes), we are allowed to conclude that the bulk of the neutron emission corresponds to neutrons having energy in the low epithermal range and even lower. We believe that the outcomes shown by the photos in Fig.10 represent a fairly sound proof to corroborate our heuristic hypothesis about the emission of neutrons in bursts. Of course, the reactor channel acted as a filter which selected those neutrons with velocity almost parallel to the channel axis. In fact, the distribution of the tracks on the central part of the plate E89627 is nearly circular around the thick track, implying that the emission of neutrons from the reactor core was constant and isotropic. This is the consequence of the cylindrical channel through which it was irradiated, that produced a neutron flux with a cylindrical symmetry. On the contrary, despite the cylindrical symmetry of our experimental equipment (the vessel and the sonotrode), it is quite clear that the neutron emission during cavitation was neither constant nor isotropic. Were it isotropic, one would have got a more uniform distribution of traces and more thick traces on the CR39 plates and a more uniform distribution of bubbles in the defenders. Conversely, the other two CR39 (H40502 and H40514) do not show any particular distribution of tracks consistent with the lack of any preferred direction of neutron emission from the volume where cavitation was taking place. Despite that, on the two CR39 detectors there are two thick tracks at the centre of the chips which perpendicularly faced the centre of the cavitation volume. This difference can be considered as a strong hint to state that the neutron emission is not continuous but, conversely, takes place in bursts at different instants of time, along diverse space directions and with different height and energy spectrum (like is the case for sonoluminescence). This is obviously due to the fact that the microscopical mechanism underlying neutron emission is bubble collapse, which is governed by quite a few variables (yet uncontrolled), like bubble dimension, quantity and type of atoms on the bubble surface. We got a definite proof of the emission of neutrons in bursts in our third investigation.
3.3 Third Investigation:Electronic Detectors
Having achieved several positive evidences of neutron emission from cavitation, we decided to refine our research by performing the same measurements by a Boron Triflouride detector [33].
We cavitated 250 of a solution of Iron Chloride FeCl3 by applying to it 130 stable of ultrasonic mechanical vibration at 20 for 90 minutes, employing the same sonotrode and the same cavitation chamber of the precvious investigations. The immersion of the sonotrode in the solution was 5 121212Further details about the geometry of the sonotrode and the cavitation chamber and about their exercise are contained in three patents owned by the Consiglio Nazionale delle Ricerche (CNR) (National Council of Researches of Italy) now published in [53, 54, 55].. During cavitation, we measured neutron emission by a Wedholm Medical 2222A Boron Trifluoride neutron monitor [49] and ionizing radiation (in particular gamma radiation) by an UMo LB 1236 monitor, whose energy range is from 30 up to 2 and which gives both the equivalent dose and the equivalent dose rate in a wide range from 50 up to 10 [50]. The UMo1236 was calibrated by a Cobalt-60 standard source. The neutron monitor was calibrated by an Americium-241 Beryllium standard source131313This equivalent dose rate value is given by the manufacturer and refers to a new source. The Americium-241 Beryllium neutron source, that was used for the BF3 calibration, was a four-year old standard source which, considered that the Americium-241 half life is of 432.2 years, can be considered as new. contained within a suitable lead and steel shielding box, in order to obtain outside of it and in contact with it an equivalent dose rate of neutrons of . The BF3 neutron monitor was placed in contact with the shielding box containing the AmBe source, and its position was such to present to the neutron flux a geometrical effective surface of 142 perpendicular to it. We registered the number of counts from the BF3 within 100 seconds. Many of these counting runs were carried out (sample size 30) and we found out that the mean number of counts within 100 was 100 15 (mean standard deviation) i.e. about 1 per second (1 ). The electronic noise value 0.03 10-3 and the background flux 0.1 10-3 were summed, and the result 0.13 10-3 ) was adopted as the error to be attributed to each measured value. The layout of the experimental set-up is schematically presented in Fig.11
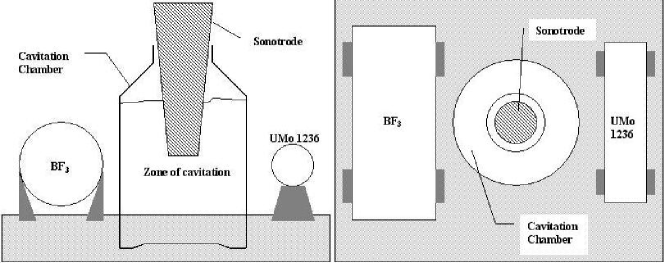
The BF3 detector was placed next to the cavitation chamber and its position with respect to the zone of cavitation where the neutrons are expected to be emitted was the same it had with respect to the AmBe source during the initial calibration tests. The gamma meter UMo 1236 was next to the bottle, diametrically on the other side with respect to the BF3. In Fig.12 we present an example of the neutron measurements carried out during cavitation, i.e. the application of ultrasounds to the 1000 solution of Iron Chloride. The BF3 measurement runs were triggered and checked by a Defender XL (not shown in Fig.11) measuring as well, and testing that the dose measured by both was the same within the errors, The pulse collecting procedure was identical to that used while measuring the background flux, i.e. registering the number of pulses accumulated within 5 minutes.
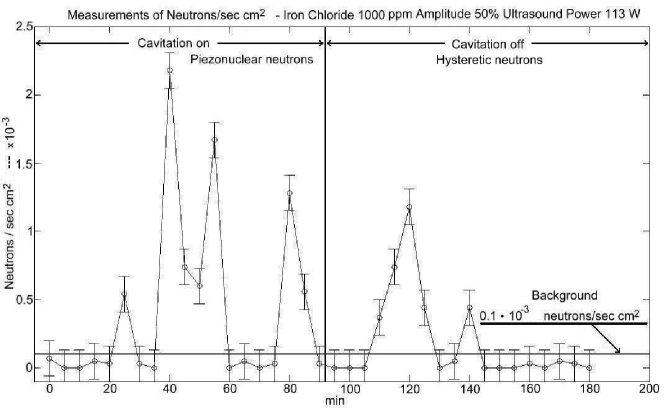
Let us analyse the results depicted in Fig.12. The graphic is divided into two parts by a vertical line (at 92 minutes instead of 90 minutes for mere visual convenience) . The left side from 0 to 90 minutes is the interval of time during which cavitation was on. The right side from 90 to 180 minutes is the interval of time during which cavitation was off, but the neutron measurement went on. On both sides, some peaks stand well above the background level, pointing out that the emission of neutrons is not constant in time, but occurs in bursts of neutrons or better in pulses, thus definitely confirming our heuristic hypothesis. Moreover, we performed a careful statistical analysis of the pulse values collected in the different cavitation runs, in order to verify that they were not normally distributed, by exploiting the graphical method called normal probability plot. The values of the flux of the neutron pulses showed in no way to have a Gaussian distribution. This shows that the neutron pulses are not equal pulses emitted at different times in different directions, but they are different indeed.
In the left side of Fig.12, the first neutron pulse occurs after 40 minutes from the beginning of the cavitation and this circumstance was the same for all the cavitation runs. More precisely, it turned out that in all cavitation runs the first neutron pulse appeared 40 - 50 minutes after switching on the ultrasounds. This is a further confirmation of the threshold behaviour in time (and therefore in energy) of the neutron emission. As to the right side of Fig.12, although the cavitation was turned off and hence one would expect that the neutron pulses would stop along with it, there are two more peaks well above the background level. These delayed pulses, emitted in all cavitation runs about 20 minutes after the cavitation had been stopped, are a hysteretic behaviour. A possible candidate explanation to this fact is that some of the piezonuclear acoustic neutrons (those emitted during cavitation) had been absorbed most likely by the Carbon contained both in the steel sonotrode and in the materials of the supporting platforms, and released after a latency (of about 20 minutes in our case), as it normally occurs in the graphite of nuclear reactors.
Before drawing some conclusions, it is worth stressing some points that, in our opinion, are important in order to create as a clear and thorough picture of this new phenomenon as possible. As is well known, there exists a phenomenon in solids called fracto-emission or fracto-fusion [51, 52] during which neutron bursts can be detected. However, in most cases the cracked solids are loaded with deuterium, which is not our case. Moreover, that our results have nothing to do with fracto-emission has been proved by the fairly large number of cavitation runs that we carried out under different conditions. Let us recall (see Subsect.3.2) that we cavitated Aluminium Chloride and Lithium Chloride solutions applying to them the same ultrasonic power (i.e. the same oscillation amplitude of the sonotrode for the same amount of time) without registering any neutron peak like those in Fig.12, so the level of the flux was always compatible with the background. Besides, we performed different cavitation runs of the same kind of solution both without changing the sonotrode and by a new sonotrode for each run, in order to test possible effects due to the sonotrode aging and damaging. No correlation of aging and damaging with neutron emission was found, allowing us to exclude any possible implication of fracto-emission.
The second experimental fact that we want to highlight is related to the association between cavitation and microscopical thermonuclear fusion occurring at the bubble collapse [9]-[17],[52]. As already stated, the solutions that we used and from which we obtained neutrons did not contain any Deuterium, but only deionized bidistilled water with some Iron Chloride or Iron Nitrate. Besides, it seems impossible to think of H2-H2 fusion, since the two solutions of Aluminium Chloride and Lithium Chloride did not produce any sign of neutrons above the background level, although the first two had the same concentration of that with Iron and all of them were treated with the same ultrasonic power for the same amount of time. The rest of the stands and racks that were used to build the experimental set-up were made of Iron, Aluminium, Polychloroprene (Neoprene), Polymethyl Methacrylate (Plexiglas) that being sold for the most different applications are not made of unstable radioactive or fissile elements or even less contain large quantities of light elements like Deuterium. Of course, it goes without saying that all the neutron and gamma laboratory background measurements were intended both to fix a level of blindness for the values that we were going to collect and also to double check the remote chance of any sort of tiny activity of the above materials. As stated above, ionizing radiation detection was carried out in parallel with neutron detection. In particular, gamma rays were monitored by the UMo 1236 detector. The neutron and gamma monitoring proceeded constantly in parallel for 180 minutes. The gamma response was both in equivalent dose rate and in equivalent dose. The variations of the gamma equivalent dose rate over 180 minutes were compared with the variations of the from the neutron detector. Particular attention was paid in order to make out possible gamma peaks around those times when a neutron pulse occurred. Neither coincidence nor correlation was found between neutron pulses and gamma equivalent dose rate and dose, which turned out always compatible with the gamma background, whose variations (of the order of (mean standard deviation) for equivalent dose rate and (mean standard deviation) for equivalent dose) had been extensively studied all over the laboratory.
Another point we want to stress is that in the experiments on liquid solutions (see Sect.3), aluminum atoms appeared at the end in a final quantity as large as about seven times the small initial quantity. More precisely, they increased from 3.99 to 27.70 , without evident reasons, if we exclude possible transmutations. Therefore, our conjecture is that the following piezonuclear fission reaction should have occurred:
| (4) |
We shall come back to this point in Sect.5.
4 Piezonuclear Reactions in Solutions of Unstable Elements: The Thorium Experiment
In all our experiments, described in the previous Section, the cavitated elements were stable. However, at the light of the results of the Russian teams, who observed the alteration of secular equilibrium of Thorium 234 due to the explosion of titanium foils in a solution of uranyl sulfate in distilled water [23]-[27], we decided to check the possible effects of cavitation on the decay of an unstable nuclide. We chose as radioactive nuclide thorium and subjected to cavitation a thorium solution in water [34].
The employed equipment was the same used in the previous cavitation experiments (see Subsect.3.1).
We prepared 12 identical solutions of in pure deionized bidistilled water (18 ), with volume of 250 and concentration ranging from 0.01 to 0.03 (part per billion). is an unstable element whose half life is = 1.9 = 9.99 . It decays by emitting 5 and 2 . The minimum energy of the alpha particles emitted is 5.3 , which is nearly equal to the energy of the ’s emitted by Radon 222. This alikeness allowed us to use the detector CR39, a polycarbonate chip commonly used to detect particles emitted by Radon 222.
Eight solutions out of the twelve at our disposal were divided into two groups of four, and each of them was cavitated for = 90 at a frequency of 20 and a power of 100 . The surface of the liquid was free. The remaining four were not cavitated, and regarded as reference solutions.
We measured the ionizing radiation in the empty Duran vessel both before and after cavitation. The radiation measurements were carried out by means of two Geiger counters with mica windows (one of which equipped with an aluminium filter 3 thick), and of a tallium activated, sodium iodine -spectrometer. The results turned out always compatible with the background level. For each cavitation run, a CR39 detector was placed inside the vessel, on its bottom, and exposed for the whole cavitation time of 90 .
The 12 detectors CR39 corresponding to the 12 solutions were examined. The traces on them were clearly recognized as produced by the radiation from decay, on a double basis. First, such a trace has a characteristic, unmistakable ”star-shaped” look, completely different from those impressed on CR39 by environmental radioactivity (e.g. ) and by cosmic rays (as well known from the use of CR39 counters in environmental dosimetry). Furthermore, as a further check, we inserted the impressed CR39 plates in the automatic counter system ”Radosys”, which stated the incompatibility of our traces with those of its database (just based on and cosmic rays).
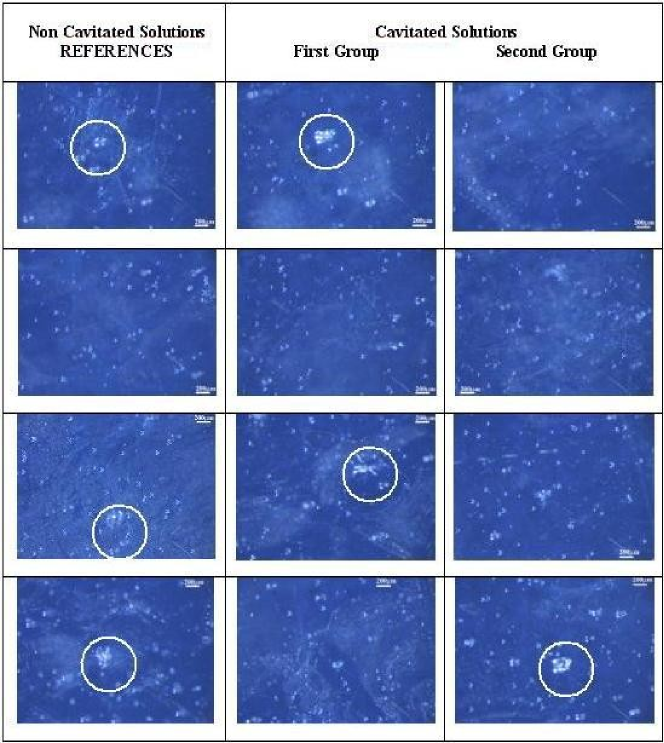
The results obtained are depicted in Fig. 13. Precisely, the first column shows the four detectors CR39 used with the four non-cavitated solutions taken as reference, whereas in the second and third columns one sees the eight detectors used with the eight cavitated solutions. The circles in the figure highlight the traces left by the particles produced by thorium decay, which were counted. On the four CR39 used with the four reference solutions one counted 3 traces of alpha particles in all. The same number of traces was counted on the eight CR39 used with the eight cavitated solutions. Of course, in absence of any anomalous behavior, one would have expected the same number of events for either uncavitated and cavitated solutions.
On the contrary, the ratio of the number of traces and the number of solutions is therefore 3/4 for the reference solutions and 3/8 for the cavitated ones. Thus, there is an evidence of reduction of the number of traces of alpha particles from thorium decay in the cavitated solutions with respect to those in the non-cavitated ones. In particular, it is evident that the above ratios show a reduction by a factor 2 in the number of traces from the former with respect to the latter.
In order to enforce the evidence obtained by the reduced statistics of the detector analysis, we analyzed by a mass spectrometer the content of of all solutions, including those providing no evidence of alpha particles from thorium decay. This was done by taking 40 for each solution, on which we carried out 4 mass-spectrometric analyses with a drawing of 20 and a scanning time of 150 . The content of (both in and in counts per second, ) found in the three cavitated solutions (whose CR39 showed the traces of the alpha particles emitted by thorium) is half of that in the three reference solutions corresponding to an -emission. This situation is reported in Tables 1 and 2. Let us notice that the samples which produced no signal in the CR39 counters did however show the same halving of thorium content.
| Table 1 - Content of in non-cavitated (reference) solutions | ||
| Mass-spectrometer analysis | ||
| Sample 1 | 287 | 0.020 |
| Sample 3 | 167 | 0.012 |
| Sample 4 | 363 | 0.026 |
| Mean values | 272.33 | 0.019 |
| Table 2 - Content of in cavitated solutions | ||
|---|---|---|
| Mass-spectrometer analysis | ||
| Sample 1 (first group) | 231 | 0.016 |
| Sample 3 (first group) | 57 | 0.004 |
| Sample 4 (second group) | 79 | 0.006 |
| Mean values | 122.33 | 0.009 |
| Ratio of mean values non-cavitated/cavitated | 2.2 | 2.1 |
These two converging evidences allow one to conclude that the process of cavitation reduced the content of in the solutions.
The dry residues of both the cavitated and uncavitated samples have been examined by X-ray microanalysis by means of an electronic microscope (because it was impossible to insert them in a mass spectrometer). However, this did not allow us to determine the thorium variation in a clear way.
The ratio between the half life of thorium, = 1.9 = 9.99 , and the time interval of cavitation, = 90 , is = 104. This means that cavitation brought about the reduction of at a rate 104 times faster than the natural radioactive decay would do.
However, it must be stressed that this does not mean at all that the radioactivity of Thorium has been increased by a factor 104. Had been this the case, one would have to observe a greater number of traces on the CR39 placed in the solutions subjected to cavitation, that does not. The concomitant absence of any variation of other ionizing radiations () (and the absence of neutrons) apparently rules out the fact that the effect of cavitation on thorium was simply to accelerate its natural decay process (although this is still an open question deserving further investigations). The most probable interpretation is assuming that thorium underwent other kinds of transformations of piezonuclear origin, like nucleolysis or nucleosynthesis. Anyway, we can conclude that our results do support the Russian findings about the alteration of the secular equilibrium of thorium, and give further evidence of piezonuclear effects.
Thanks to some comments on this experiment raised by two research groups[68, 69], we had the chance to clarify some points and add some more comments and remarks of our own[70, 71]. A remark was about the limited collection of experimental evidences[68] and hence a limited statistical analysis. Although this is true, it was not our aim to carry out a precise inferential statistical analysis in order to ascertain with a very low level of significance if the reduction of radioactivity observed in the cavitated samples were due not to chance, but to cavitation itself[70]. To our knowledge, this experiment is the first one to treat by ultrasounds and cavitation radioactive elements and it goes along with the evidences of the Russian team[23, 24, 27]. Actually, our paper must be inserted in the context of the evidences from other analogous experiments, in which cavitation was shown to induce “anomalous” nuclear effects. A further remark was raised by pointing out the failures of Marie Curie who, at the beginning of the last century, attempted to accelerate the decay of Radium[69]. However, by carefully looking at the experimental conditions where all of these anomalous effects (anomalous transmutations, emission of neutrons from Iron, and all of the evidences collected in 20 years of low energy nuclear reactions[28, 29, 30, 31, 32, 33, 52]) take place and from some of the predictions of our theory[37, 39], one understands that these phenomena need very precise local condition, in terms of energy density and time of release of this energy, which are not easy at all to be simultaneously achieved. From this perspective, the attempts to speed up alpha emission carried out between the end of the XIX and the beginning of the XX century were very unlikely to be systematically successful because of the difficulty to make out these effects among other more evident phenomena. Other remarks hypothesized that the decreasing of Thorium was due to the depositing of it on the lateral and bottom surfaces of the cavitation chamber or even the lateral surface of the sonotrode[69]. This circumstance was rebutted by pointing out that the geometry of the cavitation chamber induced convective flows that prevented Thorium atoms or compounds from being adsorbed[71]. A further remark concerned the star shaped tracks on the CR39 and the impossibility to have this shape during cavitation[69]. In[71] it is possible to find the details of the measurement procedure that explains why the star shaped tracks are possible. Before moving to the next subject, we would like to point out that a Canadian team[72] attempted to repeat our experiment but the experimental setup, that they used, had nothing to do with ours and in[73] we explain why this experimental setup is completely unsuitable to produce the anomalous effects that we have collected so far like those about Thorium.
5 Piezonuclear Reactions in Brittle Fracture of Solids
In Sects.2-4 we have seen that in our experiments [32]-[34] the pressure of ultrasonic waves in a liquid causes the cavitation of the gasses dissolved therein, with the ensuing production of piezonuclear reactions and neutron emissions, provided that a given time (and energy) threshold is overcome. Such a phenomenon is naturally associated to collapse of the imploding bubbles [38, 39].
It was then hypothesized that the fracture of solid materials would be able to reproduce the cavitation conditions of liquids and hence lead to the production of piezonuclear reactions, provided that the materials were properly selected. In this case, one expects that the role of cavitation and the induced bubble collapse is played by the compenetration of molecular layers.
Accordingly, tests were conducted to assess neutron production from piezonuclear reactions in solids subjected to compression till failure [35, 36].
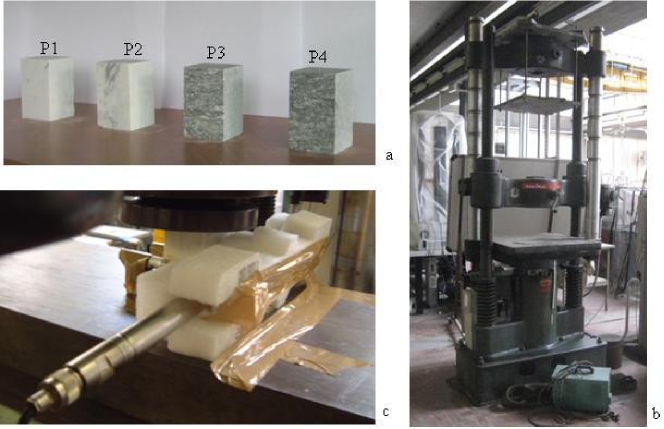
The materials selected for the tests were Carrara marble (calcite) and green Luserna granite (gneiss). This choice was prompted by the consideration that, test specimen dimensions being the same, different brittleness coefficients [56] would cause catstrophic failure in granite, not in marble. The test specimens were subjected to uniaxial compression to assess scale effects on brittleness [57]. Four test specimens were used, two made of Carrara marble, consisting mostly of calcite, and two made of Luserna granite, all of them measuring 6x6x10 (Fig.14 a). The same machine was used on all the test specimens: a standard servo-hydraulic press with a maximum capacity of 500 , equipped with control electronics (Fig.14 b). This machine makes it possible to carry out tests in either load control or displacement control. The tests were performed in piston travel displacement control by setting, for all the test specimens, a velocity of 10-6 during compression. Neutron emission measurements were made by means of a helium-3 detector placed at a distance of 10 from the test specimen and enclosed in a polystyrene case so as to prevent the results from being altered by acoustical-mechanical stresses (Fig.14 c). During the preliminary tests, thermodynamic neutron detectors of the bubble type BD (bubble detector/dosimeter) manufactured by Bubble Technology Industries (BTI) were used, and the indications obtained persuaded us to carry on the tests with helium-3 detectors.
5.1 Experimental set-up
The servo-controlled press employed works by means of a digital type electronic control unit. The management software is TestXpertII by Zwick/Roel, while the mechanical parts are manufactured by Baldwin (Fig.14 b). The force applied is determined by measuring the pressure in the loading cylinder by means of a transducer. The margin of error in the determination of the force is 1%, which makes it a Class 1 mechanical press. The stroke of the press platen in contact with the test specimen is controlled by means of a wire type potentiometric displacement transducer.
The neutron detector used in the tests was a helium-3 type with electronic of preamplification, amplification and discrimination directly connected to the detector tube, which is of the type referred to as “long counter”. The helium-3 gas supplies the neutron detection signal through the phenomenon of recoil protons from the anelastic scattering of the neutrons against the nuclei of the helium-3 atoms; the protons supply the electric signal which is read by the electronics equipping the detector. The neutron background was measured at 600 time intervals to obtain sufficient statistical data with the detector in the position shown in Fig.14 c. The average background count rate was , corresponding to an equivalent flux of thermal neutrons of .
5.2 The tests
Neutron emissions were measured on four test specimens, two made of
marble,
denoted with P1, P2, and two of granite, denoted with P3, P4 (see Fig.14 a). The test specimens were arranged with the two smaller
surfaces in contact with the press platens , with no coupling
materials in-between, according to the testing modalities known as
“test by means of rigid platens with
friction”. The mass and density of each marble and
granite test specimen are given in Table 3.
| Table 3: Physical characteristics of the test specimens. | ||||
| Test specimens | Dimensions [] | Material | Weight [] | Density [] |
| P1 | 6x6x10 | Carrara marble | 950 | 2.64 |
| P2 | 6x6x10 | Carrara marble | 946 | 2.62 |
| P3 | 6x6x10 | Luserna granite | 882 | 2.45 |
| P4 | 6x6x10 | Luserna granite | 836 | 2.32 |
The electronics of the neutron detector were powered at least 40 minutes before starting the compression tests to make sure that the behaviour of the device was stable with respect to intrinsic thermal effects. Then, background measures were repeated for 600 to make sure there were no variations. The acquisition time was fixed at 60 and the results of count rate measurements are given in Figs.15-18 together with the diagrams of the force applied to the test specimens as a function of the time elapsed since the beginning of its application.
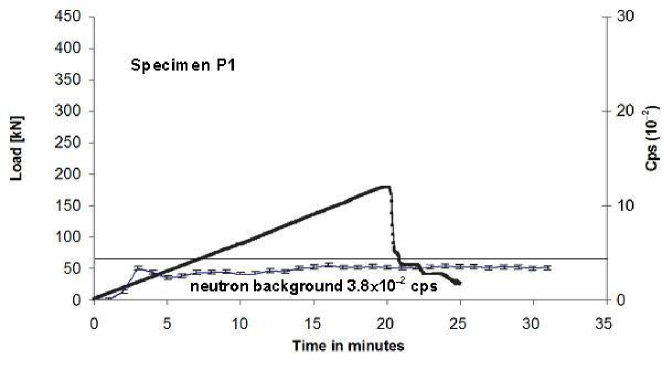
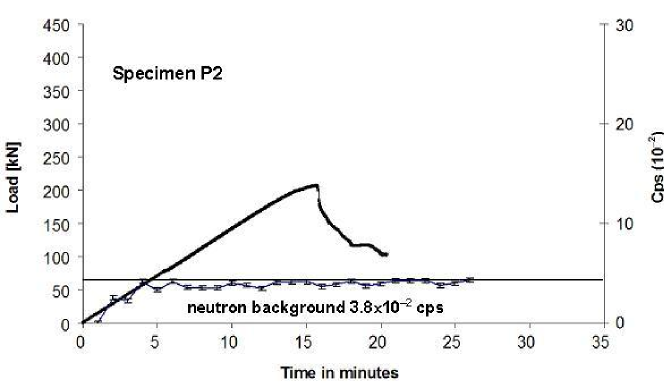
5.3 Neutron Emission Measurements
The measurements of neutron emissions obtained on the marble test specimens yielded values comparable with the background, even at the time of test specimen failure. The neutron measurements obtained on the two granite test specimens, instead, exceeded the background value by about one order of magnitude at the test specimen failure.
After 20 , test specimen P1 reached a peak load of ca 180 , corresponding to an average pressure on the bases of 50 ; after 15 , test specimen P2 reached a peak load of ca 200 , corresponding to an average pressure on the bases of 55.6 .
Test specimen P3 reached at time T(P3) = 32 a peak load of ca , corresponding to an average pressure on the bases of 111.1 . When failure occurred, the count rate was found to be , corresponding to an equivalent flux of thermal neutrons of
Test specimen P4 reached at time T(P4) = 29 a peak load of ca 340 , corresponding to an average pressure on the bases of 94.4 . When failure occurred, the count rate was found to be , corresponding to an equivalent flux of thermal neutrons of
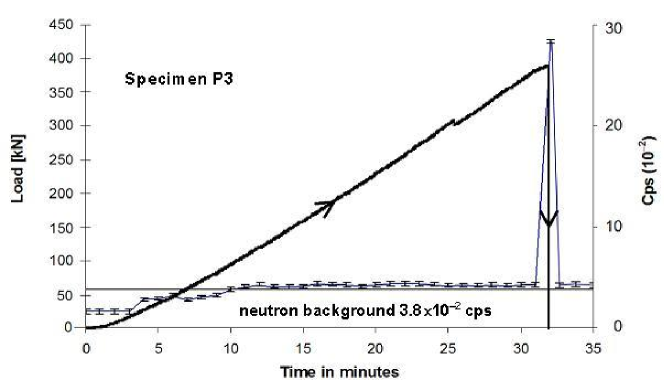
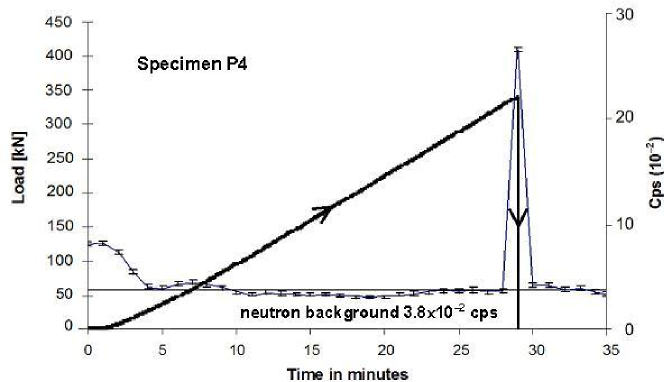
Notice how the above neutron measurements occurring in P3 and in P4 failure are well beyond the background interval and how the value obtained on P3 is greater than the value measured on P4. We believe that this event, albeit with the due caution, may be ascribed to the unstable failure of these test specimens and the greater quantity of energy released by P3 compared to P4 at the time of failure. Figures 15-18 summarise the evolution of the neutron count rates together with the load vs. time curves for the four test specimens.
5.4 Analysis of the Results
5.4.1 Factors Involved in Controlling Rock Failure
Experimental data from rocks tested in compression generally indicate that this is a brittle material, since it exhibits a rapid decrease in load carrying capacity when deformed beyond a peak load. When the softening diagram is very steep, or even shows simultaneously decreasing strain and stress values, the material is said to present a snap-back or catastrophic behaviour (cusp catastrophe). This is in contrast with ductile materials which retain considerable strength beyond the peak.
Even though in the post-peak phase the load-carrying capacity of the material may decrease considerably with increasing strain (i.e. the material “softens”), in actual practice this behaviour can be important to the overall performance of a rock or concrete structure.
In laboratory studies, the external loading system is the testing machine. Depending on its design, the machine may have a relatively soft or stiff characteristic compared to the test specimen. A stiff frame and electronic servo-controls are required in order to observe the post-failure behaviour of brittle materials [58].
By programming a linear increase in axial displacement with time, the complete stress-strain curve for rock is obtained (Fig.19). Generally, strains increase linearly with time even though the specimens fail and the system undergoes a progressive reduction in load-bearing capacity during the process. Such specimens are said to exhibit stable failure characteristics.
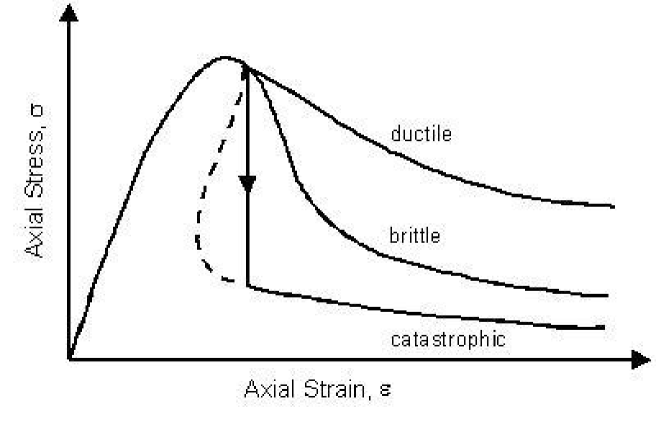
However, if the complete stress-strain curve does not monotonically increase in strain, the linear increase can only be achieved along the OACDE curve shown in Fig. 20. Since the material behaviour is represented by the OABDE curve, excess energy, proportional to the shaded area, is released by the specimen and the result is uncontrolled violent failure. Such specimens are said to exhibit unstable failure characteristics.
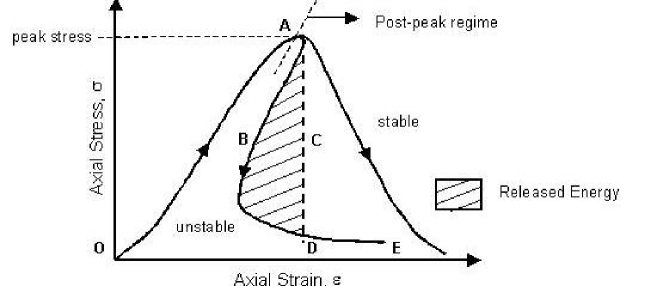
For both traction and compression behaviours, the size-scale transition from ductile to brittle behaviour is governed by a nondimensional brittleness number, , which is a function of material properties and structure size-scale [56, 57].
Stable and unstable behaviours, although some materials are intrinsically more brittle than others, both depend on the specimen size and shape [56, 57, 59, 61]. In general, it can be stated that energy release modalities during compressive tests depend on the intrinsic brittleness of the material of the test specimens, as well as on test specimen dimensions and slenderness. Furthermore, it may be assumed that energy release rate also depends on the velocity setting of testing machine piston travel.
5.4.2 Discussion and Remarks
In this study, all compression tests were conducted through feedback control of the axial displacement of piston travel on test specimens having the same dimensions. The complete specimen collapse process was observed only for P1 and P2 marble specimens, whose behaviour was seen to be ductile compared to the brittle catastrophic failure behaviour displayed by granite specimens P3 and P4. For the latter two, in fact, failure occurred instantaneously, without showing the descending branch of the load-time curve.
By taking into account only the positive derivative branch of the
load-time curves, from the evolution of the load in the four test
specimens it can be
seen that failure occurs when peak compressive load is reached (Figs. 15-18). The elastic strain energy accumulated in the test
specimens up to failure, , is given in Table 4.
| Table 4: Elastic strain energy at the peak load, . | ||
| Test specimen | Material | |
| P1 | Carrara marble | 124 |
| P2 | Carrara marble | 128 |
| P3 | Luserna granite | 384 |
| P4 | Luserna granite | 296 |
As we shall see in the following Section, for each test specimen it is possible to draw some conclusions on the release rate of the elastic energy accumulated, considering that granite displays brittle, catastrophic failure behaviour, while marble is characterised by a more ductile behaviour. This will allow us to theoretically explain the different behaviour of specimens P1 and P2 with respect to P3 and P4 as far as neutron emission is concerned.
This experiment clearly shows that piezonuclear reactions giving rise to neutron emissions are possible in inert non-radioactive solids, in addition to liquids. In Sect.7 it will be seen that in this case, too, the emission of neutrons is related to a definite behaviour in energy and time [38, 39].
Another factor to be taken into account is the composition of the materials in which piezonuclear reactions may be produced. It should be noted, in fact, that Carrara marble is basically made of calcite, i.e. a crystalline form of calcium carbonate CaCO3, whereas in general granite is made of quartz, alkaline feldspar, plagioclasium and even biotite and horneblend, of which the last two minerals contain iron in greater or lesser quantities. The fact that the marble used in the tests did not contain iron, and granite instead did, could be another factor contributing to the phenomenon in question, by analogy with the case of piezonuclear reactions in liquids. In fact, we have seen in Sect.3 that piezonuclear reactions with neutron emissions were obtained in liquids consisting of iron chloride or iron nitrate subjected to ultrasounds and cavitation.
6 Coherence with the Results of other Experiments
As we have seen in Sects.2,3, our cavitation experiments evidenced two kinds of phenomena: transformation of nuclides ([28]-[31]) and neutron emission ([32, 33]). Let us discuss such findings in connection with the results of other experiments.
As to nuclide production, the findings of such experiments (in particular of the first one [28, 29]) are similar under many respects to those obtained by Russian teams at Kurchatov Institute and at Dubna JINR [23]-[27] in the experimental study of electric explosion of titanium foils in liquids. In a first experiment carried out in water, the Kurchatov group [23, 24] observed change in concentrations of chemical elements and the absence of significant radioactivity. These results have been confirmed at Dubna [25]. Subsequently, the experiments have been carried out in a solution of uranyl sulfate in distilled water, unambiguously showing [26] a distortion of the initial isotopic relationship of uranium and a violation of the secular equilibrium of 234Th (as already recalled in Sect.4). Further experiments are presently being carried out at the Nantes GeM laboratory, and their preliminary results are in agreement with those obtained by Urutskoev et al.[62]. Due to the similarity of such results with ours, in our opinion the two observed phenomena have a common origin. Namely, one might argue that the shock waves caused by the foil explosion in liquids act on the matter in a way similar to ultrasounds in cavitation. In other words, the results of the Russian teams support the evidence for piezonuclear reactions141414Another possible interpretation proposed for such phenomena (at least for the titanium foil explosion) is in terms of the light magnetic monopoles introduced by Lochak [63].. A confirmation of this hypothesis comes from the Thorium experiment we carried out (see Sect.4).
As to neutron emission, we already quoted the Oak Ridge experiment [9, 10, 11, 17] on possible nuclear fusion in deuterated
acetone subjected to cavitation. The measured neutron flux was said
to be compatible
with d-d fusion during bubble collapse. Some authors disclaimed the results [12], others conversely confirmed them [13, 16]. As to
what the results of our investigations are, one would not be
surprised of the controversial results and hence opinions on the
outcomes of the Oak Ridge experiments [9, 10, 11, 17].
Our outcomes show that neutron emission is obtained by cavitating
solutions containing Iron and, even if in a very small quantity, by
cavitating pure water. Hence the effects, that we measured, must be
brought about by almost thoroughly unknown mechanisms which are
triggered by pressure. With this in mind, we believe that whoever
tried to reproduce the Oak Ridge experiments must have faced unusual
behaviours and results since along with the very well known and
expected neutrons from D-D fusion, other unknown effects — like
the existence of a time (energy) threshold for neutron emission —
would be superimposed, thus generating confused results which do not
precisely confirm the common phenomenological predictions about
fusion.
Let us stress once again that the experiments [9, 10, 11, 17] belong to the research stream known as
sonofusion (or
acoustic inertial confinement fusion). It amounts to the attempt to produce known nuclear reactions by means of ultrasounds and
cavitation. Conversely our case is completely different. We produced
new nuclear reactions (piezonuclear reactions) that involve
heavy nuclei but do not, apparently, affect Hydrogen or light ones
(at least within 90 minutes) under unusual conditions, like the
existence of an energy threshold for these reactions to happen and
the apparent lack of gamma emission concomitant to neutron emission.
Our experiments seem also to have some relations with the research on low energy nuclear reactions (LENR) or condensed matter nuclear reactions [52]. In many of such experiments, neutron emission was observed without apparent concomitant emission of rays. We shall discuss in more detail this point elsewhere[64].Let us only quote for instance the recognition of the important role played by the CR39 detectors in
evidencing neutron traces [65].
7 Phenomenological Model of Piezonuclear Reactions
In this Section, we want to propose a possible mechanism able to account for piezonuclear reactions, that is constituted by the integration of two parts. One is essentially classical in nature, and based on the well-known fact that cavitation allows one to achieve an extreme concentration of energy for unit time in the collapsing bubble [4, 5]. The other, non-classical one relies instead on a phenomenologically grounded formalism of local Lorentz invariance breakdown, mathematically based on a deformation of the Minkowski space-time [37, 39].
7.1 Classical Cavitation Model
Let us first consider the case of the experiments in cavitating water.The fundamental and intriguing question to be put is: How can the pressure waves generated by cavitation trigger nuclear reactions? The answer comes possibly from the well-known fact that cavitation allows one to achieve an extreme concentration of energy for unit time in the collapsing bubble. Indeed there exist speculations on the possibility that cavitation (in particular, sonoluminescence) might be a viable approach to inertial-confinement fusion (provided that the temperature attained in the process is substantially higher than that predicted by a simple thermal model, namely 104 ) [4, 5]. Let us illustrate a classical model of piezonuclear reactions, based on the above features of the cavitation process.
In order to explain how cavitation can produce the energies needed to induce nuclear fusion, let us take into consideration the physics underlying the cavitation process. It consists, as is well known, in the implosive collapse of a gas bubble within a liquid under suitable pressure conditions. In our case (water sample) the speed of sound is about 103 , which — on account of the used frequency 104 — corresponds to a wavelength 10. In order to get the gas bubble to implode, the plane pressure wave of the ultrasounds must be converted into a symmetric spherical shock wave on the bubble surface (see Fig.21).
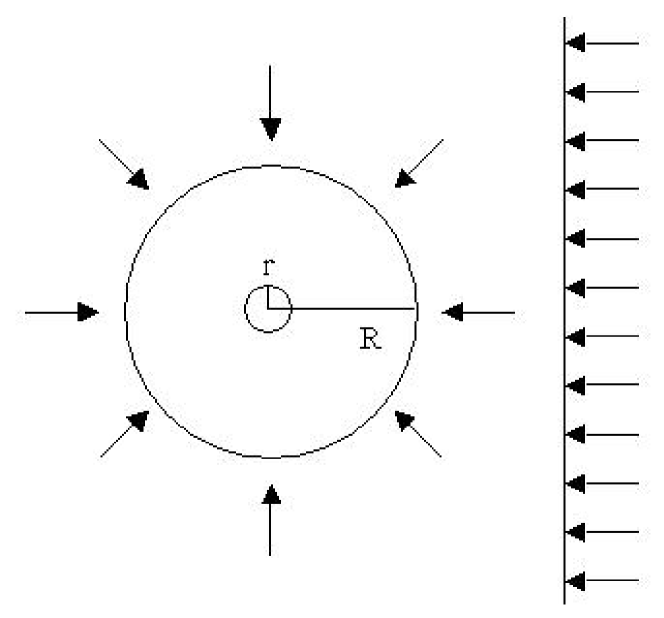
Therefore, the condition to be satisfied for an implosive collapse is that the wavelength must be much greater than the bubble size. Taking as example a spherical bubble with radius , this means . Since the size of a bubble subjected to cavitation is of the order of magnitude = 10-6 (see refs.[38, 39]), the collapsing condition is respected in all the three experiments.
We now remark that — contrary to what previously believed — the only atoms influenced by the shock wave producing the cavitation are the ones lying on the surface of the bubble itself. These atoms are trapped by the surface tension of the bubble (generated by the combined electrostatic repulsion of the liquid and of the bubble) in a double-layer film at the border liquid-bubble. Namely, all other atoms inside the bubble volume escape to the outside during the collapse, due to the fact that the inner pressure, corresponding to the saturated vapor pressure of water, is far lower than the external pressure. The trapping of atoms at the bubble surface is expected to be more effective for metals. Indeed, it is known that usually metals and metal cations do not enter the cavitation bubble, but stay at the interface between bubble and bulk solution. At room temperature (300 ) — as it was the case of all experiments — the saturated vapor pressure of water is 0.02 , whereas we estimated that the pressure induced by the implosive shock wave, for a transmitted power of 100 is of the order of 109 . This circumstance entails that there is no limit to the spatial size attainable by the collapse. It is therefore reasonable to hypothesize that the lower limit of this size can be identified with the nuclear size. As a matter of fact, there is in literature no experimental information on the value of the minimum size attained by a collapsing cavitation bubble. Therefore, we can suppose that at the end of collapse the bubble dimensions become near to the nuclear dimensions, commonly about 10 (Fermi radius).
As stated before, if the wavelength of the plane pressure wave satisfies the condition , where is the bubble radius, the plane pressure wave becomes a spherical shock wave symmetrically acting on the bubble. Let be the power of the plane pressure wave, and , the radius of the bubble before and after collapse, respectively. Then, the power density on the bubble before and after collapse are /(4) and /(4). If the initial energy flux (i.e. the energy for unit time and unit surface) is conserved (due to the continuity equation and to energy conservation), we have
| (5) |
where is the amplification factor.
As a consequence, the power density on the bubble surface, generated by the power of the plane pressure wave, produces after implosion a power density increased by the factor on the reduced bubble surface. Such a factor, caused by the implosion, ranges from 108 (when the bubble collapses to the atomic size, = 10-8 ) to 1018 (collapse to nuclear radius, = 10-13 ). In the three experiments we used powers ranging from 100 to 630 , i.e. from 6 1020 to 4 10. Thus the final power density for collapse to the nuclear radius is 21046 , corresponding to an equivalent temperature (for a low-density plasma) of at least 1020 . We think that this power density allows a heavy-ion-fusion-like process between two parent nuclei to generate a son nucleus. When the bubble collapses and the bubble surface shrinks to the nuclear dimensions, trapped atoms do move together with the surface and come closer and closer. The collapsing surface of the bubble acts therefore as an ”inertial accelerator” of neutral atoms and the squeezing of the surface to the nuclear dimension produces on the bubble surface the energy required to activate the fusion151515The fact that the collapsing bubble surface is responsible for the nuclear reaction ignition is confirmed by the evaluation of the number of interacting atoms, endowed with the velocity required to overcome the internuclear Coulomb barrier, present on the bubble surface for a given overpressure. Indeed, it can be shown that this number is incompatible with the number of atoms inside a (even rarefied) bubble (see ref.[38]).. At the final stage of this process, atomic electrons are stripped away, and a kind of heavy-ion cold fusion (in the sense of Oganessian [66]) can occur.
7.2 Application to Europium
Let us apply the model discussed above to the fusion of europium, in order to explain the results of the third experiment (see Subsect.2.3). Possible candidates as parent nuclei for are and . A feasible reaction scheme could be:
| (6) |
Where the nuclides and could come from? A possible answer to this question can be found in the impurities lying on the surface of the sonotrode tip. The latter was shaped through mechanical tools (lathes) made by alloys of iron, vanadium and zirconium, introduced to harden the tools themselves. During the manufacturing, small numbers of atoms should remain trapped inside the iron lattice of the sonotrode tip. Impurity atoms are more loosely bond to the iron lattice than the iron atoms, so the ultrasonic vibrations of the tip can remove them from the lattice. By the way, the possibility of the neutron excess (see refs.[28]-[31]) could be explained by the observations already made by other research groups working on cavitation-induced nuclear reactions [9]-[18].
The Coulomb barrier against fusion for (=40, =90) and (=23, =51) can be evaluated by the formula
| (7) |
or also by
| (8) |
with (where =4.5 10-13 and =3.7 10-13 are the nuclear radii of and , respectively, and = 0.5 10-13 is the characteristic Bohr-Wheeler nuclear length).
From the power density on the bubble surface after collapsing from a radius of 10-4 to the nuclear radius estimated above, it is possible to evaluate the energy and the energy per nucleon needed to bring about the formation of europium 138 from vanadium and zirconium according to reaction (6).
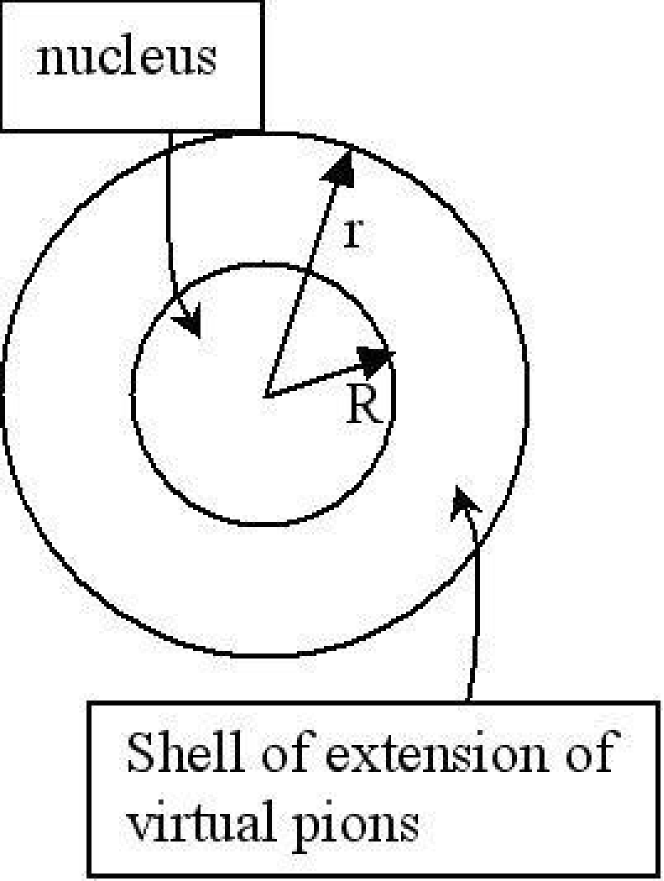
With reference to Fig.22, let and be, respectively, the radius of the nucleus and the radius of the shell of extension of the virtual pions. One has
| (9) |
Then, the effective nuclear radius is given by
| (10) | |||||
The effective nuclear surface is therefore . For vanadium and zirconium one gets, respectively:
| For vanadium: | |||||
| For zirconium: | (11) |
The mean value is .
In order to find the energy achieved in this case, the collapse time of the bubble must be estimated. For an employed frequency =20 , the period is = 510. The collapse time is obviously comprised between (upper limit) and the time taken by the pressure wave to travel the bubble radius (at the sound speed): . In deionized and bidistilled water, the sound speed is 1.4103 . This corresponds to the lower time limit for collapse = 710. The energy transmitted by the bubble implosion to the system is therefore
| (12) |
One gets
| (13) |
The total number of nucleons is =90+51=141. Thus the energy for nucleon ranges in the interval
| (14) |
Let us notice that is much higher than the maximum estimated Coulomb barrier for the europium formation. Moreover, the range of values of corresponds to the energies of the direct nuclear reactions induced by photons and to the production of pairs due to photon conversion in the nuclear electric field, many orders of magnitude higher than the energy required to overcome the Coulomb barrier.
Then, one can conclude that the mechanism proposed for piezonuclear fusion is able indeed to account for europium formation generated by the cavitation process.
The simple phenomenological model discussed above may of course be also responsible of the results we got in the first two experiments (see Sect.2). In this case, the atoms of some elements (the decreasing ones of the first experiment) may have been subjected to the inertial-fusion-like process due to bubble collapse to generate new elements (the increasing ones and/or the transuranic elements observed in the second experiment).
Moreover, this mechanism avoids the need for the introduction of a nuclear shape deformation, invoked sometimes to increase the nuclear tunnelling probability. We remind, to this regard, that and are typically spherically shaped nuclei, at least in their fundamental state, so that a shape deformation would be very difficult to justify.
On the other hand, an Oganessian-like low temperature heavy ion nuclear fusion [66] could be possible even by the following mechanism. Let us suppose that there be some kind of oversaturated vapor of the -meson (boson) gas, caused by the final power density, all around the parent nuclei. The -mesons are emitted, but they are absorbed more slowly — as if they would condensate (something like a Bose-Einstein condensation) —, typically after a time which, on the basis of the previous values of the energy-space-time density, we estimate as 10-16 (to be compared with the typical nuclear time of 10-23 sec.). As a consequence, the probability of nuclear interactions is enhanced and there is an anomalous increase of the nucleus-nucleus cross section.
7.3 Limits of the Classical Model:the Issue of Spontaneous Fission
In spite of its effectiveness in accounting e.g. for the europium production, the classical model illustrated above suffers from some drawbacks we are going to discuss.
First of all, it must be noticed that not all of the power from the sonotrode is concentrated in one bubble of nuclear dimension. Also, much of the power put in is dissipated in other processes (in fact, energy is subtracted e.g. by sonoluminescence and by endothermic sonochemical reactions. This could be taken into account by an approximated energy efficiency factor, useful for non-sonochemical reactions; the latter are to be identified with those reactions that involve parent nuclei to generate composite nuclei with a greater mass. Moreover, a crucial parameter is just represented by the final size reached by the implosed bubble, which critically determines the energy available for the fusion (or fission) process.
Another intrinsic limit of this model is due to the very phenomenology of nuclear fusion of heavy nuclei. At energies below the barrier, the fusion probability is low and rises exponentially with energy. At energies just above the barrier, the probability for parent nuclei to fuse and form a composite nucleus does increase further but not indefinitely. As a matter of fact, at energies of about 10 per nucleon, the cross section for forming a composite system is low and diminishes at a rate of 1/ (where is the center-of-mass energy of the relative motion of the two nuclei). Such a decrease occurs because the composite system (for instance, ), formed at such high relative energies, is a highly excited nucleus and has large angular momentum. This causes the composite system to fission instantaneously (with a time frame much shorter than 10-22 ). For nuclear collisions at the energies we estimated, the fusion does not occur at all.
7.4 Deformed Spacetime of Strong Interaction
A possible answer to both these questions may come from the formalism of Deformed Special Relativity (DSR). It is a generalization of Special Relativity (SR) based on a ”deformation” of Minkowski space-time, assumed to be endowed with a metric whose coefficients depend on the energy of the process considered [37, 39]. The DSR formalism provides a geometrical description of the four fundamental interactions (electromagnetic, weak, strong and gravitational), in terms of phenomenological deformed metrics with a threshold behaviour. In particular, the nuclear strong metric reads
| (15) |
| (18) | |||
| (19) |
| (20) |
| (21) |
with
| (22) |
where is the Heaviside theta function, and is the energy value at which the metric parameters are constant, i.e. the metric becomes Minkowskian.
Let us explicitly notice that the hadronic metric (15)-(19) is not always isochronous with the usual Minkowski metric . Actually, it follows from (16) that it is for .
Such a case is not new; indeed, as is well known, the same happens for the gravitational interaction, as shown e.g. by the various measurements of red or blue shifts of electromagnetic radiation in a gravitational field, or by the relative delays of atomic clocks put at different heights in presence of gravity.
Let us investigate the possible implications of such an anisochronism of the hadronic metric. We denote by the time interval taken by a certain hadronic process for a particle at rest (”hadronic clock”) The same process, when referred to a Minkowskian electromagnetic metric, will take a time to happen. The former time corresponds to the real time felt by the particle in its local frame, namely to the proper time in the Minkowski space deformed by the strong interaction. The latter is the coordinate time of an external observer, who looks at the process by means of his electromagnetic instruments161616The interpretation of as the coordinate (Minkowskian) time is supported also by the fact that the energy of an hadronic process is in general much higher than the electromagnetic energy threshold , and therefore the e.m. metric is fully Minkowskian.. The two times are related by the equation
| (23) |
Such relations is analogous to that between proper time and coordinate time found in General Relativity ()171717Indeed, since , the general-relativistic relation for becomes exactly the DSR relation (20).. In the DSR case, too, the proper time does not coincide with the time measured by the local observer in the particle frame. Like in GR, therefore, one has to distinguish between the real (proper) time and the coordinate (or universe) time . As is well known, such a distinction is fundamental, within GR, for the analysis of gravitational phenomena (like gravitational collapse). The situation reminds that of the gravitational fall of a particle toward a collapsing body. In that case, the proper time is the real time measured by the particle (influenced by the body gravitational field), whereas the coordinate time is that measured by a distant observer in fully Minkowskian conditions. Therefore, and are related by
| (24) |
or, on account of the explicit form the strong metric (16):
| (25) |
Eq.(22) provides the law of time deformation in a hadronic field. It is easily seen that there is isochronism at low energies.
Let us recall that the energy attained for collapse of a cavitating bubble to the nuclear radius ranges in the interval between 10 and 1011 . Then, is about one order of magnitude higher than the threshold energy of the DSR strong interaction, 4105 . This entails that the hadronic interaction between nuclei occurs in the non-Minkowskian part of the strong interaction metric, i.e. the (hadronic) space-time geometry is deformed in the final collapse region. As already noted, in the (usual) flat Minkowskian metric the interacting nuclei, although overcoming the Coulomb barrier, produce, after fusion, a nucleus in an highly excited state, and therefore with high probability of spontaneous fission. On the contrary, in the deformed spacetime produced by the over-threshold hadronic condition, the excess energy after fusion goes in deforming the spacetime region, thus leaving the son nucleus (produced by the fusion of the two parent nuclei) in a low-excited (or even unexcited) state.
Therefore, the stability of the nuclei produced by cavitation is due (according to DSR) to the deformation of spacetime in the collapse region ensuing from the non-Minkowskian behavior of the strong interaction in the range E0,strong. This explains why no emission of radiation was observed in the cavitation experiments.
Let us also stress that the presence of the hadronic time deformation contributes also to the lowering of the Coulomb barrier. In fact, as is well known - as firstly realized by Levi-Civita - in a gravitational field the time coefficient of the metric acts as a refractive index, so the intensity of an electric field is changed into . The same happens in the case of a deformed spacetime, in which the Coulomb barrier becomes This further enhances the probability of fusion processes (like in the case of Europium).
7.5 Threshold Energy for Piezonuclear Reactions
Let us show that DSR is also able to predict the cavitation power needed to produce piezonuclear reactions in a stable way. This is a consequence of the law of time deformation in an hadronic field, Eq.(22), we rewrite here for reader’s convenience:
| (26) |
A way to read Eq.(23) is as follows. It can be regarded as an action-reaction relation, i.e. as the equality between two energy speeds: An electromagnetic speed of supplying energy to the atoms by the electromagnetic interaction (action) and an hadronic speed of response by the strong interaction of nuclei (reaction)
| (27) |
In order to attain the threshold of LLI breakdown for strong nuclear interaction, during the time taken by a generic cavitating bubble to collapse, for a given electric energy , an energy speed must be supplied such to equate the nuclear one.
Let the nuclear reaction time given by
| (28) |
where is the deformed strong relativistic factor and is the Yukawa time (nuclear year).
An estimate of at the energy threshold can be gotten by means of the relation (on account of the well-known fact that is the relativistic factor of time dilation in Minkowskian conditions for , and by recalling that the process occurs approaching from below). Replacing such an expression of in Eq.(25) yields
| (29) |
(4.13610 ; 1.373108).
For the energy of the electric interaction we have
| (30) |
Since , reads
| (31) |
Let us assume for the time taken by a microbubble of radius to collapse to the nuclear size with 10 (due to the electric repulsion of the water atoms subjected to the ultrasonic pressure wave). The collapse can occur at the velocity of sound in distilled water, 1.410, or at the velocity of the shock wave, . Because the ultrasound wavelength is much greater than the microbubble diameter, it is in either case.
Therefore we have, for the threshold energy :
| (32) |
The values of deduced from Eq.(29) range from 510 to 210 for the collapse speed (with radius of the collapsing microbubbles varying from 1 to 4 ) and from 10 to 210 for (with 1 8 ).
In order to produce stable piezonuclear reactions, and therefore a stable emission of nuclear radiation, it is necessary to supply constantly an energy to the system of distilled water and solute. Such a condition permits to trigger piezonuclear reactions in presence of broken local Lorentz invariance.
By using a cavitator absorbing 2000 and able to provide a stable supply from 100 up to a maximum of 2000 , it is possible to investigate the collapse of bubbles with size ranging from 1 to 8 , by taking either or 4 as collapsing speed.
As we have seen, the existence of the threshold is a direct consequence of the existence of of the energy threshold for the hadronic interaction.
If the interaction among nuclei occurs in non-Minkowskian conditions (for ), the excess energy is partly absorbed by the hadronic space-time deformation, so that there is no emission of radiation.
The two facts of the energy threshold overcoming, , and of the neutron emission in absence of radiation do provide the complete signature of piezonuclear reactions produced by the cavitating collapse of gas bubbles of water in non-Minkowskian conditions. Both these conditions are met in the experiments we described.
The existence of an energy threshold to be overcome explains why iron - which is the most stable element from the point of view of standard nuclear reactions - is instead favoured in order to get piezonuclear processes. Indeed, since iron has the highest value of the binding energy for nucleon, it is the first to attain the energy threshold needed to deform spacetime, power supplied being equal181818This remark is due to W. Perconti. .
However, it must be stressed that there is a third condition to be satisfied in order that piezonuclear reactions do occur. This is the overcoming a power threshold, and was evidenced in the experiments of solids subjected to mechanical pressure. We shall discuss this point in Subsect.7.7.
7.6 Piezonuclear Thorium Decay in DSR
Let us discuss now the implications of DSR for the thorium decay. The spontaneous decay of through the weak interaction halves it in a time = 1.9 = 9.99 . The ratio between the half life of thorium, , and the time interval of cavitation, = 90 , is = 104. This means that cavitation brought about the transformation of at a rate 104 times faster than the natural leptonic decay would do. On the other hand, the experiments of the Russian team provided no evidence of spontaneous fission. One is therefore led to deem that we are facing a phenomenon of accelerated transformation of thorium into some other nuclide (maybe Lead)191919Private Communications by L. Urutskoev., induced by cavitation, is rather due to strong interaction, in particular to its non-Minkowskian part.
By bearing this in mind, it is possible to interpret = 104 as the ratio between the decaying time of via the leptonic interaction (leptonic time ), and the transformation time of via the hadronic interaction (hadronic time ). Namely, one has:
| (33) |
Let us recall that the time coefficients of both metrics of electromagnetic and weak interactions, and , are equal to each other, energy independent, and always equal to 1. Either metrics is therefore always Minkowskian in time. Moreover, the space coefficients of both metrics have the same energy behavior. Thank to this circumstance, it will be always true, for the intervals of time and , that =. Hence we can write:
| (34) |
On account of the hadronic law of time deformation (23), the same relation of proportionality holds between the threshold hadronic energy and the hadronic time and between the electromagnetic energy and the electromagnetic time. In the present case, Eq.(31) can be rewritten in terms of the time intervals = and as:
| (35) |
From the above relation it is possible to estimate the unknown variable , i.e. the energy transferred by the electrical (Minkowskian) interaction to the nuclei of thorium (which get transformed into other nuclides by the strong interaction). One gets
| (36) |
This value of energy is compatible with the maximum energy for nucleon estimated for the cavitation experiment which provided evidence of the production of the europium isotope 138.
7.7 DSR and Piezonuclear Reactions in Solids
We want to see that DSR allows one to understand the results concerning the emission of neutrons from brittle fracture of solids subjected to mechanical pressure. One of the conditions to be met for piezonuclear reactions to take place is that the ratio, , between the power of released energy, , and the power threshold
| (37) |
be greater than or equal to 1:
| (38) |
Accordingly, based on the data obtained from the tests, the time interval of released energy, , in granite test specimens in which piezonuclear reactions have occurred, should satisfy the following relationship:
| (39) |
and hence:
| (40) |
Equation (36) was written by considering the energy accumulated in P3 which was greater than the energy accumulated in P4. For the marble test specimens, in which peak load is clearly followed by a softening branch, energy release surely occurred over a period of time too long to permit the production of piezonuclear reactions. Accordingly, neutron emissions in granite may be accounted for by the fact that the power threshold for piezonuclear reactions is exceeded, as well as by the type of catastrophic failure that occurs, which entails a very fast energy release, over a time period of the order of a nanosecond. Furthermore, with these assumptions, energy release time being the same, it is possible, albeit with the necessary caution, to ascribe the greater neutron emission from P3 compared to P4 to the fact that (P3) (P4).
Considering that the elastic strain energy accumulated in specimen P3 is released at the pressure wave velocity (for granite the extension of the energy release zone results to be equal to:
Such energy release band width x could correspond to the critical value of the interpenetration length assumed by Carpinteri and Corrado [61] to explain the critical conditions for the catastrophic behaviour of solids in compression. This supports the assumption we made on the role (similar to that of cavitation in liquids) played in solids by the interpenetration of molecular layers. In fact, if one considers the elastic energy stored in the sample and the temperature equivalent to this energy together with the final pressure before fracture, the material of the sample is in a region of the phase-space corresponding to a transition from solid to liquid phase. Our conjecture is that in the interpenetration layer of thickness the conditions are realized for a high density fluid,over-saturated but in metastable conditions. On the other hand,these locally extreme conditions could catalyse in the interpenetration band the formation of a plasma from the gases which are present anyway in the solid materials even at room conditions.
Anyhow, it is also evident that the availability of an amount of stored energy for the reactions exceeding the microscopic nuclear deformed space-time threshold is not sufficient per se. The energy must be contained in a space and time (and energy) hypervolume such that , i.e., such that the phenomenon will actually develop in deformed space-time conditions [38, 39]. From Table 4, in fact, it can be seen that it was in all the test specimens loaded in compression, but was greater than 1 only in granite test specimens. Hence, even for piezonuclear reactions in solids, the notion of stored energy must be combined with the notion of speed of energy release as is the case for liquids.
The fact that the marble used in the tests contains only iron impurities (not more than 0.07% of ), and granite instead contains a considerable amount of iron (around 3% of ), could be another factor contributing to the phenomenon in question, by analogy with the case of piezonuclear reactions in liquids. In fact, piezonuclear reactions with neutron emissions were obtained in liquids containing ironchloride or iron nitrate subjected to ultrasounds and cavitation (see Sect.3). Moreover, we have stressed at the end of Sect.3 that in the experiments on liquid solutions, aluminum atoms appeared at the end in a final quantity as large as about seven times the small initial quantity. This can be explained by assuming that iron undergoes the piezonuclear fission reaction Eq.(4). This should have occurred also in the compression tests on granite specimens. Such a conjecture is supported also by the following considerations of a very general nature. The present natural abundance of aluminum (7–8% in the Earth crust), which is less favoured than iron from a nuclear point of view (it has a lower bond energy per nucleon), is possibly due to the piezonuclear fission reaction (4). This reaction — less infrequent than one could think — would be activated where the environment conditions (pressure and temperature) are particularly severe. If we consider the evolution of the percentages of the most abundant elements in the Earth crust during the last 3 billion years, we realize that iron and nickel have drastically diminished, whereas aluminum, silicon and magnesium have as much increased. It is also interesting to realize that such increases have developed mainly in the tectonic regions, where frictional phenomena between the continental plates occurred [35, 36].
8 Perspectives
In conclusion, let us briefly outline possible developments and perspectives of the research on piezonuclear reactions.
Due to the emission of neutrons in bursts, as reported above, neutron measurements during piezonuclear reactions have very peculiar features, which make them different from common measurements of neutrons from neutron emitting elements or nuclear reactors. We stated that passive detectors are more suited to make out piezonuclear neutrons than active ones, although the latter were able to detect them as well. From this perspective it would be interesting and useful to perform neutron measurements by different techniques either passive or active in order to collect as more evidences and features of these emissions as possible. It would be possible to use elements in foils like Au-197, Mn-55 or Eu-151 and measure their activation as a passive technique or it would also possible to use fission chambers as an active one.
As to cavitated liquids, a systematic investigation of solutions of different salts would be needed, in order to check if iron does indeed play a privileged role.
New experiments can be envisaged in order to exert pressure on solids and attempt to achieve further evidences of piezonuclear reactions from solid materials.
In particular, it will be possible to apply ultrasounds to solids, beyond liquids, like bars of different materials containing or not containing iron, or bars of iron or steel.
Referring to the experiments carried out at the Polytechnic University of Turin, we have already stressed that the presence of iron could be another factor, together with the energy release, to be considered to account for the emission of neutrons from granite and not from marble, and to open up prospects for future experimental investigations into materials that fail in a catastrophic mode. A subsequent investigation may be conducted both on brittle iron-free materials and on ductile materials containing iron, or on iron itself. Finally, after selecting the materials, it would be necessary to analyse test specimens having different dimensions and slenderness ratios, possibly by setting different piston travel velocities on the testing machine. These studies would contribute to an understanding of the influence of test specimens dimensions and loading rate on neutron emission during fracture.
One can also think to carry out fatigue tests on the marble and granite samples by increasing the pressure exerted on them up the limit of fracture without reaching the fracturing of the material. In this context, it will be possible to carry out cycles of these compression tests and search for any emitted piezonuclear radiation (neutrons, alpha, beta and gamma) during these cycles.
Instead of using ultrasounds or mechanical pressing machines, it is possible to think of applying pressure on a pellet containing iron by a process of ablation carried out by laser beams impinging on the pellet.
A further method of applying pressure could be seen in the experiments carried out by electrolytic reactors of the Mizuno type [67]. The evidence of the existence of pressure waves in these electrolytic reactors is supported by the presence of acoustic waves that are continuously audible during the operation of these equipments. It will be possible to carry out experiments by these reactors and solutions of iron salts and verify whether piezonuclear reactions are a consequence of variations of pressure in the electrolytic plasma or whether there exists any contribution to these reactions due to the local fracturing and morphological changes of the electrodes by shock waves which are generated in the plasma surrounding them.
The experiments carried out so far have been focused on the detection and measurements of emitted neutrons and other possible ionising radiation. Of course it will be possible to broaden our view on these effects by carrying out other types of measurements. Calorimetric measurements would be of great interest in order to check the existence of extra heat and in order to have a further experimental element to compare with the homologous obtained in CMNS experiments [52].
One further interesting perspective, both on the experimental side and the theoretical one, is the chance to apply the concept of Local Lorentz Invariance breakdown, which has been the starting point for all of these experiments and considerations, to the issue of sonoluminescence whose explanation is far from being clear.
Acknowledgments. We are greatly indebted to Fabio Pistella, former President of the National Research Council of Italy, for his invaluable encouragements, suggestions and remarks, concerning the classical model of piezonuclear reactions, the detectors and hints for improvements of the experiments. His deep knowledge of nuclear reactions and devices was very precious in order to reach deeper insights about the new physics of piezonuclear reactions. We are also grateful to him for his sharp review of the manuscript and for kindly helping us in writing some parts. We are obviously indebted to all people who supported us in many ways in carrying out the experiments: the military technicians of the Italian Armed Forces A. Aracu, A. Bellitto, F. Contalbo, P. Muraglia; M. T. Topi, Director of ARPA Laboratories of Viterbo; the following personnel of Casaccia ENEA Laboratories: P. Giampietro, Director, G. Rosi, responsible of the nuclear reactor ”TAPIRO”, and A. Santagata; G. Ingo and C. Ricucci, of the Microscopy Laboratory ISMN-CNR and L. Petrilli, of CNR-Rome 1 Area, Montelibretti, for performing the mass spectrometry of the cavitated samples; R. Capotosto, for technical support on the sonotrode tip; F. Rosetto; G. Cherubini and L. Stefani, of the Laboratory cetli-nbc; A.Carpinteri, G. Lacidogna,and A. Manuello of the Politechnic of Turin. On the theoretical side, invaluable comments by E. Pessa are gratefully acknowledged. Thanks are also due to F. Mazzuca, President of Ansaldo Nucleare, for deep interest and warm encouragement.
References
- [1] L. Crum and D.F. Gaitan: Frontiers of Nonlinear Acoustics, 12th Int. Symp. on Nonlinear Acoustics (Elsevier Applied Science, New York, 1990).
- [2] C.E. Brennen: Cavitation and bubble dynamics (Oxford Univ. Press, 1995).
- [3] M. Brenner, S. Hilgenfeldt and D. Lohse: Rev. Modern Phys. 74, 42 (2002).
- [4] D. J. Flannigan and K. S. Suslick: Nature 434, 52 (2005).
- [5] W. Chen, W. Huang, Y. Liang, X. Gao and W. Cui, W.: Phys. Rev. E 78, 035301 (2008).
- [6] See L. A. Crum: J. Acoust. Soc. Am. 103, 3012 (1998).
- [7] Y. Arata and Y. Zhang: Proceedings Japan Acad. 71, 304 (1995).
- [8] Y. Arata, H. Fujita and Y. Zhang: Proceedings Japan Acad. 78, 201 (2002).
- [9] R.P.Taleyarkhan et al.: Science 295, 1868 (2002).
- [10] R.P. Taleyarkhan et al.: Phys. Rev. E 69, 036109 (2004).
- [11] R.P. Taleyarkhan: Phys. Rev. Lett. 96, 034301 (2006).
- [12] D. Shapira and M. Saltmarsh: Phys. Rev. Lett. 89,104302 (2002).
- [13] Y. Xua and A. Butt: Nuclear Engineering and Design 235, 1317 (2005).
- [14] R.I. Nigmatulin et al.: J. Power and Energy 218 Part A, 2004.
- [15] R.I. Nigmatulin et al.: Physics of Fluids, 17, 107106, 2005.
- [16] E. Forringer et al.: Archives of American Nuclear Society, Albuquerque, NM, pg.736-737, Nov.2006; also, Proc. Of Int. Conf. Nuclear Fusion Energy, Albuquerque, NM, Nov. 2006.
- [17] R. P. Taleyarkhan et al.: Nuclear Engineering and Design, 238, 2779 (2008).
- [18] See S. B. Krivit: http://newenergytimes.com/index.shtml, and refs. therein.
- [19] K. Diebner: Kerntechnik 3, 89 (1962).
- [20] S. Kaliski: Nature 269, 370 (1977).
- [21] A.S. Kozirev, V.A. Aleksandrov and N.A. Popov: Nature 275, 476 (1978).
- [22] F. Winterberg: Atomenergie-Kerntechnik 44, 146 (1984).
- [23] L.I.Urutskoev, V.I. Liksonov.and V.G. Tsinoev: Applied Physics (Russia) 4, 83 (2000).
- [24] L.I.Urutskoev, V.I. Liksonov.and V.G. Tsinoev: Ann. Fond. L.de Broglie 27, 701 (2002).
- [25] V.D. Kuznetsov, G.V. Myshinskii, V.I. Zhemennik and V.I. Arbuzov: Proc. 8th Russ. Conf. on the Cold Transmutation of Nuclei of Chemical Elements p.308 (Moscow, 2001).
- [26] A.G. Volkovich et al.: Bull. Lebedev Physics Inst. 8, (2002).
- [27] For a review, see L.I. Urutskoev: Ann. Fond. L.de Broglie 29, 1149 (2004).
- [28] F. Cardone and R. Mignani: Proc. Int. Conf. On Cosmoparticle Physics “Cosmion 2001” (Moscow, Russia, May 2001), Grav. & Cosmol. Suppl. 8, 216 (2002).
- [29] F. Cardone and R. Mignani: Int. J. Mod. Phys. B 17, 307 (2003).
- [30] F. Cardone, R. Mignani, W. Perconti, E. Pessa and G. Spera: Proc. Int. Conf. On Cosmoparticle Physics “Cosmion 2004” (Moscow, Russia, May 2004), Grav. & Cosmol. 11, 4 (2005).
- [31] F. Cardone, R. Mignani, W. Perconti, E. Pessa and G. Spera: Jour. Radioanalytical Nucl. Chem. 265, 151 (2005).
- [32] F. Cardone, G. Cherubini, R. Mignani, W. Perconti, A. Petrucci, F. Rosetto and G. Spera: arxiv.org/abs/0710.5115 (Annales Fond. de Broglie, in press).
- [33] F. Cardone, G. Cherubini and A. Petrucci: Phys. Lett. A 373, 862 (2009).
- [34] F. Cardone, R. Mignani and A. Petrucci: Phys. Lett. A 373, 1956 (2009).
- [35] A. Carpinteri, F. Cardone and G. Lacidogna: Strain: Int. J. Exp. Mech. 45, 332 (2009); ”Energy emissions from failure phenomena: mechanical, electromagnetic, nuclear”, Experimental Mechanics (in press).
- [36] F. Cardone, A. Carpinteri and G. Lacidogna: Phys. Lett. A 373, 4158 (2009).
- [37] F. Cardone and R. Mignani: Energy and Geometry (World Scientific, Singapore, 2004).
- [38] F. Cardone and R. Mignani: Int. Jour. Modern Phys. E 15, 911 (2006).
- [39] F. Cardone and R. Mignani: Deformed Spacetime (Springer, Heidelberg, Dordrecht, 2007).
- [40] T. Horigouchi, H. Koura and J. Katakura (eds.) Chart of Nuclides 2000, Jap. Nucl. Data Com. (JNDC); Nucl. Data Evaluation Lab. Korea Atomic Energy Res. Ins 2000-2002 BNL, U.S.A. version.
- [41] http://www.sonotronic.de/products/standard-machines/ultrasonic-generators-type-dn-35-m-md-and-dn-20-m-md
-
[42]
http://www.duran-group.com/english/products/duran/detail/laborflaschen.html
http://www.duran-group.com/english/download/laborglas_katalog_2005_2_p029.pdf - [43] http://www.gammascout.com/
- [44] http://www.amptek.com/gamma8k.html
- [45] http://www.bubbletech.ca/pdfs/BTI_BUBBLE_DEFENDER_October2006.pdf
- [46] R. V. Griffith, D. E. Hankins, L. Tommasino and M. A. M. Gomaa, United States Patent 4,381,454 April 26, (1983).
- [47] E. U. Khan et al., Radiation Measurements 4, 2, 583 (2005).
- [48] M. Izerrouken, J. Skvarc and R. Ilic: Radiation Measurements 37, 21 (2003).
- [49] Wedholm Medical, Neutron monitor instrument for general purpose survey. http://www.wedholmmedical.se/product.php?menyID=2&productID=5
-
[50]
Berthold Technologies, LB 123D Gamma Dose Rate
Monitor.
http://www.berthold.com/ww/en/pub/strahlenschutz/produkte/rppldose/rpproddoselb123d.cfm - [51] T.C. Kaushik, L.V. Kulkarni, A. Shyam and M. Srinivasan: Phys. Lett. A 232, 5384 (1997).
- [52] E. Storms: The Science of Low Energy Nuclear Reaction (World Scientific, Singapore, 2007).
- [53] CNR (National Research Council of Italy) Patent Office number: WO/2008/041253.
- [54] CNR (National Research Council of Italy) Patent Office number: WO/2008/041254.
- [55] CNR (National Research Council of Italy) Patent Office number: WO/2008/041255.
- [56] A. Carpinteri: J. of Mechanics and Physics of Solids 37, 567 (1989).
- [57] A. Carpinteri: Int. Journal of Fracture 44, 57 (1990).
- [58] J.A. Hudson, S.L. Crouch and C. Fairhurst: Engineering Geology 6, 155 (1972).
- [59] G. Ferro and A. Carpinteri: J. Applied Mechanics 75, 1 (2008).
- [60] RILEM TC 148-SSC: Materials and Structures 33, 347 (2000).
- [61] A. Carpinteri and M. Corrado: Eng. Fail. Anal. 16, 2530 (2009).
- [62] D. Priem, G. Racineux, G. Lochak, C. Daviau, D. Fargue, M. Karatchentcheff and H. Lehn: Ann. Fond. L.de Broglie 33, 129 (2008).
- [63] See e.g. G. Lochak: Ann. Fond. L.de Broglie 33, 1 (2008), and refs. therein.
- [64] A.Petrucci, R.Mignani and F.Cardone: Proc. Int. Conf. ICCF15 (Roma Oct.2009), in press.
- [65] See P. A. Mosier-Boss, S. Szpak, F. E. Gordon and L. P. G. Forsley: Naturwissenschaften 96, 135 (2009) , and references therein.
- [66] See e.g. Fusion Dynamics at the Extremes, Yu. Ts. Oganessian & V.I. Zagrebaev eds. (World Scientific, Singapore, 2000), and references therein.
- [67] T. Ohmori and T. Mizuno, Strong Excess Energy Evolution, New Element Production, and Electromagnetic Wave and/or Neutron Emission in the Light Water Electrolysis with a Tungsten Cathode, in 7th International Conference on Cold Fusion, 1998, Vancouver, Canada: ENECO Inc., Salt Lake City, UT. (ICCF-7).
- [68] G. Ericsson, S. Pompa, H. Sjöstrand and E. Traneus: Phys. Lett. A 373, 3795 (2009).
- [69] L. Kowalski: Phys. Lett. A 374 696 (2010).
- [70] F. Cardone, R. Mignani and A. Petrucci: Phys. Lett. A 373 3797 (2009).
- [71] F. Cardone, R. Mignani and A. Petrucci: Phys. Lett. A 374 698 (2010).
- [72] R. Ford, M. Gerbier-Violleau and E. Vázquez-Jáuregui: Phys. Lett. A 374 701 (2010).
- [73] F. Cardone, R. Mignani and A. Petrucci: arXiv:1001.5391v2 [physics.gen-ph]