Realtime Magnetic Field Sensing and Imaging using a Single Spin in Diamond
Abstract
The Zeeman splitting of a localized single spin can be used to construct a magnetometer allowing high precision measurements of magnetic fields with almost atomic spatial resolution. While sub-T sensitivity can in principle be obtained using pulsed techniques and long measurement times, a fast and easy-to-use method without laborious data post-processing is desirable for a scanning-probe approach with high spatial resolution. In order to measure the resonance frequency in realtime, we applied a field-frequency lock to the continuous wave ODMR signal of a single electron spin in a nanodiamond. In our experiment, we achieved a sampling rate of up to 100 readings per second with a sensitivity of 6 T/. Using this method we have imaged the microscopic field distribution around a magnetic wire. Images with T resolution and 4096 sub-micron sized pixels were acquired in 10 minutes. By measuring the field response of multiple spins on the same object we were able to partly reconstruct the orientation of the field.
pacs:
07.55.Ge, 07.79.-v, 81.05.ug, 71.55.CnThe nitrogen vacancy defect in diamond (NV center) has been recently proposed as a magnetic field probe with the potential for extraordinary spatial resolution, field precision, linearity and directional sensitivity Degen (2008); Balasubramanian et al. (2008); Maze et al. (2008). Its outstanding physical properties allow the spin state of a single center to be read out via optically detected magnetic resonance (ODMR) using confocal techniques Gruber et al. (1997). This opens promising possibilities in magnetic imaging Chernobrod and Berman (2005) with performances comparable to SQUIDs Black et al. (1993); Finkler et al. (2010), magnetic-resonance force microscopy (MRFM) Mamin et al. (2007); Rugar et al. (2004) and similar high-resolution attempts Blank et al. (2009), with the added benefit of room-temperature operation. In contrast to the widely used magnetic force microscopy (MFM Martin and Wickramasinghe (1987)), single spin magnetometry can be made independent of magnetic field gradients.
Scanning-probe concepts using a single NV center Taylor et al. (2008); Cole and Hollenberg (2009); Cappellaro and Lukin (2009); Hall et al. (2009) can be distinguished from multiplexing approaches where many NV centers are read out simultaneously Taylor et al. (2008); Maertz et al. (2010); Steinert et al. (2010). While the latter approach offers fast acquisition and full reconstruction of the magnetic field vectors, it is inherently limited in field resolution by dipolar interaction between the NV centers and in spatial resolution by the optical diffraction limit. Moreover, time-consuming post-processing of the data is necessary. Single-center scanning probes, on the other hand, provide significantly higher resolution in field and space, but this approach is in general considered too slow for imaging Steinert et al. (2010). Indeed, although contour lines corresponding to a single constant magnetic field were made visible in scanning confocal fluorescence images Balasubramanian et al. (2008), true field images were so far obtained only with the multi-center approach Maertz et al. (2010); Steinert et al. (2010). In all of these imaging-related studies, the full ODMR spectrum was acquired for each pixel using continuous (cw) irradiation.
Alternate ways to magnetic field sensing based on pulsed excitation and detection schemes have been proposed but not yet used for imaging, although experiments have demonstrated the soundness of the sensing principles Maze et al. (2008); Balasubramanian et al. (2009); Shin et al. (2010). While echo-based methods provide a better field sensitivity, they are only sensitive to periodically alternating fields. Static magnetic structures can be imaged only if the NV spin is mounted on an oscillating tip. Then, similar to the widely used MFM technique Martin and Wickramasinghe (1987), only strong field gradients can be measured. For weaker gradients, those methods are less suited and Ramsey fringes can be used instead. In all of these pulsed-ESR methods, pulsed light excitation and detection is required in addition to pulsed microwave channels.
In this letter, we present an alternative experimental approach to measure static fields with a single spin scanning probe, which uses only continuous optical excitation and frequency-modulated microwaves and is thus far less demanding in resources. Our approach offers a sensitivity comparable with the related pulsed technique (Ramsey fringes) and can be seamlessly integrated as a ”tracking and surveying” mode with the echo approaches if higher sensitivities are needed.
It is easy to see from the Hamiltonian of the diamond electron spin
| (1) |
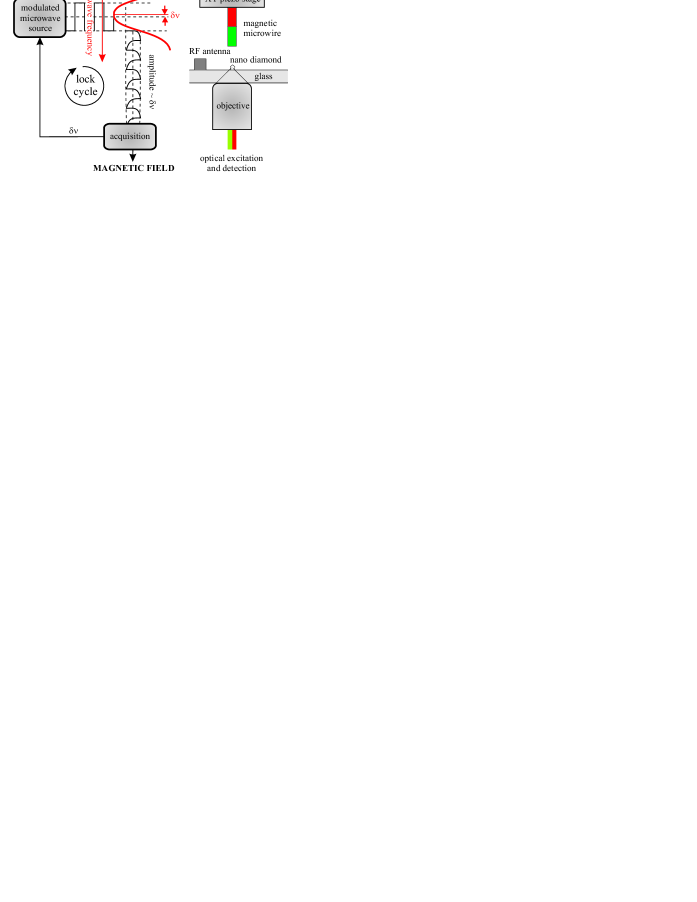
that for an exact determination of the local field strength along the symmetry axis of the NV center, only knowledge of the resonance position of one of the two allowed electron spin transitions is necessary as long as the zero field spectrum of the center is known. Here, is the gyromagnetic ratio of the spin and and are its zero field splitting parameters. In order to constantly track the resonance position without measurement of the complete spectrum, we use a modification of the field-frequency lock (Fig. 1(a)) known from magnetic resonance Maciel et al. (1967).
We use a rectangular frequency modulation (FM) of the microwave, created using two alternately switched and equally leveled signal sources
| (2) |
where is the central frequency, the modulation amplitude, the modulation rate, and is the sign function. In our detection, we use a software lock-in resulting in a signal proportional to the first derivative of the spectrum ,
| (3) |
as long as the modulation amplitude is small compared to the width of the peak (Fig. 2(a)).
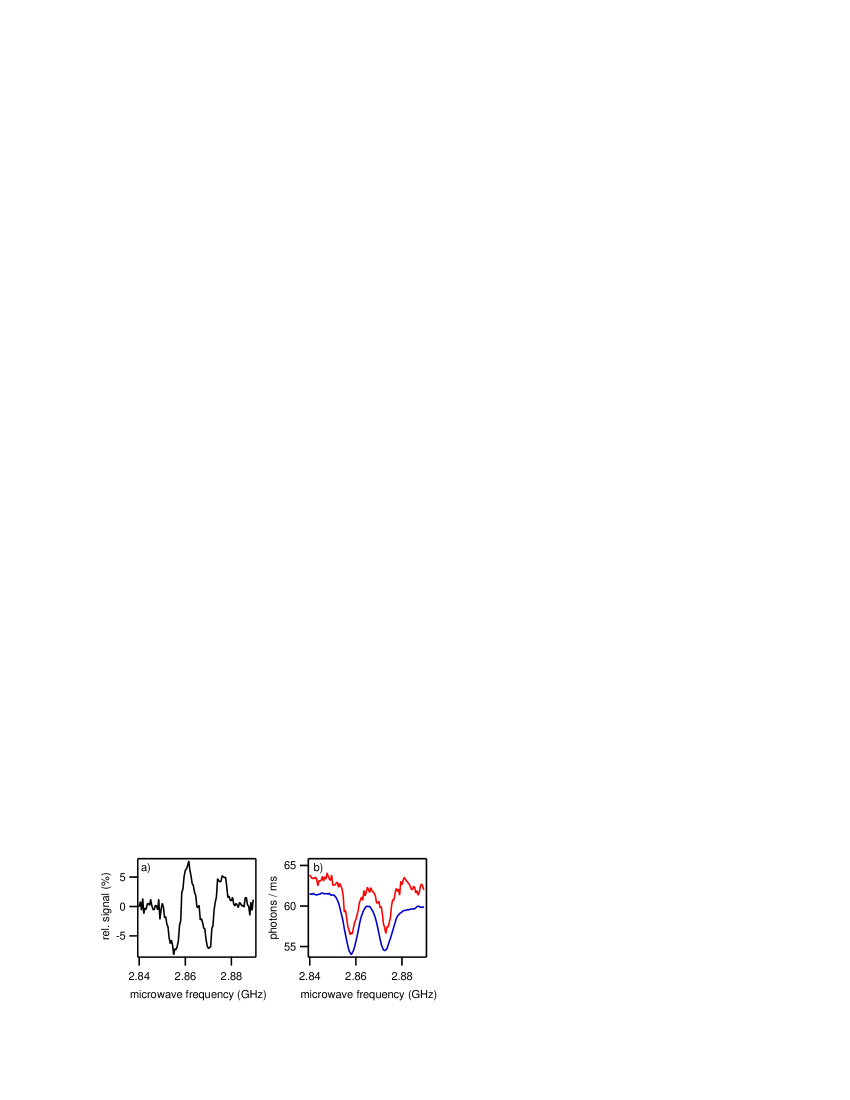
The original spectrum can be obtained by integration resulting in a smoother curve compared to a straightforward CW measurement (Fig. 2(b)). In case of unbiased photon shot noise this corresponds to an increased signal-to-noise ratio (SNR). One should note that the higher SNR is accompanied by a loss of resolution, which is limited by .
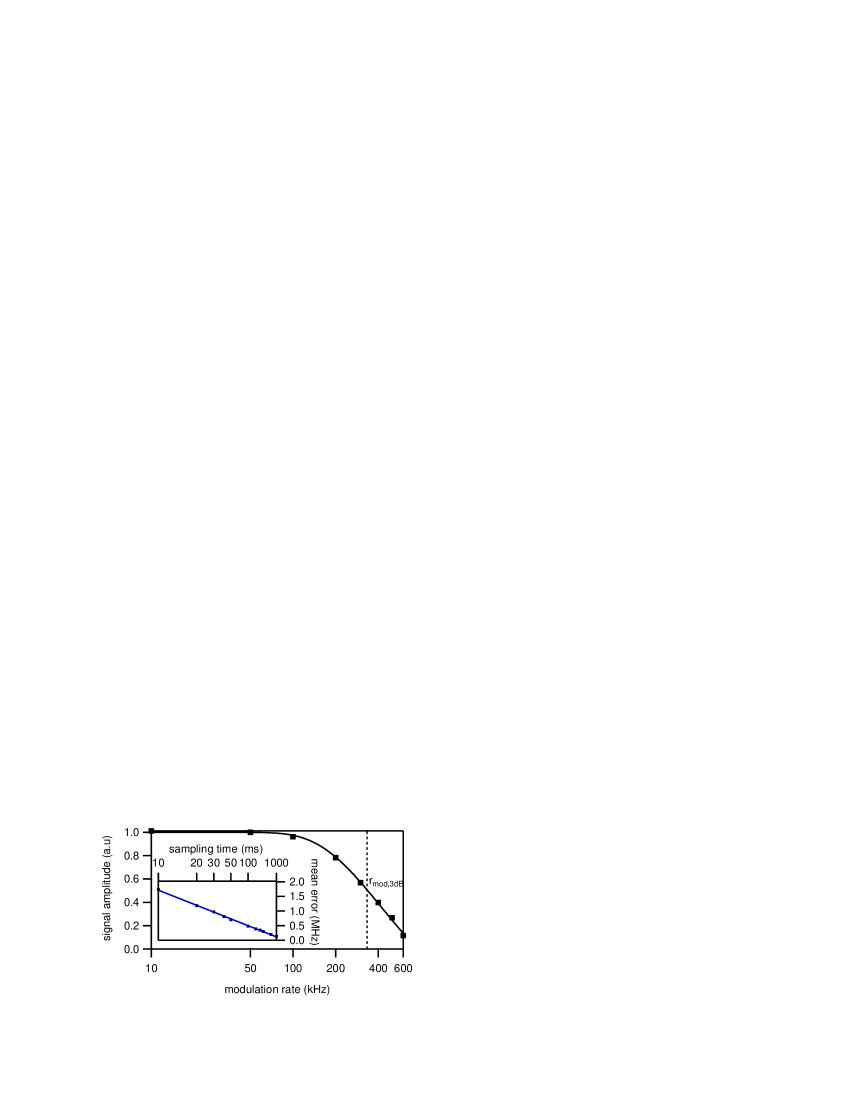
The speed of our technique relies on a fast modulation of the ODMR signal. One of the great advantages of the NV center is that its luminescence is not only spin-dependent but is also able to follow a change in within less than a microsecond. This is due to the fact that moderate laser illumination creates high spin polarization in a microsecond while the typical inverse Rabi nutation frequency is in the same order of magnitude. For simplicity, in this study we consider a phase relaxation time of a few microseconds (as is the case for our type Ib nanodiamonds), so that coherent effects can be neglected. This allows us to operate at kHz, a value common in conventional electron spin resonance. The dependence of the signal amplitude on is shown in Fig. 3, showing that the practical limitation is given by the repolarization rate. A response time s can be estimated based on the criterion of a 3 dB attenuation of the signal.
Applying Eq. (3) to a gaussian peak, it follows that a signal measured for a fixed microwave center frequency, but slightly off resonance, is proportional to the frequency offset. The true resonance position, and hence the magnetic field via Eq. 1, can be calculated. It is thus possible with our approach to locate and follow the resonance position of the NV center precisely with millisecond reaction time provided that the resonance position does not change more than the FWHM of the ODMR peak between two regulation cycles. A realtime field measurement can be conducted by continuously adjusting and recording the microwave frequency using this signal.
We now discuss the precision and speed of our method in terms of sensitivity , defined by the field error at given measurement time . For a standard deviation of the measurement and a general repetition rate (here: , in pulsed techniques, with = interrogation time, e.g., the spacing of Ramsey pulses) one obtains for any method in the photon shot noise limit Taylor et al. (2008)
| (4) |
where is the signal response to a change in the magnetic field. For d.c. measurements, a limit obtains. Considering similar signal contrast and noise level at equal experimental conditions, and neglecting the photon collection duty cycle which is one in our case and close to one using pulsed methods at high repetition rate, any difference in sensitivity can be attributed to . For the Ramsey fringe method, Taylor et al. (2008). In our approach, assuming an inhomogeneously broadened line and an optimal modulation amplitude , we find
| (5) |
We conclude that our method shows comparable and even slightly improved performance compared to Ramsey fringes, leading to a theoretical sensitivity better than 1 T (see Taylor et al. (2008) for details). Our measured sensitivity shown in Fig. 3 is slightly reduced due to experimental issues, i.e., lower signal contrast due to weaker microwave field and optical broadening due to high laser power. The latter can be avoided using an alternating optical/microwave excitation pattern. In this study, we decided to keep the implementation as simple as possible in order to emphasize a potential advantage of our method; although we used two pulse-switched microwave generators and time-triggered detection for convenience, an easier technical implementation is possible using only a single modulated microwave source and phase-synchronized detection of a diode current.
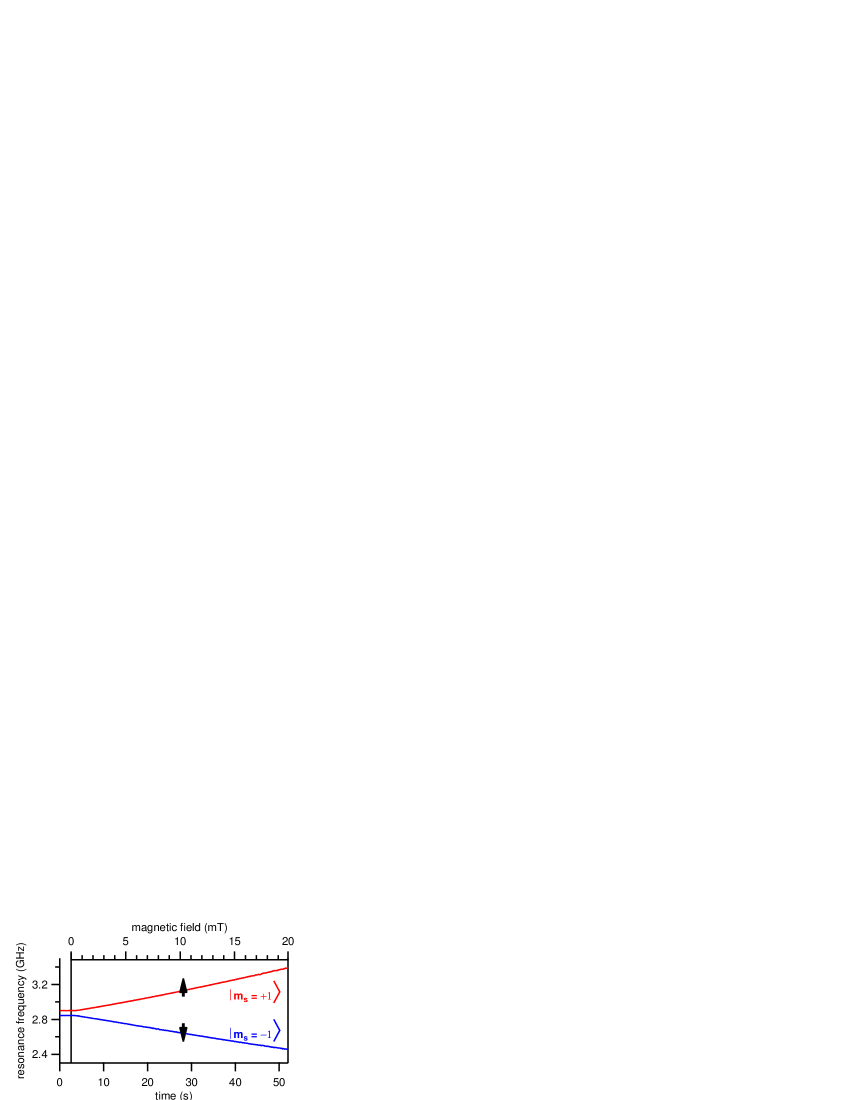

A realtime resonance tracking of both transitions during an uncalibrated independently driven magnetic field ramp created by an external magnet is shown in Fig. 4. The result is in perfect agreement with the Zeeman splitting expected and shows the excellent linearity of the probe in a broad field range. Note that in our experiment that range (2.4 to 3.4 GHz) it is given by the bandwidth of the involved microwave components. For tracking we employed a locking algorithm in which is measured for a time and the microwave center frequency is adjusted by the factor calculated from the modulated spectrum measured at zero field. Locking of the resonance position is achieved as long as the frequency changes between two measurements are smaller than the peak width. Faster changes will eventually lead to no further correction since the signal derivative is zero both at the peak maximum and far away from it (at the baseline). This marks the breakdown of the lock. Yet, as long as the peak is still locked the mechanism now enables us to track the resonance position over time. The response time is ultimately limited by the photon output and signal contrast of the color center. Taking typical values for a NV center (200 photons per ms, signal contrast ), the ultimate theoretical limit is ms, because photons are needed for a SNR of 1.
For a speed test simulating imaging conditions we applied an ac magnetic field with variable frequency (Fig. 5). was set to the maximum value where the probe could still follow the field without interruptions due to lock break-off and can be used to estimate the maximum line frequency of a scanning probe measurement. Higher sampling rates than the one used here will lead to even higher scanning frequencies, but here we were limited by the dead time of the counter card used for fluorescence readout.
Having now determined speed, range, and sensitivity of our probe, we measured the stray magnetic field of a 100 m diameter steel wire magnetized along its axis. The wire was mounted on a XY piezoscanner placed above the sample containing nanodiamonds. The distance to the sample was about 100 m. The scan was taken using an integration time of 150 ms per point. Due to the limited range of the piezo-scanner, only small areas of the whole field were measured. We measured several points of interest using different centers with known axis direction (Fig. 6). Each measurement took about 20 minutes for two 64x64 pixel images (back- and forth scan direction). No external field was applied during the experiment. The NV center axes were determined via realtime field measurements while rotating an external magnet; this was done in absence of the sample in order to avoid changes in magnetization. Assuming the wire to behave like a magnetic point dipole at this distance, we simulated its magnetic field using
| (6) |
The measured areas showed excellent agreement to the simulation. Comparing results from different centers of the same area we could find good agreement of the overall strength of the measured fields. For example by comparing the field maximum in scan (a) and (c) one finds that , thus confirming the direction of the magnetic field vectors below the wire pointing perfectly perpendicular to the plane.
In conclusion, we have demonstrated a robust and fast responding implementation of a magnetic field measurement using a single spin in diamond. We have shown that a single spin in diamond is well suited for use in a scanning probe microscope and that also directional information can be obtained with little effort. Our approach will allow to take precise 2D field images with nanometer resolution at ambient conditions within a few minutes which might open up fascinating new insights in cell biology, nanoelectronics and magnetic nanostructures. The only issue remaining for substantial local resolution increase is a better distance control to the sample, e.g. reliable fabrication of nanodiamonds on an AFM tip, which is currently under development van der Sar et al. (2009); Ampem-Lassen et al. (2009); Cuche et al. (2010).
This work was supported by the Volkswagenstiftung through the program ”Integration of molecular components in functional macroscopic systems”.
References
- Degen (2008) C. L. Degen, Appl. Phys. Lett. 92, 243111 (2008).
- Balasubramanian et al. (2008) G. Balasubramanian et al., Nature 455, 648 (2008).
- Maze et al. (2008) J. R. Maze et al., Nature 455, 644 (2008).
- Gruber et al. (1997) A. Gruber et al., Science 276, 2012 (1997).
- Chernobrod and Berman (2005) B. Chernobrod and G. Berman, J. Appl. Phys. 97, 014903 (2005).
- Black et al. (1993) R. Black et al., Appl. Phys. Lett. 62, 2128 (1993).
- Finkler et al. (2010) A. Finkler et al., Nano Lett. 10, 1046 (2010).
- Mamin et al. (2007) H. J. Mamin et al., Nature Nanotech. 2, 301 (2007).
- Rugar et al. (2004) D. Rugar et al., Nature 430, 329 (2004).
- Blank et al. (2009) A. Blank et al., Phys. Chem. Chem. Phys. 11, 6689 (2009).
- Martin and Wickramasinghe (1987) Y. Martin and H. K. Wickramasinghe, Appl. Phys. Lett. 50, 1455 (1987).
- Taylor et al. (2008) J. M. Taylor et al., Nature Phys. 4, 810 (2008).
- Cole and Hollenberg (2009) J. H. Cole and L. C. L. Hollenberg, Nanotech. 20, 495401 (2009).
- Cappellaro and Lukin (2009) P. Cappellaro and M. D. Lukin, Phys Rev. A 80, 032311 (2009).
- Hall et al. (2009) L. T. Hall et al., Phys. Rev. Lett. 103, 220802 (2009).
- Maertz et al. (2010) B. J. Maertz et al., Appl. Phys. Lett. 96, 092504 (2010).
- Steinert et al. (2010) S. Steinert et al., Rev. Sci. Inst. 81, 043705 (2010).
- Balasubramanian et al. (2009) G. Balasubramanian et al., Nature Mat. 8, 383 (2009).
- Shin et al. (2010) C. Shin et al., J. Luminescence 130, 1635 (2010).
- Maciel et al. (1967) G. Maciel, P. Ellis, and D. Hoefer, J. Phys. Chem. 71, 2160 (1967).
- van der Sar et al. (2009) T. van der Sar et al., Appl. Phys. Lett. 94, 173104 (2009).
- Ampem-Lassen et al. (2009) E. Ampem-Lassen et al., Opt. Express 17, 11287 (2009).
- Cuche et al. (2010) A. Cuche et al., J. Nanophotonics 4, 043506 (2010).