On stochastic differential equation models for ion channel noise in Hodgkin-Huxley neurons
Abstract
The random transitions of ion channels between conducting and non-conducting states generate a source of internal fluctuations in a neuron, known as channel noise. The standard method for modeling fluctuations in the states of ion channels uses continuous-time Markov chains nonlinearly coupled to a differential equation for voltage. Beginning with the work of Fox and Lu Fox1994 , there have been attempts to generate simpler models that use stochastic differential equation (SDEs) to approximate the stochastic spiking activity produced by Markov chain models. Recent numerical investigations, however, have raised doubts that SDE models can preserve the stochastic dynamics of Markov chain models Mino2002 ; Zeng2004 ; Bruce2007a ; Bruce2009 ; Sengupta2010 .
We analyze three SDE models that have been proposed as approximations to the Markov chain model: one that describes the states of the ion channels and two that describe the states of the ion channel subunits. We show that the former channel-based approach can capture the distribution of channel noise and its effect on spiking in a Hodgkin-Huxley neuron model to a degree not previously demonstrated, but the latter two subunit-based approaches cannot. Our analysis provides intuitive and mathematical explanations for why this is the case: the temporal correlation in the channel noise is determined by the combinatorics of bundling subunits into channels, and the subunit-based approaches do not correctly account for this structure. Our study therefore confirms and elucidates the findings of previous numerical investigations of subunit-based SDE models. Moreover, it presents the first evidence that Markov chain models of the nonlinear, stochastic dynamics of neural membranes can be accurately approximated by SDEs, even with as few as 60 and 18 channels. This finding opens a door to future modeling work using SDE techniques to further illuminate the effects of ion channel fluctuations on electrically active cells.
I Introduction
Hodgkin and Huxley’s mathematical model of action potentials dynamics Hodgkin1952 is a cornerstone of computational neuroscience. This system of equations provides a conductance-based framework for describing the dynamics of the membrane potential of a neuron. The essential features of the Hodgkin-Huxley (HH) model are quantitative descriptions of the permeability of a neuronal membrane to ion-specific currents (conductances) coupled to a current-balance equation that characterizes the voltage across a neural membrane. The physical basis for this empirical model is that conductances are determined by the proportion of ion channels in a conducting (i.e., an open state), and that the states of the ion channels are determined by the configuration of components of the ion channels, referred to as subunits, particles, or gates (see (Dayan2001, , e.g.)). The original HH equations can be interpreted as a model of the mean behavior of the ion channels and their subunits. After the advent of techniques for recording the activity of individual ion channels Sakmann1995 , it was discovered that ion channels can transition between open and closed states in an apparently random manner and that this can generate a significant source of noise to the ionic conductances Hille2001 .
This internal source of fluctuations is known as channel noise, and is distinguished from sources of noise that are external to the neuron such as synaptic noise (Destexhe2010, , e.g.) or noise that is present in an applied stimulus. Channel noise has important effects on neuronal dynamics and coding: it can alter the firing threshold Clay1983 ; White1998 ; Pecher1939 , spike timing Schneidman1998 ; Rossum2003 , interspike interval statistics Rowat2007 , the amount of stochastic resonance Schmid2001 ; Schmid2004 , and influence synaptic integration Cannon2010 . Channel noise can also contribute to the overall variability in the nervous system, which in turn may pose constraints on the fidelity of the motor and sensory systems of an animal White2000 ; Faisal2008 ; White1998 ; Balasubramanian2001 ; Polavieja2002 and limit neuron miniaturization Faisal2005 .
The classical HH formalism produces a deterministic description of neuronal dynamics, so alternative models have been proposed to account for channel noise. These models assume that the activity of ion channels is governed by random transitions among a number of possible channel conformations, which leads to intrinsically stochastic models of neuronal dynamics. Although a variety of models of this type have been proposed, including those that capture fractal properties of patch-clamp data Liebovitch2001 and history-dependence in the activity of ion channels Soudry2010 , the most widely-used channel noise model is the Markov chain (MC) model. MC models assume that the state of an ion channel is described by a discrete-state, continuous-time Markov chain, where each state in the chain represents a particular configuration of the ion channel. The Markov property requires that a channel’s transition from one state to the next depends on its current state alone, thus the transition rates are determined solely by the state of the channel and the voltage potential of the membrane. As a consequence, all channels are coupled due to their common dependence on the membrane potential. For a recent review of MC models in computational neuroscience, see Groff2010 .
MC models are an invaluable tool for investigating the effects of channel noise on neural dynamics and coding, but these models are computationally expensive to simulate and are difficult to analyze mathematically. As a result, there has been widespread interest in formulating stochastic differential equation (SDE) models of channel noise. This line of research was initiated by Fox and Lu Fox1994 ; Fox1997 and has been applied extensively in HH-type neuron models as well as models of calcium release from IP3 receptors Shuai2002 (see Bruce2009 for a review of past applications of this approach). The SDE model that is most commonly used extends the original HH equations by including noise terms in the differential equations that describe the gating variables. Computationally, this model can be orders of magnitude faster than MC models Fox1997 ; Mino2002 , so it has often been used in place of, or as an approximation to, the MC model. Simulation studies have shown, however, that this SDE approach does not accurately replicate the stochastic response properties of the MC models Mino2002 ; Zeng2004 ; Bruce2007a ; Bruce2009 ; Sengupta2010 and it has been suggested that such models are inadequate for simulations of channel noise Faisal2010 or must be modified to correctly reflect the stochastic properties of the MC models Bruce2009 .
Despite recent indications that the commonly-used SDE model does not approximate the behavior of the MC model, there has been no definitive study detailing the cause of discrepancies between the MC and SDE approaches. Moreover, other SDE models that have been proposed Fox1994 ; Shuai2002 have never been tested to gauge whether there may be alternative, and more accurate, reduced models of channel noise. There are several possible reasons as to why an SDE model may not closely approximate a MC model. The system size expansion method for deriving an SDE model is an asymptotic result that is formally valid in the limit of a large number of channels; it is possible that there are too few ion channels in a realistic model neuron for these approximate methods to be accurate. Another possible cause of the discrepancy between the two approaches is numerical error in the simulation algorithms Bruce2007a . Finally, it could be that the widely-used SDE models are formulated in a manner that neglects, or distorts, important dynamical and stochastic structure in the MC model.
In this paper, we will demonstrate that the formulation of the SDE is critical for preserving the stochastic character of MC models. In Section II, we introduce three different SDE models that have been proposed in the literature. Among these, we distinguish between channel-based and subunit-based SDE models and provide an intuitive explanation for why the channel-based approach is the more appropriate SDE framework. We use a combination of mathematical analysis (Section III) and simulation results (Section IV) to show that the MC model can, in principle, be well-approximated by a channel-based SDE model that was first introduced by Fox and Lu Fox1994 . To our knowledge, ours is the first numerical implementation of the channel-based Fox and Lu model Fox:PersonalComm . Prior studies have provided numerical evidence that a widely-used subunit-based model does not accurately approximate the MC model Mino2002 ; Zeng2004 ; Bruce2007a ; Bruce2009 ; Sengupta2010 , and our analysis confirms and elucidates these findings. We conclude that properly defining the structure and dynamics of ion channels is critical to formulating SDE models in a way that is consistent with MC models. We provide additional evidence for this conclusion by formulating reduced, quasistationary models based on our analytical results. Simulations of these models show that temporal correlation in the noise, which is shaped by the structure of ion channels, is critical for accurately approximating responses of the MC model.
II Conductance models based on ion channels and their subunits
We consider the HH model throughout this study, but our analysis is applicable to any conductance-based model with ion channels governed by linear, voltage-dependent kinetics. The membrane potential of an HH neuron is modeled as:
| (1) |
where is the membrane capacitance, , and are reversal potentials for , , and leakage currents, respectively, and is the applied current. Our central question is how to appropriately define the ion channel conductances ( for sodium and for potassium) when one wants to include channel noise. Generally, one defines the conductance as , where is the fraction of channels that are open and is the maximal conductance per ion channel. Then the problem of appropriately reproducing channel behavior reduces to computing the evolution of , the fraction of open channels. In the following, we will describe a number of methods for computing . We outline the standard MC model of ion channel kinetics Skaugen1979 ; Clay1983 and highlight how this approach relates to the classical (deterministic) HH model. We will then consider three distinct approaches for defining SDE models: two that were first proposed by Fox and Lu Fox1994 and a variant suggested by Shuai and Jung Shuai2002 .
Capturing the kinetics of a single subunit is the starting point for all of the models considered here. In the standard HH model, the channel has four independent identical subunits, traditionally given the symbol , that must all be in an open state for the channel to be in the conducting state Fox1994 ; Dayan2001 . The kinetics of a individual subunits are described by a two-state process:
| (2) |
where these subunits switch between open and closed states with the voltage-dependent transition rates Hodgkin1952 :
To simplify the notation, we will often omit the explicit dependence on and write only and .
The channels are modeled using two different subunit types, traditionally labeled and , each of which described by an open-closed kinetic scheme. The analysis of the two channel types is fundamentally the same, but entails significantly more notational complexity for the channel. For conciseness, we will present detailed analysis of the channel, but report results for both channel types.
The analysis of the channel can be carried out in an analogous fashion, but entails significantly more notational complexity, so we will present detailed analysis of the channel only. We report analytical and simulation results for the both channels. In the remainder of this section, we review how this building block of a two-state subunit has been used to construct models of the conductance.
II.1 Markov Chain Ion Channel Model
The kinetic scheme in Eqn. 2 can be used to define a Markov chain that describes the behavior of a single subunit that randomly transitions between two states (Dayan2001, , e.g.). If we let be the probability that the subunit is in the open state, then the evolution of this probability satisfies
| (3) |
This equation follows from Eqn. 2 and the fact that the probability that a subunit is closed is . Since the channel is assumed to consist of four statistically identical and independent subunits, its configuration can be modeled as a five-state Markov chain, where each state indicates the number of open subunits at a given instant in time:
| (4) |
The channel is said to be in the open or conducting state if all four subunits are open simultaneously. Let be a column vector where the element represents the probability at time that a channel has open subunits, then this probability distribution evolves in time according to the master equation
| (5) |
where the matrix A is:
The conductance for a population of channels is determined by the proportion of the channels in the open state, , where is the conductance per channel and is the fraction of open channels, with is the number of open channels and is the total number of channels in the system.
II.2 Deterministic Conductance Models
If we consider an idealized neuron with an infinite number of statistically-identical and independent channels, we can obtain a deterministic description of the fraction of open channels . In this limit, the fraction of open channels is equivalent to the probability that any one channel will be open. In other words, Eqn. 5 also defines a deterministic model of conductance where and is given by the solution of the system of ordinary differential equations in Eqn. 5.
At first glance, the deterministic definition of appears to differ from that in the classical HH model, in which . As discussed in Dayan2001 , however, these two models are equivalent: first, note that in our notation can be identified with the gating variable in the HH model because both satisfy the differential equation (3) and both represent the proportion of subunits that are open. Next, observe that the entire system of differential equations in Eqn. 5 can be derived from the single HH gating variable by making the following substitutions:
For instance, setting , we find:
This equation is identical to the final row of Eqn. 5 and the remaining equations in that system (as well as those for ) can be derived in a similar manner.
II.3 SDE Conductance Models
II.3.1 Channel SDE Model
In the previous section we arrived at a deterministic model for conductance because we considered the case of infinitely many channels. If we define the number of channels to be finite, however, we can derive stochastic models using a system-size expansion Gardiner2004 . This method was first applied to the HH model by Fox and Lu Fox1994 . Following their notation, we define to be the proportion of channels that have open subunits. Since we are dealing with a finite population, the proportion of channels in a particular state, , is no longer a measure of probability . Rather, the number of open subunits fluctuates from realization to realization, which inevitably leads to a stochastic description of the channel. The system size expansion provides a formal method for deriving a SDE model based on the master equation (5). Fox and Lu showed that the SDE for the channel is
| (6) |
where is a vector of the , is the matrix in Eqn. 5, is a vector of five independent Gaussian white noise processes with zero mean and unit variance, and is the matrix square root of the diffusion matrix ,
| (7) |
where is the number of channels. To our knowledge, neither Fox and Lu nor other researchers have implemented this channel-based SDE model Fox:PersonalComm . We will mathematically analyze it under voltage clamp conditions and perform numerical simulations to show that it accurately replicates the stochastic properties of the MC model. We refer to this model as the channel SDE model because the variable is defined based on the states of the ion channels.
II.3.2 Subunit SDE Models
Unfortunately, the channel SDE model above does not preserve the dynamical structure of the classical HH equations: closed states are distinguishable and must be modeled, expanding the dimensionality of the system significantly. In an attempt to avoid this increase in complexity, one can apply the system size expansion procedure to the subunits rather than to the states of the channels. This leads to stochastic models that resemble the classical HH model, but include noise in the equations governing the subunit variables , , and . We refer to such approaches as subunit SDE models. The subunit approach leads to the following SDE for the proportion of open subunits Fox1994 ; Shuai2002 :
| (8) |
where the stochastic term is a Gaussian white noise process with zero mean and unit variance that is scaled in a voltage-dependent manner by , where
| (9) |
The model for the channel population is then built from the subunit populations. Since each channel is composed of four statistically identical and independent subunits, Shuai and Jung proposed a model in which the proportion of open channels is defined as the product of four independent realizations (denoted ) of solutions to the SDE in Eqn. 8 Shuai2002 . This defines the conductance to be . We refer to this as the independent subunit model, InS. Shuai and Jung did not implement this method. Instead, they followed a method introduced by Fox and Lu Fox1994 in which only one realization of a solution to Eqn. 8 is computed (denoted ), and this realization is raised to the fourth power. This defines the conductance to be , built out of four identical subunit populations. We refer to this as the identical subunit model, IdS. In the limit of an infinite number of channels, both of the subunit models converge to the deterministic HH model.
II.4 The Distinction Between Subunit and Channel Models
The fundamental difference between the channel SDE model in Section II.3.1 and the subunit SDE models in Section II.3.2 is that in the former, one first groups subunits together to construct a channel and then defines the dynamics of the proportion of channels in each state. In the latter, one defines the dynamics of subunits first, before grouping the subunits together to compute the conductance of the channel. We note that the deterministic model in Section II.2 derived from the master equation is a channel-based approach while the classical HH model is a subunit-based approach. Nonetheless, as discussed above, the two models are equivalent. It is tempting, therefore, to conclude that both the channel and subunit SDEs will also produce identical stochastic models. As we will show in the remainder of this study, these two approaches generate distinct stochastic processes: channel-centric SDE models can approximate the channel noise and spiking statistics of the MC model, but the subunit-based SDEs cannot.
To gain some intuition for how the subunit and channel SDE approaches differ, consider the following example of a neuron with channels, where each channel consists of two statistically identical and independent subunits. This configuration is illustrated in panel (a) of Fig. 1. The analysis can be extended to the four subunit channel, but for illustrative purposes we consider the simpler case of two subunits. At a given instant in time, define the state of the subunit in each class by the binary random variables and . These variables take the value of one with probability and are zero otherwise. The probability that the channel is open is determined by the probability that both subunits are open, . A channel-based approach defines the conductance from the proportion of open channels, so we average over all channels to obtain the proportion of open channels:
| (10) |
The are themselves identical and independent binary random variables that take the value one with probability , thus the mean and variance of are:
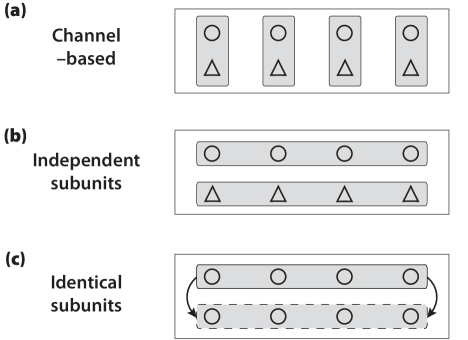
The subunit approaches do not begin by grouping subunits into predefined channels. Instead, one first computes the fraction of open subunits by averaging over each class of subunits, as shown in panel (b) of Fig. 1. The proportions of open subunits in the two subunit classes are:
If we assume that each subunit class is independent and define the proportion of open channels to be the product of the and , then we can write the proportion of open channels as:
The proportion of open channels under the subunit approach is therefore an average of binary random variables rather than random variables, as in Eqn. 10 for the channel approach. The probability that the product is equal to one is , so the expected value of , identical to . The variance in the two models, however is different. To see this, write the variance of as the sum of covariances:
This sum is over all of the possible pairings of . To leading order in , the dominant contribution to this sum is among pairings that have one index in common. There are possible pairs of and , and for any given pair there are ways to choose the indices of and such that or . To leading order in , therefore, there are of these terms, and the variance of can thus be written as:
| (11) |
where is the correlation coefficient between random variables of the form and where either or . A straightforward calculation shows that . Since takes values in , is bounded between zero and one half. Equation 11 implies, therefore, that the variance of the fraction of open channels using the subunit-based averaging is always smaller than in the channel-based approach. Moreover, the variance decreases with . This implies that the subunit method underestimates the variance when is small.
An assumption in the above analysis is that there are two independent classes of subunits. This can be thought of as the analogue of the InS SDE model discussed above. Another variation of the subunit approach, used in the IdS SDE, is to assume that the two subunit classes are identical. This approach is illustrated in panel c of Fig. 1. Since both subunit classes are identical, we drop the second subscript and define a random variable that represents the state of the subunit in both classes. The proportion of open channels can then be rewritten as:
The expected value of , which is given by the probability that , is identical to . The variance for this approach is:
As above, to leading order in it suffices to consider the covariance of pairings that share one index in common. There is no distinction between the two subunit classes, so . There are therefore twice as many such terms as in the previous approach, and we find:
| (12) |
with the same correlation coefficient .
This analysis illustrates how averaging across channels and averaging across subunits leads to fundamentally different probabilistic descriptions of the proportion of open channels. In particular, since , Eqn. 11 guarantees that the variance of the proportion of open channels given by the subunit model with two independent classes of subunits will never exceed the variance given by the MC model. Equation 12 shows that the variance in the subunit model with identical subunit classes will always be twice as large as the variance in the IdS model. Depending on whether is smaller or larger than one fourth, therefore, the variance in the subunit model with identical subunit classes can be either smaller or larger than the variance of the MC model. These differences are a direct consequence of how each approach aggregates the channels’ subunits. Importantly, we observe that the differences between these approaches will persist for any finite number of channels. In the limit of infinitely many channels, the variance goes to zero, so all of the modeling approaches discussed here become equivalent. It is a straightforward exercise to extend this analysis to the case of four subunits (i.e., the channel), and a similar discrepancy between the channel and subunit approaches holds in that case.
The three methods for grouping subunits that we have considered represent the three different approaches to performing a system-size expansion that have been proposed by Fox and Lu Fox1994 ; Fox1997 and Shuai and Jung Shuai2002 . These combinatorial arguments provide an intuitive understanding for why the three SDE approaches that we are studying will lead to channel noise models with different statistical properties. We now confirm this by directly analyzing the SDE and MC models.
III Voltage Clamp Analysis of Stochastic Models
III.1 Stationary Distribution
We now analyze the stochastic character of each of these SDE models and compare them to the MC model. For the purposes of modeling voltage potential across the membrane, we are interested in the conductance of the ion channels so we seek to characterize the probability distribution of the fraction of open channels, which we denote . To simplify the analysis, we will mimic the experimental technique of voltage clamp and perform our analysis while holding the membrane potential constant.
III.1.1 Markov Chain Model
In the MC model, each channel consists of four subunits that transition between open and closed states. In voltage clamp this process is homogeneous in time so the stationary distribution for the number of open channels can be completely determined Gardiner2004 . We are primarily interested in the stationary probability that all four subunits are open because this is equivalent to the probability that the channel itself is open. From Eqn. 3, the equilibrium value of is . The probability that the channel is open is therefore:
All channels are assumed to be statistically identical and independent, so the distribution of the total number of open channels at a given time is a binomial distribution with population parameter (the total number of channels) and bias parameter . To define the distribution of the fraction of open channels , we rescale the binomial distribution by . The mean and the variance of this stationary distribution are:
| (13) | |||||
| (14) |
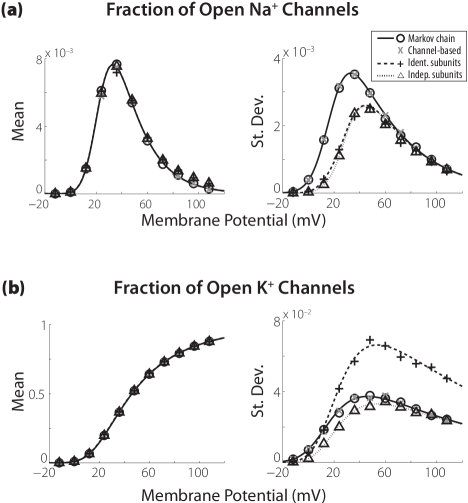
which we define as and , respectively, as a shorthand. Note that these quantities are functions of , even though we do not explicitly include this dependence in our notation. Equation 13 shows that the mean does not depend on the number of channels and Eqn. 14 shows that the variance scales with . The mean and standard deviation of the fraction of open channels are shown by the solid black lines in Fig. 2. The mean and variance for the channel can be computed in a similar fashion and Fig. 2 includes those results. The results shown are for a membrane area of 10 , which corresponds to 180 and 600 channels.
III.1.2 Channel SDE Model
To analyze the channel SDE model (Eqn. 6), we apply the simplification suggested by Fox and Lu: we set values of the state variables in the diffusion matrix (Eqn. 7) to their mean equilibrium values. We refer to this approximation as the equilibrium noise approximation and show in Appendix B that, for the voltage clamp case, it holds to . In principle, the values of each should be confined to since they represent proportions of open channels, but to simplify the mathematical analysis we do not impose this condition. Under these simplifications, the SDE model is a multivariate Ornstein-Uhlenbeck (OU) process that by definition has a Gaussian-distributed stationary distribution. The mean and variance of the stationary process can be calculated directly using standard methods Gardiner2004 . We find that the stationary distribution of the fraction of open channels is given by:
| (15) |
This is the expected result for a system size expansion since, in the limit of a large number of channels, the binomial distribution for the MC model can be approximated by a Gaussian distribution with mean and variance . Any description of channel noise that aims to reproduce the behavior of the Markov state model should have this as its limiting distribution, so this result is our first confirmation that the channel SDE model provides an accurate approximation to the MC model.
III.1.3 Subunit SDE Models
To analyze the subunit-based SDE models, we apply the same approximations: we replace in the equation for (Eqn. 9) with its mean value at equilibrium. Thus, we replace with and do not restrict the values of to the interval . As was the case for the channel SDE, these approximations allow us to rewrite the SDE for (Eqn. 8) as an OU process:
| (16) |
where and . The stationary distribution of (the fraction of open subunits) is therefore Gaussian-distributed with mean and variance . Note that is scaled by ; for simplicity we report analytical results to .
In Section II.3.2 we discussed two methods for defining the proportion of open channels based on the stochastic dynamics of the subunits. If we follow the approach of Shuai and Jung and combine four statistically identical and independent solutions to Eqn. 16, the stationary distribution for the proportion of open channels is defined by the product of four independent and identically distributed Gaussian random variables:
Unlike the channel SDE distribution in Eqn. 15, in the limit of a large number of channels, this distribution does not approach a Gaussian. This model, therefore, is fundamentally incompatible with the MC model. Furthermore, it is straightforward to compute the mean and variance of this distribution directly from the first two moments of the subunit distribution. We find:
| (17) | ||||
| (18) | ||||
We note that this leading order result for the moments can also be obtained following the combinatorial approach outlined in Section II.4.
If we go further and assume that all four populations of subunits are identical and perfectly correlated (i.e., following the approximation proposed by Fox and Lu), then the stationary distribution for the fraction of open channels is given by the Gaussian distribution for a single subunit raised to the fourth power. The distribution in this case has the closed form:
This distribution also does not limit to a Gaussian and is fundamentally incompatible with the MC model. As above, we can compute the mean and variance of :
| (19) | ||||
| (20) | ||||
Equations 17 and 19, show that the mean fraction of open channels computed with the subunit approaches agrees with the MC model in the limit of a large number of channels. The variance, however, is poorly described. For instance, the ratio of the open channel variance of the MC model (Eqn. 14) to that of the IdS model (Eqn. 20) is:
For subthreshold values of , is small and therefore the IdS model drastically underestimates the magnitude of the channel noise.
These analytical results for the two subunit SDE models are plotted in Fig. 2 with dotted (independent subunit populations; InS) and dashed (identical subunit populations; IdS) lines. Note that the channel noise in the channel is also underestimated by both subunit models for near the resting potential of zero millivolt.
III.2 Autocorrelation in Voltage Clamp
We now analyze temporal correlations in the proportion of open channels for a given voltage clamp level. As in prior sections, equations presented here depend on voltage potential , but to simplify notation we do not explicitly indicate this. If we denote the time series of the proportion of open channels as , then the autocorrelation function for is:
We assume does not depend on the initial time since our analysis is restricted to the stationary distribution of open channels in voltage clamp.
III.2.1 Markov Chain Model
Let denote the state of the channel at time , where indicates an open channel and indicates that the channel is closed. The autocorrelation for the fraction of open channels then becomes
| (21) | ||||
This simplification is possible because the MC model assumes that all channels are statistically identical and independent. The only unknown term in Eqn. 21 is . Since is a binary random variable, expected value of is equal to the probability that the channel is open at the initial time and is also open at the later time . This probability can be determined by solving the master equation (5), which is possible in voltage clamp because this system of ordinary differential equations is a linear equation with constant coefficients. The probability that the channel is open is given by in Eqn. 5, so is equal to the entry in the last row and the last column of the matrix exponential of the matrix in (5). We find:
| (22) |
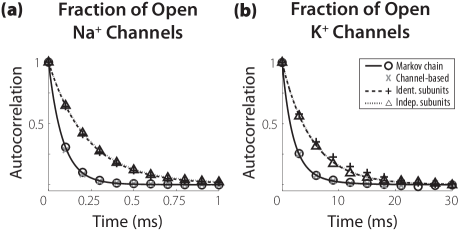
where . The solid black line in panel (b) of Fig. 3 shows this function for a voltage clamp value of mV. The same analysis was applied to the channel, the result of which is also shown in panel (a) of Fig. 3. Note the difference in time scales on the ordinate in subpanels (a) and (b). Temporal correlations in the fraction of open channels decay rapidly within the first millisecond, whereas the temporal correlation in the fraction of open channels persists for nearly 10 ms.
Equation 22 reveals an important feature of the MC models—the structure of the channel defines the temporal profile of the channel noise statistics. In the case of the channel, the transitions between the five possible channel configurations induce correlations on four time scales, the first four multiples of . The channel has eight possible channel configurations because it has three subunits and one subunit, so the autocorrelation function for the fraction of open channels has seven time scales.
III.2.2 Channel SDE Model
Using the same approximations that allow the channel models to be described as a multivariable OU process, we can compute the autocorrelation function for the proportion of open channels using standard methods Gardiner2004 . We find that the autocorrelation function is identical to Eqn. 22 and thus do not include it in Fig. 3
III.2.3 Subunit SDE Models
We compute the autocorrelation for the InS and IdS models using the OU approximation of in voltage clamp. We derive our results using the Ito calculus. The well-known solution to the OU process in Eqn. 16 at long times is (Gardiner2004, , e.g):
| (23) |
To calculate the autocorrelation in the InS model, we take the expectation of the product of four independent solutions of the form of Eqn. 23 and normalize by the voltage clamp mean and variance shown in Eqns. 17 and 18:
| (24) |
For brevity, we omit terms of order higher than 1/N.
For the IdS model, we instead take a single solution of the form of Eqn. 23 and raise it to the fourth power and normalize by the voltage clamp mean and variance shown in the Eqns. 19 and 20. The autocorrelation of this function is:
| (25) |
Calculation of the higher order terms shows that the same exponential time scales (the first four multiples of ) are present in for all of the models, but the coefficients are different. In particular, Eqns. III.2.3 and III.2.3 show that, to leading order in , the subunit models lack the faster time scales of the channel. As a result, temporal correlations in the subunit-based channel noise models persist longer than those of the MC model and the channel-based SDE model. Fig. 3, voltage clamped at mV, displays these differences in the autocorrelation functions of the subunit models. The dotted line shows the result for the InS model (independent subunit populations) and the dashed line shows the result for the IdS model (identical subunit populations). The decay time in the autocorrelation of the proportion of open channels is longer for the subunit models for both the channel shown in panel in (a) and the channel shown in panel (b).
IV Numerical Simulations
In this section we report results from numerical simulations of the MC model as well as the three SDE models analyzed above. We first verify the results of our analysis of voltage clamp statistics and then measure the statistics of interspike intervals in order to test how well the SDE models replicate the stochastic features of the MC model when voltage is allowed to evolve freely according to Eqn. 1. In all simulations we use the parameter values listed in Table 1. We perform simulations for three different membrane areas: 1, 10, and 100 . The corresponding channel counts are shown in Table 2.
IV.1 Methods
| Symbol | Definition | Value, units |
|---|---|---|
| Membrane capacitance | 1 F / cm2 | |
| Maximal sodium conductance | 120 mS/cm2 | |
| Maximal potassium conductance | 36 mS/cm2 | |
| Leak conductance | 0.3 mS/cm2 | |
| Sodium reversal potential | 115 mV | |
| Potassium reversal potential | mV | |
| Leak reversal potential | 10.6 mV | |
| Sodium channel density | 60 / | |
| Potassium channel density | 18 / |
| Membrane Area | # of channels | |
|---|---|---|
| () | ||
| 1 | 60 | 18 |
| 10 | 600 | 180 |
| 100 | 6000 | 1800 |
Sample Fortran code used to simulate the four stochastic models is available at the ModelDB website (accession number 128502) Goldwyn2010modeldb . All simulations used a time step of size 0.01 ms. We define a spike using two conditions: the membrane potential must exceed 60 mV and it must have remained below 60 mV for the previous 2 ms (approximately the width of a spike). To generate Gaussian random numbers, we first produced uniform random numbers using the Mersenne Twister algorithm mt19937:FortranVer and then transformed these to Gaussian random numbers using the Box-Muller method Press1988 .
In Section IV.3, we characterize the spiking response of the different models in response to stimuli of the form:
| (26) |
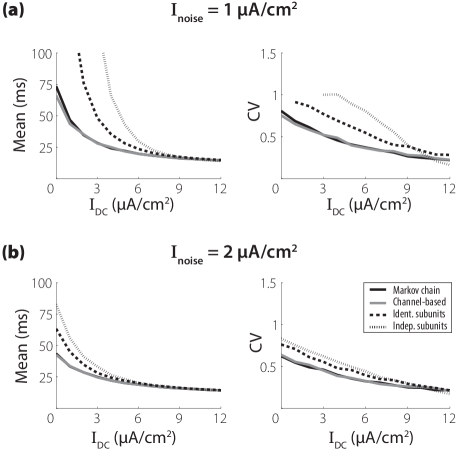
where is a Gaussian white noise process with zero mean and unit variance. This type of input is commonly used to characterize the response of stochastic Hodgkin-Huxley models (Rowat2007, ; Sengupta2010, , e.g.). The additive white noise term can be interpreted as a simplified method for representing the combined effect of numerous synaptic inputs that neurons in cortex and other networks receive in vivo, see for instance Brunel2001 . We simulate spike trains for varying membrane area, DC input current , and input noise . We report the mean and coefficient of variation (CV) for the first 2000 interspike intervals (ISI) for each spike train.
IV.1.1 Markov Chain Model
The Markov chain describing each channel is shown in Eqn. 4. The Markov chain that governs the state of each channel includes three subunits and one subunit and is therefore described by an eight state Markov chain:
| (27) |
The channel is in the conducting state when all three subunits and the subunit are open. The voltage-dependent transition rates for the and subunits are Hodgkin1952 :
The Markov chains in Eqns. 4 and 27 define the possible states of each individual channel. Rather than simulating individual channels in the membrane patch, however, it is more efficient to track the number of channels in each state using the Gillespie algorithm Gillespie1977 ; Chow1996 . At each time step, the fraction of open channels and channels is computed and the voltage is updated using the forward Euler algorithm applied to Eqn. 1.
IV.1.2 Channel SDE Model (IdS)
The channel SDE model is a system of twelve differential equations derived by Fox and Lu Fox1994 . In matrix form, it can be written as:
| (28) | ||||
The vector is made up of entries () that represent the proportion of channels with open subunits. The entries of are denoted ( and ) and represent the proportion of channels with open subunits and open subunits. The vectors are column vectors with a one in the entry and zero elsewhere. Following Fox and Lu, we use the fact that and to define and . This allows us to reduce the dimension of the system of SDEs from fourteen to twelve. We note that this reduction of dimension is exact, following from properties of the and matrices. We include the details of the matrices , , and in the Appendix A.
The values of the and represent proportions of channels in a particular configurations so, in theory, they should lie within five-dimensional and eight-dimensional hypercubes bounded by the intervals . Moreover, since the and each sum to one, the values of these variables should in fact lie on hyperplanes within these hypercubes. If, in the course of numerical simulations, there are excursions of and off of these high dimensional bounded surfaces, then the solution will lack biological meaning because a value that represents the proportions of channels should not be negative or exceed one. A numerical difficulty also arises when these variables do not lie on the proper bounded hyperplanes. To define and , one needs to take matrix square roots of diffusion matrices in every time step. If the and do not lie on the bounded surfaces, then the diffusion matrices, which depend on the values of and , will no longer be guaranteed to be positive semi-definite, which may make it impossible to compute real valued matrix square roots.
In principle, it may be possible to incorporate a projection or a reflection into the numerical method to ensure that and remain on these bounded, high-dimensional surfaces of admissible values. We demonstrate that a simpler approach in which the individual values of the and are not confined within , but rather are free to evolve without boundary conditions, gives an adequate numerical approximation to the interspike interval statistics of the MC model. With this simplification, there is no longer a guarantee that real matrix square roots of the diffusion matrices will exist, so we replace the values of and in the diffusion matrices with their equilibrium values. The validity of approximation is discussed in Appendix B. After implementing the above simplifications, we solved the resulting system of SDEs using the Euler-Maruyama method Higham2001 . Comparing our results with implementations that bound the SDE solutions would be an interesting subject for future work, but is beyond the aims of this paper.
IV.1.3 Subunit SDE Models
The two subunit SDE models that we study are the independent subunit (InS) model:
and the identical subunit (IdS) model
The difference between these two models is that, in the former, we compute multiple independent realizations of the and type subunits and the product of these terms enter into the equation for whereas in the latter, the approximation is made that all subunit classes are assumed to be perfectly correlated so only one SDE is solved for each subunit type and the solution is raised to the appropriate power (4 for and 3 for ). The gating variables represent proportions of open subunits so we enforce boundary conditions that prevent the values of the gating variables from exceeding one or becoming negative.
We note that the form of () that we use is given in Eqn. 9. In particular, the noise terms depend on voltage as well as the subunit variables themselves. We do not apply the equilibrium noise approximation in our simulations of the subunit SDEs, although this approximation has been used in past simulation studies Fox1994 ; Bruce2009 ; Sengupta2010 . We solve these systems of SDEs using the Euler-Maruyama method Higham2001 .
IV.2 Simulation Results: Voltage Clamp
In Figs. 2 and 3, we compare results from numerical simulations for a membrane patch size of 10 against the analytical calculations presented in Section III. To simulate the voltage clamp condition, we fix at a particular value and keep it constant throughout the simulation. Figure 2 shows the mean and standard deviation of the proportion of open and channels as a function of the voltage clamp value. In most cases, the values computed from numerical simulations (symbols) match the analytical results (lines). Of particular note is the fact that the computed values for the MC model (circle) and the channel model (x) are virtually indistinguishable.
The only deviation between the numerical results and the analytical solutions occurs in the subunit models for the mean values of the channels at high voltage values. The cause of this discrepancy is that the analytical treatment assumes that is Gaussian-distributed whereas in the numerical methods the values of are bounded between zero and one. For high voltage values of , the proportion of open channels is very small and the variance is non-zero so approximating the distribution of as a Gaussian will allow to take negative values. This cannot occur in the numerical simulations so the theoretical value for the mean fraction of open channels will be less than the simulated value. As the number of channels increase, the variance of the fraction of open channels decreases, which decreases the probability that a Gaussian-distributed will take negative values. The discrepancy between the analytically and numerically calculated values for the mean fraction of open channels will decreases, therefore, as the number of channels increases.
IV.3 Simulation Results: Interspike Intervals
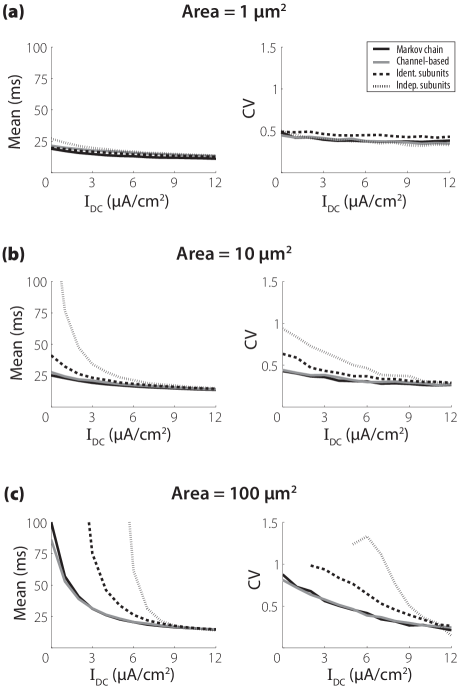
Figure 4 shows mean and CV (left and right columns, respectively) of ISIs for three membrane areas that increase from top to bottom in each column. The input to the model is a constant DC input ( in Eqn. 26). The value of is shown on the x-axis. In general, these simulations show that the rate and regularity of spiking activity produced by the MC (black line) and channel (gray line) models are in close quantitative agreement whereas the IdS (dashed line) and InS (dotted line) models produce, on average, dramatically longer ISIs. The behavior of the models is most disparate for low stimulus levels and larger membrane areas. In these cases, the stimulus is not sufficiently strong to drive regular firing, so spike events are predominantly determined by stochastic fluctuations in the conductances due to channel noise. As the DC current is increased, the models respond to the external stimulus and there is a smaller effect of channel noise on spike timing. This leads all models to exhibit similar to mean ISI and CV values at high current levels.
The mean ISIs for the subunit SDE models exceed those of the MC model for all stimulus conditions and membrane areas. This has been previously observed for the IdS model Sengupta2010 . In the voltage clamp analysis we found that the variance in the proportion of open and channels is much smaller for both of these models than for the MC model. This lack of conductance fluctuations leads to reduced spike rates at low stimulus levels, relative to the MC model.
Overall, the results for the channel model show that it is possible to approximate the MC model with SDE and still obtain quantitatively accurate results, even for small numbers of channels. This is an important and a nontrivial result—the system size expansion is formally valid only in the limit of infinitely many channels, but we show here that it can be applied to a small number of channels, where membrane fluctuations have a major impact on spiking statistics. Moreover, the equilibrium noise approximation and treatment of boundary conditions do not appear to substantially degrade solution accuracy over a wide range of stimuli.
Nevertheless, there are some discrepancies between the channel and MC models. At the smaller membrane areas ( and ), the mean ISIs for the channel model tend to be longer than the MC model ISIs. At the largest membrane area tested, for the case of weak or no input current, this trend is reversed and the channel model has shorter mean ISIs than the MC model. A possible source for these between the channel and MC models is our treatment of the boundary conditions in the channel model and the equilibrium noise approximation. Further investigation of this approximation is needed, but the similar ISI statistics obtained with the channel and MC models suggest that this approximation may be suitable in many cases.
Figure 5 shows results obtained for two different levels of input noise added to the DC current amounts shown on the x-axis. We only present ISI statistics for the membrane size of because the smaller membrane areas produce the same qualitative differences among the models. Overall, the effect of the stimulus noise is to reduce the mean ISIs. Importantly, the ISI statistics of the responses of the MC and channel SDE models to these noisy stimuli remain quantitatively similar. In fact, the stimulus fluctuations elicit spikes even at low or no DC current levels, so the differences in the mean ISIs between the MC and channel SDE models become less apparent. Overall, this result indicates that the equilibrium noise approximation does not break down in the presence of a rapidly fluctuating external stimulus. Finally, the results for the subunit SDEs show, once again, that the stochastic dynamics and spiking activity of these approximate models do not accurately replicate the statistics of the MC model.
V Discussion
Beginning with the work of Fox and Lu Fox1994 ; Fox1997 , the question of whether SDE models of channel noise can accurately approximate MC models has been explored. SDE models of membrane voltage fluctuations in HH models have several attractive features, including possible improvements in the speed of numerical simulations and the opportunity to analyze these models using nonlinear SDE theory (Freidlin1998, , e.g.). In recent years, however, the SDE approach has come under increasing scrutiny. Numerical simulations of the most commonly used SDE model, which we have called the identical subunit model, have shown that this approach produces weaker conductance and voltage fluctuations than the corresponding MC model Bruce2009 ; Faisal2010 . As a consequence, the firing rates of this SDE model are substantially lower Sengupta2010 (and, equivalently, the mean ISIs are longer Zeng2004 ), there is less variability in the occurrences and timing of spikes in response to a brief pulse of current Mino2002 , and information is transmitted at a higher rate Sengupta2010 . Furthermore, these discrepancies persist even as the number of channels increases Zeng2004 ; Bruce2009 ; Sengupta2010 . In sum, there is an emerging consensus in the literature that the MC model cannot be approximated accurately using a subunit system of SDEs.
We have demonstrated in this paper that an alternative SDE approach that is based on the multi-state structure of each ion channel can approximate the channel noise effects that are present in the MC model, even for relatively small numbers of channels, as long as the system-size expansion that is used to derive the SDE model is carried out properly. If one first defines the structure of a channel and then defines the dynamics of the proportions of channels in each configuration, one arrives at the channel-based SDE model (see discussion in Section II.4 and equations in Section IV.1.2). If, instead, one approximates the proportion of subunits in the open or closed states with an SDE, then one obtains a subunit-based SDE model (see discussion in Section II.4 and equations in Section IV.1.3). Through our analysis of the stationary statistics of the proportion of open channels in voltage clamp, we have shown that the former approach, which we call channel-based, can provide a quantitatively accurate approximation to the MC model. We have also confirmed that the latter, subunit-based approach, should not be considered an approximation of the MC model because it has fundamentally different stochastic properties from the MC model. We conclude that the SDE approach is a valid approximate model for channel noise, but that is necessary to properly define the system of SDEs based on the structure of each channel. In particular, one cannot include noise in the subunit equations in the manner suggested by Fox and Lu and expect results that are consistent with the MC ion channel model.
To our knowledge, we are the first to present the numerical results of the channel SDE model Fox:PersonalComm . We simulated three membrane areas (1, 10, and 100 as in Sengupta2010 ), where the number of channels range from 60 to 6000 and the number of channels range from 18 to 1800. Our simulation results show that, in most cases, the ISI statistics for this model in response to constant and noisy current inputs are in close quantitative agreement with the MC model (see Figs. 4 and 5). This finding is encouraging because the channel SDE model was derived by Fox and Lu using a system-size expansion Fox1994 ; Fox1997 that is formally valid only in the limit of a large number of channels. We did not find any evidence that the approximation was invalid for the finite populations of ion channels at hand, and note that in many applications, the channel counts are in fact much higher. For instance, Rowat suggested that typical channel numbers in spike initiation zones may be on the order of to Rowat2007 . The channel counts used in the present study may be relevant to applications in which small patches of neural membrane can drive spiking activity. For example, a node of Ranvier of the auditory nerve fiber can produce a spike in response to cochlear implant stimulation. Typically, the nodes have surface areas of a few square micrometers Imennov2009 and are usually modeled with 1000 or fewer channels Negm2008 ; Imennov2009 ; Woo2010 .
As first pointed out by Fox and Lu Fox1994 and as discussed in Section IV.1.2, numerical simulations of the channel SDE model can be computationally expensive. One particularly compute-intensive part of the algorithm is calculating matrix square roots to determine stochastic terms in the SDE at every time step of the simulation. We have performed this operation using the optimized CBLAS library, yet the channel SDE model still required approximately 25 times as much computational time as the IdS model. Fortunately, as is the case with all three SDE approaches, the channel model has one considerable advantage over MC—its computation time does not depend on the number channels. For example, in our implementation of the Gillespie method, the computational time increased 12-fold as we increased the number of channels from 600 and 180 to 6000 and 1800 . We found that even the channel model, slowest of the SDE approaches discussed in this paper, is faster than the MC model once the number of channels is greater than approximately 1200 and 360 . Furthermore, the computational burden of solving the channel SDE model may be reduced by considering other methods for computing matrix square roots (Allen2007, , e.g.). Higher-order SDE solvers than the Euler-Maruyama method could also speed up SDE simulations (Alzubaidi2010, , e.g.).
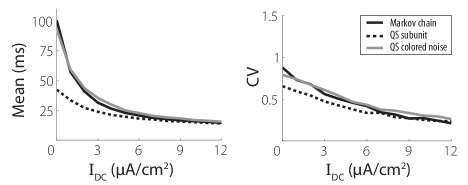
Even with increasingly efficient numerical methods for the channel SDE, a stochastic model that more directly resembles the classical HH equations, as opposed to the twelve-dimensional system of SDEs that defines the channel model, is still desirable, as it would connect more directly with a wealth of studies of the original four-dimensional HH equations. In a simulation study of the Fox and Lu model, Bruce Bruce2009 sought to derive noise terms numerically for the subunit equations that would “correct” the Fox and Lu model so that the fluctuations in the proportions of open channels would match the MC model. We have performed a similar analysis using the analytical voltage clamp results (see Appendix C for details). We can redefine the magnitude of the noise in the subunit equations (i.e., in Eqn. 8) to produce a modified subunit SDE model with the same means and variances for the proportion of open channels in voltage clamp, to . This model is constructed based on our analytical results for the stationary distributions of the proportions of open channels, so we call it a quasistationary model. The ISI statistics for this modified subunit SDE model are shown by the dashed line in Fig. 6. This demonstrates that adjusting the noise terms in a subunit SDE model in order to fit the variances of the open channels in voltage clamp is not sufficient to provide an improved fit to the spiking dynamics of the MC model.
The reason for this can be seen in the multiple time scales of the autocorrelation functions for the MC model (Eqn. 22) and subunit models (Eqns. III.2.3 and III.2.3). We can alter the noise terms in the subunit model so that it produces the correct stationary variances of the fractions of open channels, but we cannot modify the autocorrelation functions in a way that makes them consistent with the MC model. We therefore formulated a second quasistationary model by adding colored Gaussian noise to the conductances in the HH equations (details of this model are in Appendix C). This second quasistationary model produces the stationary distribution of the channel SDE in voltage clamp, so the proportion of open channels in voltage clamp for this model has the same mean, variance, and autocorrelation as the MC and channel SDE models.
ISI statistics for this model are shown by the gray line in Fig. 6. We found that this model reproduced the statistics of the MC model much better than any of the subunit SDE models, so we conclude that temporal correlations in the channel noise play a critical role in influencing spike timing. Moreover, since the structure of the ion channel determines the history-dependence of the channel noise, a valid channel noise model must properly describe the dynamics of the entire channel and not only the kinetics of individual subunits. Using numerical simulations, Bruce has pointed out that the subunit model does accurately approximate the MC model for the case of channels with a single subunit Bruce2009 . Our analysis explains this observation because, for channels with one subunit, the channel-based and subunit-based SDE models are mathematically identical.
We close by emphasizing that the models described in this paper do not represent complete descriptions of channel noise. As is always the case, when one attempts to formulate a mathematical descriptions of complex biological processes, numerous assumptions and simplifications are at play. As our understanding of the structure and dynamics of these membranes improves, it may be necessary to update and improve our mathematical models of channel noise. Nonetheless, the central theme of this work will remain relevant: the statistics of channel noise are shaped by the activity of individual ion channels, and therefore the approximation methods must also include information about the states of the channels in order to correctly capture the state and history dependence of channel noise.
Acknowledgments
We thank Jay Rubinstein for drawing our interest to this problem and for helpful discussion. We also thank Jay Rubinstein and Adrienne Fairhall for helpful discussions. This research has been supported by the National Institute on Deafness and Other Communication Disorders (F31 DC010306—J.H.G., T32 DC005361—N.S.I.), a fellowship from the Advanced Bionics Corporation (N.S.I.), the McKnight Endowment Fund for Neuroscience (M.F.), and the Burroughs-Wellcome Fund (Career Award at the Scientific Interface—E.S.-B.).
Appendix A Matrices used in numerical simulations of the channel SDE model
The state vectors are defined as and . The number of and channels are denoted by and , respectively. The matrices and in Eqn. IV.1.2 are:
The matrices and are the square root matrices of the following diffusion matrices:
where the elements on the diagonal are:
As discussed, we use the equilibrium mean values of and in the diffusion matrices. They are:
and
Appendix B Equilibrium Noise Approximation
B.0.1 Voltage Clamp
The equilibrium noise approximation in voltage clamp can be justified using a small noise expansion Gardiner2004 . Let us define the small parameter and fix the membrane potential at a voltage clamp value so that and can be treated as constants. Assume that can be written as a series in the small noise parameter :
If we plug the small noise expansion into the subunit SDE for in Eqn. 8 and collect terms of , we find:
| (29) |
and for terms of :
| (30) |
Equation 29 shows that satisfies a deterministic equation that does not depend on stochastic fluctuations in . In the context of analyzing the stationary distribution of , therefore, we are justified in replacing with its equilibrium value . If we make this substitution for in the equation for (Eqn. 30) and then form the sum , it is straightforward to arrive at the OU process in Eqn. 16. The equilibrium noise approximation is therefore the approximation of the long-time behavior of in voltage clamp. The same argument applies for the and subunits as well as for the multivariate SDE that defines the channel SDE model.
B.0.2 Time-dependent voltage
Fox and Lu suggested applying this approximation in all cases, not just voltage clamp Fox1994 ; Fox1997 and we have used the approximation to simplify the numerical methods for solving the channel SDE model. When is not in voltage clamp, it evolves naturally and complicates the small noise expansion because it can introduce additional stochastic fluctuations into the gating variables and the voltage-dependent functions transition rate functions. Fox argued that the approximation would be accurate if the relaxation of to its equilibrium value occurred on a much slower time scale than the relaxation of the gating variables (for the case of the subunit SDE model) Fox1997 . Unfortunately, this separation of time scales does not appear to be a generic feature of HH models. Nevertheless, as shown in Figs. 4 and 5, the equilibrium noise approximation appears to be sufficiently accurate to reproduce spiking statistics to a high degree of accuracy.
Appendix C Quasistationary Models
In the Discussion (Section V), we introduced two models that we discuss in greater detail here. We refer to both models as quasistationary approximations because they rely on results from our analysis of the stationary statistics of open channels in Section III. In the first model, we were motivated by Bruce2009 to attempt to improve the accuracy of the subunit SDE model by modifying the noise terms in the gating equations. We have shown that the stationary variances for the proportion of open channels in the subunit SDE models does not match those of the MC model. To correct for this discrepancy, we can redefine in Eqn. 8 to guarantee that the stationary variance of matches the stationary variance of the proportion of open channels under the MC models. The problem is simplified if we invoke the equilibrium noise approximation and use the facts that and that these higher moments of the stationary distribution of are known since in voltage clamp is an OU (Gaussian) process with mean and variance . The final step is to set and solve for . The exact solution would require inverting a nonlinear equation, but if we neglect terms that are of higher order than , we find by finding the roots of , which is quadratic in . The same approach was also used to derive a new expression for so that this model also had the same stationary variance for the channel. The formula for was left unchanged.
As explained in the Discussion, this first approach did not provide a satisfactory approximation to the MC model, so we formulated a second quasistationary approximation. We constructed this second model so that it and the MC model would have the same autocorrelation functions for the proportion of open channels and the same means and variances in voltage clamp. The mathematical structure of this model is somewhat unusual in that the conductance is defined as the sum of a deterministic part (given by the HH equations for , , and ) and a colored Gaussian processes that is defined by the autocovariance function for the proportion of open channels in the MC model. As usual, we illustrate our approach with the channel. The conductance is defined to be:
| (31) |
where is the classical (deterministic) gating variable satisfying an ordinary differential equation of the form of Eqn. 3 and is a stochastic process. To define , first note that the channel SDE model provided a quantitatively accurate approximation of the MC model, so it is reasonable to describe the stationary conductance as a Gaussian process. Second, recall from Eqn. 22 that the autocorrelation function for the proportion of open channels has four distinct time scales (the first four multiples of ). Taken together, these facts lead us to model the conductance as a non-Markovian Gaussian process. The representation theory of Gaussian processes furnishes a systematic method for constructing the stochastic process based on the autocorrelation function for the channel Hida1993 . In particular, this theory guarantees that can be written in terms of a stochastic (Wiener) integral of the form:
The coefficients are voltage-dependent and are computed by solving the system of nonlinear equations:
where . In practice, the system of nonlinear equations defining must be solved numerically. We used the Minimize command in Maple (Waterloo Maple Inc., Version 13) to generate a data table of values of that solved these equations for voltage values ranging from to 120 mV in increments of 0.01 mV. The procedure for constructing the non-Markovian Gaussian process for the conductance is similar but slightly more complicated because there are seven time scales in the autocorrelation function. We omit these details here and direct the interested reader to computer code available at ModelDB Goldwyn2010modeldb .
To numerically integrate this quasistationary model, we used a forward Euler method to update the value of and in each time step, where the stochastic integral for is integrated as follows:
-
1.
Compute the voltage dependent terms , , , , and using the value of from the previous time step.
-
2.
Update the terms associated with each time scale: where , is the time step, and is a mean zero, unit variance Gaussian random generated on each time step.
-
3.
Update the stochastic process: .
References
- (1) R. Fox and Y.-N. Lu, Phys. Rev. E. 49, 3421 (1994)
- (2) H. Mino, J. T. Rubinstein, and J. A. White, Ann. Biomed. Eng. 30, 578 (2002)
- (3) S. Zeng and P. Jung, Phys. Rev. E. 70, 1 (2004)
- (4) I. C. Bruce, Ann. Biomed. Eng. 35, 315 (2007)
- (5) I. C. Bruce, Ann. Biomed. Eng. 37, 824 (2009), http://dx.doi.org/10.1007/s10439-009-9635-z
- (6) B. Sengupta, S. B. Laughlin, and J. E. Niven, Phys. Rev. E 81, 011918 (Jan. 2010), http://link.aps.org/doi/10.1103/PhysRevE.81.011918
- (7) A. Hodgkin and A. Huxley, J. Physiol. 117, 500 (1952)
- (8) P. Dayan and L. Abbott, Theoretical Neuroscience: Computational and Mathematical Modeling of Neural Systems, Computational Neuroscience (MIT Press, London, 2001)
- (9) B. Sakmann and E. Neher, Single-channel recording (Plenum Press, New York, 1995)
- (10) B. Hille, Ion channels of excitable membranes, 3rd ed. (Sinauer Associates, Sunderland, Ma, 2001)
- (11) A. Destexhe and M. Rudolph-Lilith, in Stochastic Methods in Neuroscience, edited by C. Laing and G. Lord (Oxford University Press, 2010) pp. 242–271
- (12) J. R. Clay and L. J. DeFelice, Biophys. J. 42, 151 (May 1983), http://www.sciencedirect.com/science/article/B94RW-4V8RX89-5/2/bb61ba8f%8ba1439708788f057ab6de49
- (13) J. A. White, R. Klink, A. Alonso, and A. R. Kay, J. Neurophysiol. 80, 262 (1998), http://jn.physiology.org/cgi/content/abstract/80/1/262
- (14) C. Pecher, Arch. Int. Physiol. Biochem. 49, 129 (Jan. 1939), http://dx.doi.org/10.3109/13813453909150818
- (15) E. Schneidman, B. Freedman, and I. Segev, Neural. Comput. 10, 1679 (Oct. 1998), http://offcampus.lib.washington.edu/login?url=http://search.ebscohost.c%om/login.aspx?direct=true&db=a9h&AN=1119853&site=ehost-live
- (16) M. C. van Rossum, B. J. O’Brien, and R. G. Smith, J. Neurophysiol. 89, 2406 (2003), http://dx.doi.org/10.1152/jn.01106.2002
- (17) P. Rowat, Neural Comput. 19, 1215 (2007)
- (18) G. Schmid, I. Goychuk, and P. Hänggi, Europhys. Lett. 56, 22 (2001), http://stacks.iop.org/0295-5075/56/i=1/a=022
- (19) G. Schmid, I. Goychuk, and P. Hänggi, Phys. Bio. 1, 61 (2004), http://stacks.iop.org/1478-3975/1/i=2/a=002
- (20) R. C. Cannon, C. O’Donnell, and M. F. Nolan, PLoS Comput. Biol. 6, 1 (2010)
- (21) J. A. White, J. T. Rubinstein, and A. R. Kay, Trends Neurosci. 23, 131 (2000)
- (22) A. A. Faisal, L. P. J. Selen, and D. M. Wolpert, Nat. Rev. Neurosci. 9, 292 (Apr. 2008), http://dx.doi.org/10.1038/nrn2258
- (23) V. Balasubramanian, D. Kimber, and M. J. Berry, Neural Comput. 13, 799 (2001), http://dx.doi.org/10.1162/089976601300014358
- (24) G. G. de Polavieja, J. Theor. Biol. 214, 657 (2002), http://dx.doi.org/10.1006/jtbi.2001.2498
- (25) A. A. Faisal, J. A. White, and S. B. Laughlin, Curr. Biol. 15, 1143 (2005), http://dx.doi.org/10.1016/j.cub.2005.05.056
- (26) L. Liebovitch, D. Scheurle, M. Rusek, and M. Zochowski, Methods 24, 359 (2001)
- (27) D. Soudry and R. Meir, Frontiers Comput Neuro 4, 1 (2010)
- (28) J. Groff, H. DeRemigio, and G. Smith, in Stochastic Methods in Neuroscience, edited by C. Laing and G. Lord (Oxford University Press, 2010) pp. 29–64
- (29) R. F. Fox, Biophys. J. 72, 2068 (May 1997), http://www.sciencedirect.com/science/article/B94RW-4V8X6TH-9/2/43190824%95be1e620797233a0a6b9db7
- (30) J. Shuai and P. Jung, Phys. Rev. Lett. 88, 068102 (2002)
- (31) A. Faisal, in Stochastic Methods in Neuroscience, edited by C. Laing and G. Lord (Oxford University Press, 2010) pp. 297–343
- (32) R. F. Fox, personal communication with N.S.I. (Feb 2010)
- (33) E. Skaugen and L. Walløe, Act. physiol. Scand. 107, 343 (1979)
- (34) C. Gardiner, Handbook of Stochastic Methods for Physics, Chemistry and the Natural Sciences, 3rd ed., Springer Series in Synergetics (Springer, New York, 2004)
- (35) J. H. Goldwyn, “On stochastic differential equation models for ion channel noise in hodgkin-huxley neurons,” http://senselab.med.yale.edu/senselab/modeldb/ (Sept 2010)
- (36) R. Woloshyn, “Mersenne Twister implemented in Fortran,” http://www.math.sci.hiroshima-u.ac.jp/~m-mat/MT/VERSIONS/FORTRAN/mtfort90.f (Sept 1999)
- (37) W. Press, B. Flannery, S. Teukolsky, and W. Vetterling, Numerical Recipes: The Art of Scientific Computing (Cambridge University Press, New York, 1988)
- (38) N. Brunel, F. S. Chance, N. Fourcaud, and L. F. Abbott, Phys. Rev. Lett. 86 (2001)
- (39) D. T. Gillespie, J. Phys. Chem. 81, 2340 (1977)
- (40) C. C. Chow and J. A. White, Biophys. J. 71, 3013 (1996)
- (41) D. Higham, SIAM Review 43, 525 (2001)
- (42) M. Freidlin and A. Wentzell, Random Perturbations of Dynamical Systems (Springer, New York, 1998)
- (43) N. S. Imennov and J. T. Rubinstein, IEEE Trans. Biomed. Eng. 10, 2493 (2009)
- (44) M. H. Negm and I. C. Bruce, in International IEEE EMBS Conference (2008) pp. 654–658
- (45) J. Woo, C. Miller, and P. Abbas, J. Assoc. Res. Otolaryngol. 11, 283 (2010)
- (46) E. Allen, Modeling with Ito stochastic differential equations (Springer, The Netherlands, 2007)
- (47) H. Alzubaidi, H. Gilsing, and T. Shardlow, in Stochastic Methods in Neuroscience, edited by C. Laing and G. Lord (Oxford University Press, 2010) pp. 344–366
- (48) T. Hida and M. Hitsuda, Gaussian Processes, Translations of Mathematica Monographs (American Mathematical Society, Rhode Island, 1991)