The Evolution of Circumstellar Disks Surrounding Intermediate Mass Stars: IC 1805
Abstract
We report the results of a study of the intermediate and high mass stars in the young, rich star-forming complex IC 1805, based on a combination of optical, near-infrared, and mid-infrared photometry, and classification spectra. These data provide the basis for characterizing the masses and ages for stars more massive than M☉ and enable a study of the frequency and character of circumstellar disks associated with intermediate- and high-mass stars. Optically thick accretion disks among stars with masses are rare (2% of members) and absent among more massive stars. A larger fraction (10%) of stars with masses appear to be surrounded by disks that have evolved from the initial optically thick accretion phase. We identify four classes of such disks. These classes are based on spectral energy distributions (SEDs) of excess emsission above photospheric levels: disks that are (1) optically thin based on the magnitude of the observed excess emission from 2 to 24 m; (2) optically thin in their inner regions ( 20 AU) and optically thick in their outer regions; (3) exhibit empty inner regions ( 10 AU) and optically thin emission in their outer regions; and (4) exhibit empty inner regions and optically thick outer regions. We discuss, and assess the merits and liabilities of, proposed explanations for disks exhibiting these SED types and suggest additional observations that would test these proposals.
1 Introduction
The advent of sensitive ground- and space- based infrared (IR) instrumentation has provided astronomers with the tools to determine the evolutionary history of the circumstellar disks that appear to surround stars of all masses at birth. Spectral energy distributions (SEDs) that exhibit excess IR emission above photospheric levels provide the basis for detecting such disks and inferring the radial and vertical distribution of disk material. Early studies focused on establishing the timescales over which disks survive as optically thick accretion disks (e.g., Strom et al. 1989). These initial results placed an important constraint on the timescales over which disks are likely to form planets. Later, astronomers began to focus on changes in the radial distribution of small dust grains (Strom et al. 1989; Skrutskie et al. 1990) in order to search for disks that have begun to ‘transition’ from their initial, optically thick accretion phase to more advanced evolutionary states. Such studies provided the first hints of changes wrought by processes such as photoevaporation, planetesimal formation, and giant planet formation (see, for example, the original discussion in Skrutskie et al. 1990; Clarke, Gendrin, & Sotomayor 2001). From studies of large samples of low-mass ( 1 M☉) stars, it is now generally accepted that (a) the fraction of stars surrounded by optically thick accretion disks decreases from 80-90% among the youngest observable stellar populations, to 50% at 3 Myr and 10% at 5 Myr (Haisch, Lada, & Lada 2001); (b) a modest fraction of disks (5-15%) in clusters ranging in age from 1-5 Myr appear to exhibit IR SEDs that suggest significant evolution from an initial, optically thick state. Examples include disks with optically thin inner holes and optically thick outer disks, disks that show evidence of grain settling and possible grain growth, and disks that have SEDs consistent with emission from optically thin dust or gas (see Currie et al. 2009 or Cieza et al. 2010 for a recent review).
While much attention has been devoted to understanding disk evolution around solar-like stars, relatively little work has focused on the early stages of disk evolution among higher mass objects, largely because robust samples of nearby, young intermediate mass objects are not available. Early work (Strom 1972; Strom et al. 1972; Hillenbrand et al. 1993) as well as more recent work (Dahm & Hillenbrand 2007; Currie & Kenyon 2009) suggested that the fraction of massive stars surrounded by optically thick accretion disks at a given age is considerably smaller than the fraction of such disks found among solar-like stars.
We report here the results of a study of IC 1805, a young, rich cluster located at a distance of 2350 pc in the molecular cloud associated with W4 (Vasilevskis, Sanders, & van Altena 1965; Sagar et al. 1988). Our goal is to take advantage of the large (500 stars) population of B and A stars in this region to quantify the fraction of intermediate mass stars surrounded by optically thick accretion disks and to search for and understand the nature of disks transitioning from this phase.
Our study relies on a combination of optical, near-IR, and Spitzer Space Telescope (Werner et al. 2004) mid-IR photometry combined with classification spectra obtained for a large sample of IC 1805 members. We make use of the photometry and classification spectra to (a) locate stars in an observational Hertzpring-Russell (HR) diagram and to determine ages and masses for members; and (b) to derive reddening-corrected spectral energy distributions, which enable us to assess both the fraction of stars surrounded by optically thick accretion disks and the number and character of various types of disks in more advanced evolutionary states.
We first discuss our sample and present the photometric data and their uncertainties (§2); describe our methods for determining likely members of IC 1805 and their ages and masses (§3); and report our results for a sample of 63 stars with IR excesses and masses 2 M☉ drawn from a sample of 548 likely members of this cluster (§4). We use reddening-corrected SEDs to identify stars surrounded by optically thick accretion disks, as well as four classes of objects whose SEDs suggest the presence of disks in different physical states. These states presumably represent alternative paths, or “next steps” for disks as they evolve from initial optically thick accretion disks to more advanced evolutionary states. In §5, we discuss the possible physical mechanisms that lead to these four SED classes (and presumably different evolutionary states), assess the merits and liabilities of each of the proposed mechanisms, and suggest observational tests aimed at sorting among these possibilities.
2 Observations
2.1 Target Selection and Optical/NIR Photometry
The primary goal of the current study is to determine the disk properties of intermediate mass stars in IC 1805. We observed this region with Spitzer using the Infrared Array Camera (IRAC; Fazio et al. 2004a) and the Multiband Imaging Photometer for Spitzer (MIPS; Rieke et al. 2004). We used the literature to identify candidate members; the photometric study by Massey et al. (1995a) provides a list of 1023 optically-selected candidate members of IC 1805 down to a mass of about 2 M☉. Most of these objects are within the region covered by our IRAC observations; just 220 of these stars lie outside the IRAC map. We matched the optical sources to sources in the Two-Micron All-Sky Survey (2MASS; Skrutskie et al. 2006) to obtain internally consistent positions and near-IR photometry. Two of the optical sources (Massey et al. Nos. 292 and 461) were identified with a single 2MASS source. We have arbitrarily assigned the NIR measurements to No. 461, which is the brighter of the two. There are therefore 802 stars that are potential members of IC 1805 that have been observed with IRAC. The MIPS map covers a region that is somewhat larger than that covered by the IRAC map. Consequently, we have Spitzer detections or upper limits for at least one wavelength for 974 of the stars included in the study by Massey et al. (1995a).
2.2 IRAC
Spitzer/IRAC observes at 3.6, 4.5, 5.8, and 8 m. In order to extract magnitudes for the 802 IC 1805 stars observed in the IRAC bands, we started with the Spitzer Science Center (SSC) pipeline-produced basic calibrated data (BCDs), version S14.4, for the IRAC data from our program, 20052, AORKEY 13846016. These observations were 12 second high dynamic range (HDR) observations (meaning short and long exposures are taken at each pointing), in a 99 square map, with 5 medium dithers per pointing for a total integration time of 60 seconds per pointing. We ran the IRAC Artifact Mitigation code written by S. Carey and available on the SSC website. We constructed a mosaic from the corrected BCDs using the SSC mosaicking and point-source extraction (MOPEX) software (Makovoz & Marleau 2005), with a pixel scale of 1.22 px-1, very close to the native pixel scale. Our final map covers 0.5 square degrees, centered on 02:32:42, +61:27:00 (see Fig. 3 below). Note that the 3.6 and 5.8 m channels (ch. 1 & 3) share a field of view which is offset from the field of view shared by the 4.5 and 8 m channels (ch. 2 & 4), and thus the maps for 3.6/5.8 cover the same total area but a region of sky offset by 5 northwest from the 4.5/8 maps.
Using an IDL photometry routine, we performed aperture photometry on the known target positions in the combined mosaic for the short and long exposures separately, using a 3-pixel aperture and a sky annulus of 3-7 pixels. The (multiplicative) aperture corrections we used follow the values given in the IRAC Data Handbook: 1.124, 1.127, 1.143, and 1.234 for IRAC channels 1, 2, 3, and 4, respectively. For stars brighter than magnitude 9.5, 9.0, 8.0, and 7.0 for IRAC-1, 2, 3, and 4, respectively, we took the flux densities from the short rather than the long exposure. We took the errors returned by the IDL photometry routine, which are statistical in nature, and added them in quadrature to a 5% flux density error floor. With this floor, 91% of the IRAC-1 (3.6 m) sources have errors less than 0.06 mag, 80% of the IRAC-2 (4.5 m) sources have errors less than 0.06 mag, 95% of the IRAC-3 (5.8 m) sources have errors less than 0.1 mag, and 60% of the IRAC-4 (8 m) sources have errors less than 0.15 mag.
We compared the flux densities as obtained from a 3-pixel aperture and a sky annulus of 3-7 pixels (with the aperture corrections as listed above) to that obtained from a 2 pixel aperture and a sky annulus of 2-6 pixels (with the appropriate aperture corrections as listed on the SSC website). In most cases, the flux densities agreed to well within the 5% flux density error floor. In all of the remaining cases, the errors were within the 0.3 magnitudes estimated to be the uncertainty due to variation in local reddening as discussed in §4.1.
The photometric observations for this optically-selected sample are reported in Table 1. Column 1 lists the optical number from Massey et al. (1995a); columns 2 and 3 give the RA and Dec; column 4 gives the 2MASS name; columns 5-7 list the magnitudes from Massey et al.; columns 8-10 give the values from 2MASS; columns 11-14 give the IRAC magnitudes and errors (or limit); and column 15 gives the MIPS magnitude and errors (or limit) – see next section. The total numbers of objects from the optically-selected sample detected (or for which we have limits) for each band are listed in Table 2.
| (1) | (2) | (3) | (4) | (5) | (6) | (7) | (8) | (9) | (10) | (11) | (12) | (13) | (14) | (15) |
|---|---|---|---|---|---|---|---|---|---|---|---|---|---|---|
| Opt. | RA | Dec | 2MASS name | |||||||||||
| num. | (J2000; deg) | (J2000; deg) | (mag) | (mag) | (mag) | (mag) | (mag) | (mag) | (mag) | (mag) | (mag) | (mag) | (mag) | |
| 1 | 38.620958 | 61.421306 | 02342903+6125167 | 16.50 | 16.19 | 15.17 | 13.23 0.03 | 12.98 0.04 | 12.83 0.04 | 12.70 0.06 | 12.71 0.06 | 12.47 0.08 | 12.00 0.12 | 7.15 |
| 2 | 38.617125 | 61.343194 | 02342811+6120355 | 16.90 | 16.20 | 15.20 | 13.07 0.02 | 12.65 0.03 | 12.52 0.03 | 12.49 0.06 | 12.47 0.06 | 12.41 0.07 | 12.16 0.10 | 10.15 |
| 3 | 38.603875 | 61.556361 | 02342493+6133229 | 16.09 | 15.63 | 14.87 | 13.05 0.02 | 12.76 0.03 | 12.56 0.03 | 12.48 0.06 | 12.46 0.06 | 12.45 0.06 | 12.56 0.07 | 8.98 |
| 4 | 38.602333 | 61.548278 | 02342456+6132538 | 14.69 | 14.73 | 14.01 | 12.07 0.04 | 11.87 0.03 | 11.70 0.04 | 11.35 0.06 | 11.20 0.06 | 11.07 0.06 | 10.81 0.06 | 9.94 0.13 |
| 5 | 38.595042 | 61.421250 | 02342281+6125165 | 16.28 | 15.72 | 14.70 | 12.66 0.11 | 12.13 0.03 | 12.00 0.03 | 11.97 0.06 | 12.00 0.06 | 11.91 0.07 | 11.86 0.14 | 9.39 |
| band | total detected | total with limits |
|---|---|---|
| IRAC 1 (3.6 m) | 678 | 7 |
| IRAC 2 (4.5 m) | 712 | 4 |
| IRAC 3 (5.8 m) | 685 | 0 |
| IRAC 4 (8 m) | 708 | 0 |
| MIPS 1 (24 m) | 48 | 869 |
2.3 MIPS
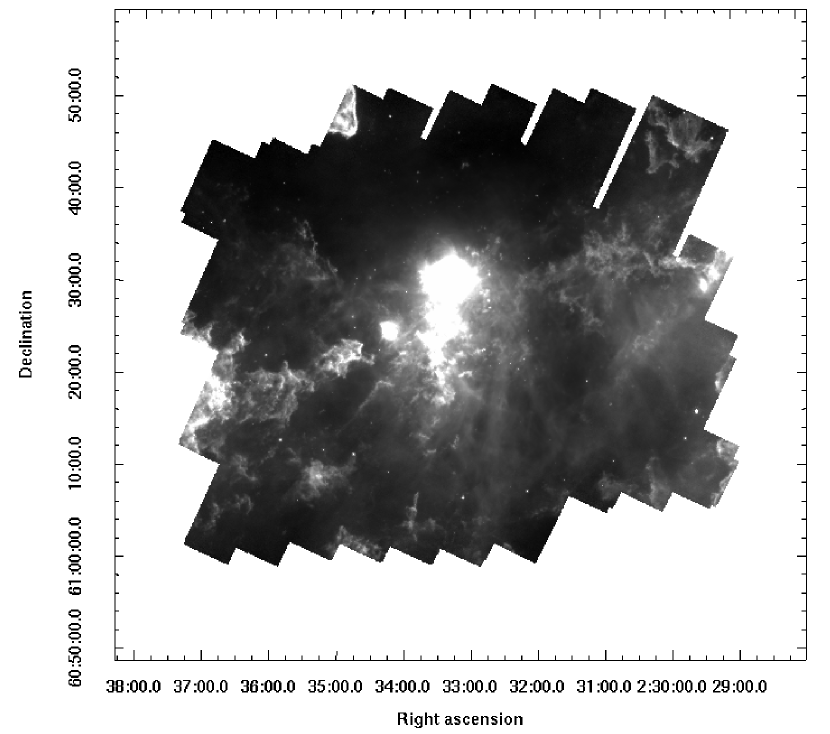
Spitzer/MIPS observations were made at 24, 70, and 160 m. As for IRAC, we started with the SSC pipeline-produced BCDs, downloading data in this region, both from our program (20052) and another, 3234 (PI J. Greaves). The data from 20052 (AORKEYs 13846272, 13846528, 13846784) were processed under S16.0.1, but the data from 3234 (AORKEYs 10498048 and 10498304) were processed under S14.4. (For a description of the pipeline, see Gordon et al. 2005.) The only material difference in these pipeline versions is in the treatment of very bright sources, and none of our targets crosses this threshold. The observations from program 20052 were a 55 raster map of 3-second, 7-cycle small-field photometry-mode observations, resulting in an integration time of 312 seconds per position. The observations from program 3234 were fast scan maps with 302 cross-scan steps (95% of detector width), for a total of 15 seconds per position. We combined all of the BCDs using MOPEX into one deg2 mosaic centered on the region of interest (roughly 02:33:10, +61:26:20), with a pixel scale of 2.5 px-1, close to the native pixel scale. In most of this region, the total integration time is 327 seconds, but it varies according to which (and how many) BCDs were included at a given location. Figure 1 shows the complete 24 m mosaic in the IC 1805 region. Sensitivity is a strong function of location not only because of the number of BCDs included at any given position, but also because of the wide variation in sky brightness.
We extracted sources from our 24 m mosaics using the APEX-1-frame portion of MOPEX, with point response function (PRF)-fitting photometry of the image mosaics. For six bright sources, aperture photometry was found to be a better measure of the total flux density from the object; for these objects, we used a 13′′ aperture, with a 20-32′′ sky annulus, and an aperture correction of 1.17 as tabulated on the SSC website. For errors on these values, we derived the errors from the signal-to-noise as returned by APEX. These are statistical uncertainties; the systematic uncertainty in the zero-point of the conversion from instrumental units to calibrated flux density units is estimated to be 4% (Engelbracht et al. 2007). So, for the errors reported in the table above, we added 4% in quadrature to the errors derived from the APEX results.
Most of our optically-identified objects are not detected at 24 m. In order to obtain upper limits, we placed an aperture and annulus at the location of the corresponding optical source and took the absolute value of the difference between the aperture and annulus flux density. We tested different apertures, and found that the limits obtained for the same aperture as used for the bright sources were unacceptable because they often included faint background sources. As a result, we chose to use a small aperture of 3.5′′, an annulus of 20-32′′, and an aperture correction of 2.57 (again, as tabulated on the SSC website) to obtain these upper limits. We then multiplied these values by 5 to obtain the 5 upper limit values reported in the last column of Table 1. We tested the viability of these automatically-determined values by spot-checking several undetected targets in a variety of background regions and found good agreement.
No viable data were obtained at 70 or 160 m for our targets.
3 Properties of IC 1805
3.1 Membership Criteria
In order to analyze the disk properties of intermediate mass stars in IC 1805 as a function of stellar mass and age, we must first separate cluster members from contaminating field stars. The photometric and spectroscopic data provide three criteria that can be used to select likely members: 1) reddening consistent with that measured for the definite early type (B2.5V and earlier) members selected by Massey et al. (1995a); 2) the presence of the interstellar feature 4430 in classification dispersion spectra, which is absent in the spectra of foreground stars; and 3) position in the HR diagram.
To assist with the determination of reddening, we obtained spectra of a sample of 229 of the 802 candidates. All but approximately 20 of these stars were selected at random; the exceptions were those objects which appeared to have obvious and strong IR excesses based on our preliminary reductions of the IRAC data. The observations were obtained with the Hydra multi-object fiber spectrograph at the WIYN telescope on October 30 to November 2, 2007. The spectra covered the wavelength range 3600 to 5300 Å at a resolution of 1.3 Å px-1 and a typical signal-to-noise ratio (SNR) of 30-100. Spectral classification was effected by comparing the stars in IC 1805 with well-studied stars in the Pleiades, which were used as standards (Crawford & Perry 1976). We estimate that the maximum likely error in type is two subtypes for stars A0 and later. The uncertainty for the early B-type stars could be as much as 5 subtypes because of the lack of suitable standards earlier than B7 in the Pleiades. For these hotter stars, however, we can derive the reddening from photometry alone (see below).
In their study, Massey et al. (1995a) obtained spectra for 38 early-type stars (B2.5V to O4) and found that the reddening for cluster members fell in the range 0.681.29 mag. For early type stars (those with ), we can use the method to determine the reddening (Massey et al. 1995b). Basically, this procedure involves using the -index, which is independent of reddening, to derive the intrinsic color and then comparing the intrinsic and observed colors to determine the reddening. For the cooler stars () this method does not yield a unique solution for the intrinsic color, and classification spectra are required. We have also correlated the measured reddening with the presence or absence of the interstellar feature 4430. We find that stars with a detectable 4430 band (equivalent width 0.5 Å) have reddening in the range , a range only slightly broader than that estimated by Massey et al. (1995a). By extending the lower limit for membership to of 0.5, we include all but four of the 63 stars with IR excesses (see §4 for the determination of IR excesses); stars with IR excesses are likely also to be members of IC 1805.
For the purposes of this study, therefore, we will use reddening of coupled with a location in the HR diagram that is consistent with membership in IC 1805 as our two primary membership criteria. We have used the method to estimate reddening for stars with and . The photometry becomes increasingly less accurate for stars fainter than =15 (Massey et al. 1995a), and for these fainter stars and for all stars with we have estimated the reddening from the spectral types.
The 229 stars that meet our criteria for membership in IC 1805 are listed in Table 3. The first column gives the star number assigned by Massey et al. (1995a). (The members that have IR excesses are marked with an asterisk.) The second column gives the spectral type from the current study, and the third column lists the equivalent width of 4430 if it was detected. The fourth column gives the reddening derived from the method for those stars with , and the fifth column gives the reddening derived from the spectral type. The sixth column gives the adopted reddening , which as noted above was derived from for the hot stars for which this method is valid or from spectral types for the cooler stars. The remaining columns give the reddening corrected values of , , and that will be used below to construct color-magnitude and color-color plots.
An additional 27 stars have IR excesses but no independent measurement of reddening, and four more stars with excesses have reddening based on spectral types in the range . These 31 stars do fall in a reasonable place in an HR diagram after correction for the mean reddening of IC 1805 (Massey et al. 1995a), and we will assume that all 31 are members of IC 1805 by virtue of these excesses.
Of the remaining stars, 151 can be rejected on the basis of their reddening or positions in an HR diagram. Table 4 summarizes the number of stars rejected and the reasons for rejection.
| (1) | (2) | (3) | (4) | (5) | (6) | (7) | (8) | (9) |
|---|---|---|---|---|---|---|---|---|
| opt. no.bbAn additional asterisk (*) denotes that we determine that the object has an IR excess. | spectral | EQW(4430) | from | from | adopted | |||
| type | (Å) | method | spec. type | (mag) | (mag) | (mag) | ||
| (mag) | (mag) | (mag) | ||||||
| 3 | B9 | 1.3 | 0.86 | 0.86 | 12.10 | 12.20 | -0.10 | |
| 4* | B8 | 1.3 | 0.82 | 0.82 | 11.36 | 11.47 | -0.10 | |
| 6* | B8 | 1 | 0.80 | 0.80 | 11.76 | 11.86 | -0.10 | |
| 8 | A3 | 1.4 | 0.63 | 0.63 | 12.17 | 12.10 | 0.08 | |
| 13* | B7 | 1.5 | 0.81 | 0.64 | 0.81 | 8.40 | 8.68 | -0.28 |
| 15* | B7 | 1.25 | 0.82 | 0.82 | 11.84 | 11.95 | -0.10 | |
| 17 | A2 | 1 | 0.59 | 0.59 | 12.42 | 12.37 | 0.05 | |
| 18* | A0 | 1.2 | 1.00 | 0.88 | 0.88 | 11.47 | 11.52 | -0.05 |
| 19 | F1 | 0.79 | 0.79 | 12.31 | 11.99 | 0.32 | ||
| 21 | A0 | 1.35 | 0.53 | 0.53 | 13.56 | 13.59 | -0.02 | |
| 25 | 0.80 | 0.80 | 6.60 | 6.91 | -0.31 | |||
| 31 | 1.03 | 1.03 | 10.26 | 10.51 | -0.24 | |||
| 36 | A0 | 1.3 | 0.73 | 0.73 | 12.69 | 12.72 | -0.02 | |
| 40 | 0.78 | 0.78 | 11.02 | 11.19 | -0.16 | |||
| 41 | 1.07 | 1.07 | 10.01 | 10.17 | -0.16 | |||
| 43 | A0 | 0.70 | 0.56 | 0.70 | 11.32 | 11.48 | -0.17 | |
| 45 | F0 | 0.65 | 0.65 | 13.09 | 12.80 | 0.30 | ||
| 46 | 0.81 | 0.81 | 10.46 | 10.67 | -0.21 | |||
| 49 | 0.84 | 0.84 | 8.22 | 8.49 | -0.27 | |||
| 50 | 0.88 | 0.88 | 9.80 | 9.95 | -0.15 | |||
| 55 | F6 | 0.56 | 0.56 | 13.42 | 12.96 | 0.46 | ||
| 57 | F2 | 0.53 | 0.53 | 13.24 | 12.90 | 0.35 | ||
| 59 | B5 | 1.1 | 0.72 | 0.66 | 0.72 | 11.60 | 11.76 | -0.16 |
| 63 | 0.77 | 0.77 | 11.39 | 11.55 | -0.16 | |||
| 65* | A5 | 2.0: | 0.73 | 0.73 | 12.93 | 12.79 | 0.15 | |
| 67 | F0 | 0.66 | 0.66 | 12.76 | 12.46 | 0.30 | ||
| 71 | A5 | 1.12 | 1.12 | 11.16 | 11.27 | -0.10 | ||
| 72 | 1.24 | 1.24 | 9.39 | 9.79 | -0.41 | |||
| 74 | 0.75 | 0.75 | 5.76 | 6.08 | -0.32 | |||
| 75 | 0.86 | 0.86 | 10.06 | 10.31 | -0.24 | |||
| 77 | 0.92 | 0.92 | 10.72 | 10.94 | -0.22 | |||
| 78 | F0 | 0.64 | 0.64 | 13.18 | 12.89 | 0.30 | ||
| 79 | 0.75 | 0.75 | 10.10 | 10.32 | -0.22 | |||
| 85* | B6 | 1.1 | 0.75 | 0.75 | 12.18 | 12.29 | -0.10 | |
| 86* | A0 | 0.9 | 0.91 | 0.91 | 12.17 | 12.20 | -0.02 | |
| 88 | 0.88 | 0.88 | 8.53 | 8.83 | -0.29 | |||
| 90 | 0.85 | 0.85 | 8.22 | 8.51 | -0.29 | |||
| 92 | 0.81 | 0.81 | 10.64 | 10.84 | -0.20 | |||
| 93* | A4 | 1.3 | 0.84 | 0.84 | 12.31 | 12.19 | 0.13 | |
| 94 | 0.88 | 0.88 | 9.98 | 10.21 | -0.23 | |||
| 95 | G0 | 0.58 | 0.58 | 12.68 | 12.10 | 0.58 | ||
| 99 | 0.86 | 0.86 | 10.14 | 10.36 | -0.22 | |||
| 100 | 0.80 | 0.80 | 8.84 | 9.09 | -0.26 | |||
| 102 | 0.74 | 0.74 | 10.91 | 11.08 | -0.17 | |||
| 106 | 0.92 | 0.92 | 8.63 | 8.89 | -0.26 | |||
| 107* | A2 | 1.4 | 0.75 | 0.75 | 11.42 | 11.38 | 0.05 | |
| 108 | 0.68 | 0.68 | 10.01 | 10.24 | -0.23 | |||
| 109 | 0.81 | 0.81 | 9.25 | 9.49 | -0.24 | |||
| 110 | B4 | 1.1 | 0.77 | 0.66 | 0.77 | 10.19 | 10.41 | -0.21 |
| 111 | B4 | 1.5 | 1.01 | 1.01 | 11.75 | 11.86 | -0.10 | |
| 112 | B5 | 1.1 | 0.96 | 0.88 | 0.96 | 10.76 | 10.95 | -0.18 |
| 113 | F8 | 0.60 | 0.60 | 12.91 | 12.39 | 0.52 | ||
| 114 | 0.95 | 0.95 | 9.03 | 9.28 | -0.25 | |||
| 115 | 0.74 | 0.74 | 9.96 | 10.18 | -0.22 | |||
| 121 | B5 | 1.1 | 0.92 | 0.92 | 11.59 | 11.70 | -0.10 | |
| 124 | 1.01 | 1.01 | 4.62 | 4.94 | -0.31 | |||
| 125 | 1.03 | 1.03 | 10.26 | 10.51 | -0.25 | |||
| 126 | 1.22 | 1.22 | 8.72 | 8.98 | -0.26 | |||
| 128* | A5 | 1.4 | 0.93 | 0.93 | 12.07 | 11.93 | 0.14 | |
| 129 | A1 | 1.2 | 0.79 | 0.79 | 12.66 | 12.65 | 0.01 | |
| 130 | 0.86 | 0.86 | 10.54 | 10.76 | -0.23 | |||
| 131 | 0.87 | 0.87 | 9.06 | 9.34 | -0.28 | |||
| 136 | 0.83 | 0.83 | 7.79 | 8.08 | -0.29 | |||
| 137* | A2 | 0.8 | 0.78 | 0.78 | 11.73 | 11.67 | 0.06 | |
| 138 | 0.95 | 0.95 | 9.73 | 9.96 | -0.23 | |||
| 139* | A6 | 0.9 | 0.96 | 0.87 | 0.96 | 10.75 | 10.94 | -0.20 |
| 142 | 0.74 | 0.74 | 8.67 | 8.92 | -0.25 | |||
| 143* | F4 | 0.51 | 0.51 | 13.81 | 13.41 | 0.40 | ||
| 144* | 0.81 | 0.81 | 5.09 | 5.40 | -0.31 | |||
| 145 | 0.90 | 0.90 | 10.34 | 10.53 | -0.19 | |||
| 146 | 0.77 | 0.77 | 10.90 | 11.08 | -0.19 | |||
| 148 | 0.79 | 0.79 | 8.65 | 8.94 | -0.28 | |||
| 153 | 0.79 | 0.79 | 10.35 | 10.53 | -0.18 | |||
| 154 | A3 | 1.5 | 0.82 | 0.82 | 12.68 | 12.61 | 0.08 | |
| 155 | 0.77 | 0.77 | 6.85 | 7.17 | -0.32 | |||
| 156 | 0.86 | 0.86 | 8.10 | 8.37 | -0.27 | |||
| 162 | 0.85 | 0.85 | 10.52 | 10.73 | -0.21 | |||
| 163 | A3 | 1.14 | 1.14 | 10.62 | 10.55 | 0.07 | ||
| 166 | 0.99 | 0.99 | 10.73 | 10.95 | -0.22 | |||
| 176 | 0.93 | 0.93 | 8.46 | 8.73 | -0.27 | |||
| 177 | 0.85 | 0.85 | 7.37 | 7.68 | -0.31 | |||
| 179 | G0 | 0.54 | 0.54 | 12.26 | 11.69 | 0.58 | ||
| 180* | B5 | 1.1 | 1.13 | 1.13 | 11.18 | 11.29 | -0.10 | |
| 182 | A4 | 0.6: | 0.75 | 0.75 | 13.78 | 13.68 | 0.11 | |
| 183* | B2 | 1.4 | 1.21 | 1.00 | 1.21 | 6.81 | 7.12 | -0.31 |
| 184* | B8 | 1 | 0.94 | 0.94 | 12.11 | 12.22 | -0.10 | |
| 185 | 0.83 | 0.83 | 7.07 | 7.37 | -0.30 | |||
| 186 | 0.78 | 0.78 | 8.82 | 9.11 | -0.29 | |||
| 188 | A0 | 1.5 | 0.80 | 0.80 | 13.15 | 13.20 | -0.05 | |
| 189 | 1.16 | 1.16 | 10.10 | 10.35 | -0.25 | |||
| 190 | B8 | 1.0: | 0.76 | 0.76 | 12.56 | 12.66 | -0.10 | |
| 195 | B5 | 0.9 | 0.85 | 0.85 | 11.98 | 12.09 | -0.10 | |
| 197 | 0.86 | 0.86 | 5.87 | 6.19 | -0.32 | |||
| 199 | 0.78 | 0.78 | 7.90 | 8.18 | -0.28 | |||
| 201* | A0 | 1.25 | 0.75 | 0.75 | 13.63 | 13.64 | 0.00 | |
| 206 | B5 | 1.1 | 0.82 | 0.72 | 0.82 | 10.75 | 10.96 | -0.20 |
| 207 | F3 | 0.60 | 0.60 | 11.42 | 11.07 | 0.35 | ||
| 208 | 0.98 | 0.98 | 10.68 | 10.90 | -0.22 | |||
| 209 | B5 | 1.4 | 0.94 | 0.94 | 12.29 | 12.40 | -0.10 | |
| 223 | 1.09 | 1.09 | 8.86 | 9.12 | -0.27 | |||
| 224 | A9 | 0.55 | 0.55 | 13.06 | 12.79 | 0.28 | ||
| 228 | B8 | 0.9 | 1.00 | 1.00 | 11.78 | 11.88 | -0.10 | |
| 229 | F5 | 0.71 | 0.71 | 12.59 | 12.15 | 0.44 | ||
| 234 | F6 | 0.62 | 0.62 | 12.95 | 12.49 | 0.46 | ||
| 237 | F2 | 0.65 | 0.65 | 13.13 | 12.79 | 0.35 | ||
| 244* | B5 | 0.9 | 0.68 | 0.55 | 0.68 | 9.20 | 9.44 | -0.24 |
| 249 | A0 | 1.75 | 0.65 | 0.65 | 13.57 | 13.63 | -0.05 | |
| 251 | A1 | 0.8 | 0.76 | 0.76 | 13.21 | 13.20 | 0.01 | |
| 255 | B5 | 0.8 | 0.69 | 0.69 | 12.62 | 12.72 | -0.10 | |
| 262 | A1 | 0.9: | 0.77 | 0.77 | 12.85 | 12.84 | 0.01 | |
| 271* | F8 | 1.03 | 1.03 | 12.77 | 12.28 | 0.50 | ||
| 272* | F5 | 0.51 | 0.51 | 13.98 | 13.54 | 0.44 | ||
| 288 | A1 | 0.9 | 0.65 | 0.65 | 13.39 | 13.37 | 0.03 | |
| 293 | A7 | 0.84 | 0.84 | 12.76 | 12.57 | 0.20 | ||
| 297 | A2 | 1.3 | 0.94 | 0.94 | 12.89 | 12.85 | 0.05 | |
| 306 | F0 | 0.52 | 0.52 | 12.22 | 11.92 | 0.30 | ||
| 307 | F6 | 0.84 | 0.84 | 13.70 | 13.25 | 0.46 | ||
| 308 | G5 | 0.84 | 0.84 | 13.68 | 13.09 | 0.60 | ||
| 314 | B8 | 1.05 | 1.05 | 1.05 | 11.28 | 11.39 | -0.10 | |
| 324 | A3 | 0.75 | 0.75 | 11.35 | 11.28 | 0.08 | ||
| 327 | F0 | 0.60 | 0.60 | 13.89 | 13.59 | 0.30 | ||
| 332 | B8 | 1.2 | 0.91 | 0.91 | 11.81 | 11.92 | -0.10 | |
| 340* | B5 | 1.3 | 0.66 | 0.66 | 11.36 | 11.46 | -0.10 | |
| 343* | A0 | 1 | 1.16 | 1.16 | 11.67 | 11.69 | -0.03 | |
| 349 | G5 | 0.78 | 0.78 | 13.81 | 13.21 | 0.60 | ||
| 356 | F5 | 0.56 | 0.56 | 14.59 | 14.15 | 0.44 | ||
| 361 | A6 | 0.62 | 0.62 | 13.01 | 12.83 | 0.18 | ||
| 362 | A0 | 1.3 | 0.75 | 0.75 | 12.79 | 12.82 | -0.02 | |
| 369 | F5 | 0.62 | 0.62 | 13.71 | 13.27 | 0.44 | ||
| 370 | 0.89 | 0.89 | 10.66 | 10.88 | -0.22 | |||
| 374 | A2 | 1.1 | 0.68 | 0.68 | 13.67 | 13.62 | 0.05 | |
| 375 | A2 | 1.4 | 0.82 | 0.82 | 12.79 | 12.77 | 0.03 | |
| 377 | B5 | 1.5 | 0.74 | 0.74 | 12.80 | 12.91 | -0.10 | |
| 386* | B5 | 1.4 | 1.03 | 1.03 | 11.10 | 11.21 | -0.10 | |
| 398 | B5 | 1.3 | 0.51 | 0.51 | 13.94 | 14.04 | -0.10 | |
| 403 | 0.87 | 0.87 | 10.49 | 10.65 | -0.15 | |||
| 405 | G5 | 0.50 | 0.50 | 14.09 | 13.49 | 0.60 | ||
| 406 | B5 | 1.3 | 0.71 | 0.65 | 0.71 | 10.75 | 10.92 | -0.17 |
| 414 | F6 | 0.59 | 0.59 | 12.72 | 12.26 | 0.46 | ||
| 420 | A9 | 2.1:: | 0.88 | 0.88 | 12.04 | 11.77 | 0.27 | |
| 423 | 0.66 | 0.66 | 8.62 | 8.86 | -0.24 | |||
| 431 | F3 | 0.71 | 0.71 | 12.75 | 12.40 | 0.35 | ||
| 437 | A2 | 1.1 | 0.74 | 0.74 | 13.19 | 13.15 | 0.05 | |
| 440 | B5 | 1.35 | 0.75 | 0.75 | 11.60 | 11.71 | -0.10 | |
| 444 | F8 | 0.53 | 0.53 | 13.28 | 12.77 | 0.52 | ||
| 446 | A0 | 0.87 | 0.87 | 11.60 | 11.65 | -0.05 | ||
| 447 | F5 | 0.57 | 0.57 | 13.78 | 13.34 | 0.44 | ||
| 448 | A0 | 0.66 | 0.66 | 13.90 | 13.92 | -0.02 | ||
| 449 | A1 | 0.95 | 0.69 | 0.69 | 13.16 | 13.15 | 0.01 | |
| 451 | A0 | 1.4 | 0.72 | 0.72 | 13.04 | 13.05 | 0.00 | |
| 476 | A3 | 1.1 | 0.73 | 0.73 | 12.65 | 12.58 | 0.08 | |
| 484 | A2 | 1.9 | 0.83 | 0.83 | 13.16 | 13.12 | 0.05 | |
| 489 | B5 | 1 | 0.91 | 0.83 | 0.91 | 10.92 | 11.11 | -0.19 |
| 496 | A8 | 0.61 | 0.61 | 12.81 | 12.54 | 0.27 | ||
| 504 | B6 | 1.1 | 0.81 | 0.71 | 0.81 | 11.23 | 11.44 | -0.21 |
| 509 | F7 | 0.65 | 0.65 | 13.38 | 12.91 | 0.48 | ||
| 514 | B5 | 1 | 0.99 | 0.87 | 0.99 | 10.60 | 10.82 | -0.22 |
| 517 | 1.06 | 1.06 | 9.26 | 9.45 | -0.19 | |||
| 519 | G5 | 0.53 | 0.53 | 13.29 | 12.70 | 0.60 | ||
| 520* | A1 | 1.2 | 0.96 | 0.96 | 11.90 | 11.89 | 0.01 | |
| 526 | A1 | 1.5 | 1.01 | 1.01 | 11.63 | 11.63 | 0.01 | |
| 527 | A4 | 0.94 | 0.94 | 11.92 | 11.80 | 0.13 | ||
| 538 | A0 | 1.4 | 0.95 | 0.95 | 12.05 | 12.08 | -0.02 | |
| 551 | 1.30 | 1.30 | 9.17 | 9.41 | -0.24 | |||
| 555 | G5 | 0.55 | 0.55 | 12.73 | 12.39 | 0.35 | ||
| 556 | B5 | 1.1 | 0.94 | 0.94 | 11.26 | 11.37 | -0.10 | |
| 559 | B5 | 1.3 | 0.94 | 0.94 | 11.07 | 11.18 | -0.10 | |
| 562 | F5 | 0.70 | 0.70 | 12.90 | 12.46 | 0.44 | ||
| 565 | B8 | 1.65 | 1.14 | 1.14 | 11.00 | 11.11 | -0.11 | |
| 566 | F2 | 0.79 | 0.79 | 11.79 | 11.44 | 0.35 | ||
| 577 | A0 | 1.1 | 0.87 | 0.87 | 12.60 | 12.62 | -0.02 | |
| 579 | A0 | 1.6 | 0.94 | 0.94 | 12.03 | 12.06 | -0.02 | |
| 582 | A9 | 0.89 | 0.89 | 11.79 | 11.51 | 0.28 | ||
| 590 | A0 | 1.15 | 0.69 | 0.69 | 13.19 | 13.21 | -0.02 | |
| 594 | A0 | 1.3 | 0.89 | 0.89 | 12.04 | 12.06 | -0.02 | |
| 595 | G5 | 0.62 | 0.62 | 13.93 | 13.33 | 0.60 | ||
| 597 | A5 | 1.4 | 0.65 | 0.65 | 12.67 | 12.53 | 0.15 | |
| 601 | B5 | 1.7 | 0.72 | 0.72 | 12.57 | 12.68 | -0.10 | |
| 605 | 0.87 | 0.87 | 9.44 | 9.69 | -0.25 | |||
| 642* | A8 | 0.61 | 0.61 | 12.75 | 12.48 | 0.27 | ||
| 652* | B5 | 1.3 | 0.94 | 0.94 | 11.49 | 11.60 | -0.10 | |
| 655 | A4 | 0.68 | 0.68 | 12.65 | 12.54 | 0.11 | ||
| 680 | G5 | 0.86 | 0.86 | 13.79 | 13.19 | 0.60 | ||
| 681 | B5 | 1.25 | 0.67 | 0.67 | 12.12 | 12.22 | -0.10 | |
| 682* | A3 | 0.81 | 0.81 | 12.20 | 12.12 | 0.08 | ||
| 690 | K0 | 0.55 | 0.55 | 12.97 | 12.28 | 0.70 | ||
| 718 | 0.82 | 0.82 | 9.56 | 9.72 | -0.16 | |||
| 719 | A0 | 1.25 | 0.82 | 0.82 | 12.90 | 12.93 | -0.02 | |
| 734 | 0.92 | 0.92 | 9.38 | 9.53 | -0.15 | |||
| 740* | A4 | 1.6 | 0.82 | 0.82 | 12.93 | 12.81 | 0.13 | |
| 750 | A0 | 1.3 | 0.92 | 0.92 | 12.08 | 12.11 | -0.02 | |
| 754 | A0 | 1.2 | 0.79 | 0.79 | 11.03 | 11.05 | -0.02 | |
| 759 | B5 | 1.4 | 1.12 | 1.12 | 11.08 | 11.19 | -0.10 | |
| 824 | 0.81 | 0.81 | 10.25 | 10.48 | -0.23 | |||
| 826* | A3 | 0.52 | 0.52 | 14.31 | 14.20 | 0.11 | ||
| 831 | 1.04 | 1.04 | 10.58 | 10.76 | -0.18 | |||
| 854 | F6 | 0.69 | 0.69 | 12.84 | 12.38 | 0.46 | ||
| 859 | 1.09 | 1.09 | 10.08 | 10.28 | -0.20 | |||
| 871 | G5 | 0.63 | 0.63 | 14.64 | 14.05 | 0.60 | ||
| 872 | 0.76 | 0.76 | 8.47 | 8.73 | -0.27 | |||
| 876 | B5 | 1 | 0.69 | 0.69 | 12.06 | 12.16 | -0.10 | |
| 877 | B5 | 1.6 | 1.06 | 1.06 | 11.19 | 11.29 | -0.10 | |
| 879 | G5 | 0.54 | 0.54 | 13.20 | 12.61 | 0.60 | ||
| 884 | 0.91 | 0.91 | 10.59 | 10.79 | -0.20 | |||
| 887 | 0.89 | 0.89 | 9.89 | 10.12 | -0.23 | |||
| 888 | 0.75 | 0.75 | 10.36 | 10.57 | -0.21 | |||
| 890 | A2 | 0.7: | 0.56 | 0.56 | 14.16 | 14.11 | 0.05 | |
| 891 | B5 | 1.3 | 1.09 | 1.03 | 1.09 | 10.38 | 10.54 | -0.17 |
| 896 | 1.3 | 0.87 | 0.87 | 11.08 | 11.26 | -0.18 | ||
| 898 | A1 | 0.8: | 0.65 | 0.65 | 11.96 | 11.96 | 0.01 | |
| 912* | B5 | 1 | 1.10 | 1.10 | 12.25 | 12.35 | -0.10 | |
| 913 | A0 | 0.8 | 0.58 | 0.58 | 14.34 | 14.36 | -0.02 | |
| 919 | A2 | 1.3 | 0.78 | 0.78 | 13.69 | 13.66 | 0.03 | |
| 921 | A5 | 0.79 | 0.79 | 13.50 | 13.35 | 0.15 | ||
| 924 | 0.86 | 0.86 | 9.67 | 9.91 | -0.24 | |||
| 927 | F2 | 0.58 | 0.58 | 12.69 | 12.34 | 0.35 | ||
| 928 | A0 | 1.2 | 0.84 | 0.84 | 11.34 | 11.40 | -0.05 | |
| 929 | F2 | 1:: | 0.77 | 0.77 | 13.62 | 13.27 | 0.35 | |
| 930 | 1.05 | 1.05 | 9.13 | 9.35 | -0.21 | |||
| 937 | A5 | 0.85 | 0.85 | 13.18 | 13.04 | 0.15 | ||
| 939 | 1.02 | 1.02 | 9.45 | 9.68 | -0.23 | |||
| 947 | 1.19 | 1.19 | 9.75 | 10.00 | -0.26 | |||
| 948 | F5 | 0.66 | 0.66 | 13.47 | 13.03 | 0.44 | ||
| 966 | A2 | 0.76 | 0.76 | 10.79 | 10.74 | 0.05 | ||
| 970 | A8 | 0.62 | 0.62 | 12.76 | 12.49 | 0.27 | ||
| 980 | 1.30 | 1.30 | 6.96 | 7.25 | -0.29 | |||
| 984 | 1.01 | 1.01 | 9.33 | 9.56 | -0.24 | |||
| 987 | B7 | 1.55 | 1.00 | 1.00 | 11.92 | 12.02 | -0.10 | |
| 991 | B8 | 1.2 | 0.88 | 0.88 | 11.33 | 11.43 | -0.10 |
| No. of stars | Reason for Rejection as Members |
|---|---|
| 40 | Reddening derived from spectral classification inconsistent with membership |
| 27 | ; even if we apply the maximum reddening correction, these stars are redder than the reddest likely members plotted in Figure 2 and with this maximum correction applied, they also fall above the track for 2 M☉ stars, which marks the upper boundary for IC 1805 members. |
| 51 | and ; for any assumed value of the reddening these stars populate a region of the HR diagram inconsistent with the age of IC 1805. These stars are probably field giants (e.g., Hillenbrand et al. 1993) |
| 16 | Positions in the , diagram, after correction for the mean reddening of IC 1805, are inconsistent with membership |
| 12 | too blue after correction for mean reddening |
| 5 | Reddening derived by -method 1.3 |
In summary, there are: 1) 229 members based on reddening values consistent with those observed for early-type members of the cluster; 2) 151 stars that are unlikely to be members based on either reddening or position in the HR diagram; and 3) 31 stars likely to be members because they have IR excesses. Of the 802 stars observed in the IRAC bands, we have no membership information for 391 of them. A method for estimating what fraction of these are actually members is discussed in §4.3.
3.2 Masses and Ages of Sample

Our data provide the basis for assessing the range of disk evolutionary states for intermediate and high mass stars in IC 1805. The first step is to estimate the masses of the 229 likely cluster members selected according to the above criteria. We placed these stars in an HR diagram by correcting their colors for the reddening listed in the sixth column of Table 3. The adopted reddening law is given in Table 5, normalized to an absorption, , of 1.0 mag at 2.2 m. This law is an average of the determinations by Rieke & Lebofsky (1985), Indebetouw et al. (2005), and Flaherty (2007). At IR wavelengths, the biggest difference in these various determinations is 0.1 mag at the 4.5 m Spitzer band. Also listed in Table 5 is the average reddening in IC 1805 estimated by Massey et al. (1995a) of , who found . We have used our adopted reddening law to derive the average reddening for the IR wavelengths, which we apply to those stars for which spectra, and thus individual reddening estimates, are unavailable (see below).
The color-magnitude diagram for the members of IC 1805 for which we have measurements of the individual reddening is shown in Figure 2. Thirty-two of these 229 members have infrared excesses (see §4) and are indicated in the Figure. Also shown are evolutionary tracks, isochrones, and the zero-age main sequence (ZAMS) from Siess, Dufour, & Forestini (2000) up to 7 M☉ and from Schaller et al. (1992) for more massive stars. For the masses included in the tabulation by Siess et al., we used their conversions to colors and magnitudes. For the more massive stars, we used the conversion from temperature to from Allen’s Astrophysical Quantities and the bolometric corrections from Massey et al. (2005). As the Figure indicates, the pre-main sequence stars in our sample have masses in the range 2-4 M☉. Stars more massive than 4 M☉ have already reached the main sequence.
| Filter | Reddening Law | IC 1805 Average Reddening |
|---|---|---|
| (0.36 m) | 13.67 | 4.13 |
| (0.44 m) | 11.82 | 3.57 |
| (0.55 m) | 8.93 | 2.70 |
| (1.24 m) | 2.45 | 0.74 |
| (1.65 m) | 1.55 | 0.47 |
| (2.17 m) | 1.00 | 0.3 |
| 3.6 m | 0.6 | 0.18 |
| 4.5 m | 0.49 | 0.15 |
| 5.8 m | 0.46 | 0.14 |
| 8 m | 0.46 | 0.14 |
| 24 m | 0.48 | 0.14 |
Massey et al. (1995a) estimated an age range of 1-3 Myr for the massive stars based on the fact that these stars still lie very close to the ZAMS. The isochrones plotted in Figure 2 suggest a somewhat larger age range of 0.5-5 Myr for the pre-main sequence 2-4 M☉ stars, with the 5 Myr limit set by the limiting magnitude of the survey. The use of position in the HR diagram to determine ages for pre-main-sequence intermediate mass stars is, however, highly problematic. For low mass stars, ages are estimated from a zero point called the “birthline.” The birthline is essentially the mass-radius relationship for pre-main sequence stars that have completed the main accretion phase and have begun their quasi-static contraction toward the main sequence. For stars in the 2-4 M☉ range studied here, the birthline is critically dependent on the accretion rate during the infall phase. Because accretion rates during this phase may vary widely, an ensemble of young stars in this mass range may initiate their quasi-static contraction from a variety of initial values of mass and radius rather than from a single well-defined birthline.
Empirically, the problem of determining ages for stars in this mass range is illustrated by the fact that the apparent ages of stars as determined from positions in the HR diagram appear to increase with increasing mass. For example, in the Orion cluster, the age of the 2 M☉ stars is about 5 times older than the age of 0.5 M☉ stars. Depending on the calibration chosen, the 2 M☉ stars appear to have an age of about 5 Myr old rather than the 1 Myr age estimated for the lower mass stars (Hillenbrand 1997). A similar effect is seen in W5, which is a region that closely resembles IC 1805 (Koenig & Allen 2010).
Given these uncertainties, we will assume that the age of our sample is similar to that of the massive stars – 1-3 Myr.
3.3 Cluster Properties
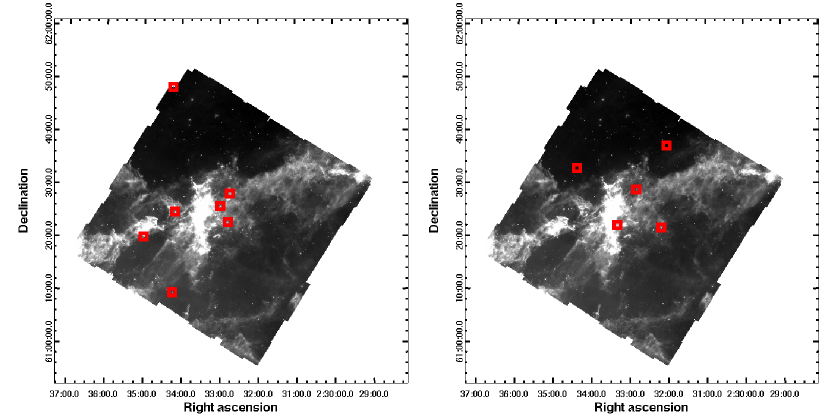
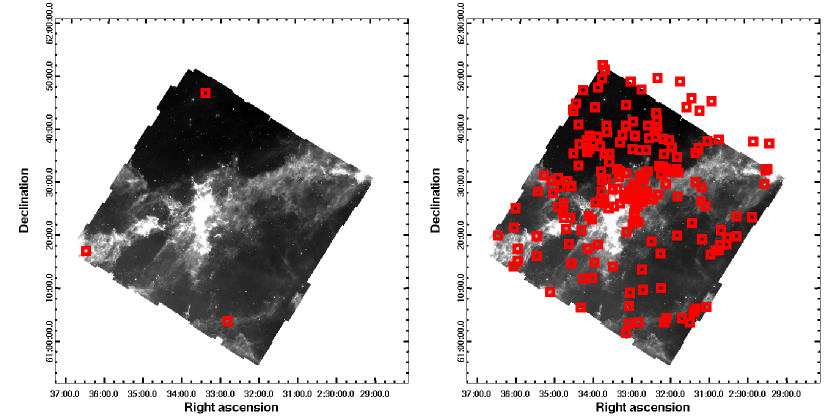

Figures 3-5 show the locations projected on the sky of the IC 1805 stars with IR excesses, broken down in the categories discussed in §4.2 below. Most of these stars lie along the region of bright 8-m interstellar dust emission stretching from southeast to northwest across the image, with a concentration of stars in the central region. There are also, however, stars with IR excesses that fall in regions where little dust emission is seen.
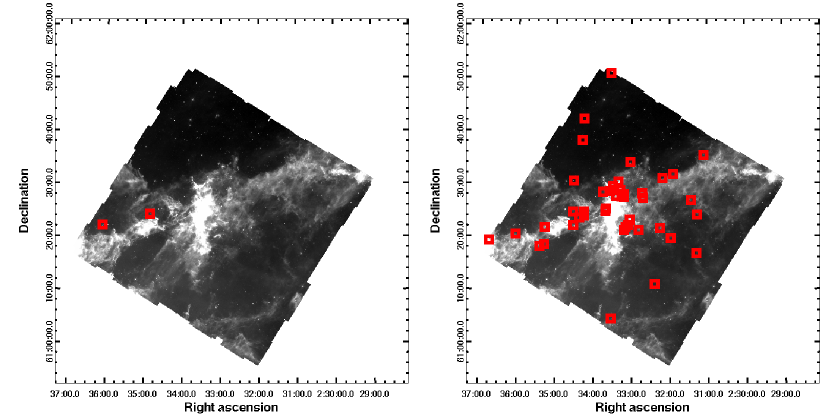
Figure 6 shows a similar plot for the members of IC 1805 listed in Table 3 and that do not have IR excesses. This plot shows that the massive stars (12 M☉) are more strongly concentrated than the lower mass stars. Indeed most of the massive stars are found in a region that is about 0.2 across or, at the 2350 pc distance of IC 1805 (Massey et al. 1995a), 4 pc in radius. The velocity dispersion of IC 1805 is not known, but if we adopt 5 km s-1 and a typical age of 2 Myr, then massive stars can move only 10 pc in that time. The whole region covered by this survey where recent star formation has taken place is about 0.8 across or 16 pc in radius. Since the massive stars could not have traversed this entire distance in their estimated lifetimes, it seems likely that the observed mass segregation was imposed at the time of their formation. The same conclusion was reached many years ago by Sagar et al. (1988) based on proper motion measurements of the stars in IC 1805. A recent study of another young region, W51, similarly finds evidence for a stronger concentration of YSOs with M☉ when compared with those with M☉ (Kang et al. 2009).
4 Infrared Excesses
4.1 Selection of Stars with Infrared Excesses
In order to identify stars with infrared excesses, we assumed that there is no excess emission above the photosphere at . We corrected the observations at each of the IR wavelengths for reddening (see Table 6) and then subtracted the magnitude relative to appropriate for the stellar photospheric temperature at the wavelengths longer than (see Table 7). For 32 of the stars that we found to have excesses, we have estimates of the reddening from either the method or spectral typing. There are an additional 31 stars with IR excesses but with indeterminate reddening because they are too cool for the method to be applicable and no spectra are available. We have assumed that these stars are members of IC 1805 by virtue of their IR excesses and for them have adopted the mean reddening of IC 1805 (i.e., A2.7). Fortunately, as Table 5 shows, the reddening in the infrared in IC 1805 is small, and the reddening is nearly independent of wavelength for the Spitzer bands. For the range of reddening observed for members of IC 1805 (), adoption of the mean reddening leads to a maximum error of 0.3 mag in the color and 0.1 mag for [3.6][24].
For photospheric flux densities, we adopted the black body models calculated by Koenig & Allen (2010) and the temperatures derived from the visible colors after applying individual reddening values for the stars for which measurements are available. For the stars for which we do not have a measurement of the reddening, we have applied the mean reddening values and assumed a temperature of = 9000. The likely range in temperatures of the stars with unknown reddening is 14000 K (the method is valid for all of the hotter stars) to 6000 K (the latest types observed are around G5). Given this range, the error in as a result of the difference between the actual stellar temperature and 9000 K is at most about 0.3 mag. The error in as a result of uncertainty in the temperature reaches a maximum of 0.4 mag for the coolest stars in our sample.
Given the combination of uncertainties in the measured flux densities, the reddening, and the intrinsic flux density of the photosphere, we have adopted the conservative criteria that the observed IR excess must be 0.5 mag at 8 m or 1.0 mag at 24 m in order for a star to be classified as having an IR excess.
The identification of stars with IR excesses is fairly insensitive to the corrections applied for reddening and for the photospheric flux density. In a preliminary reconnaissance of the data, we used plots of vs. [IRAC band] to identify stars that lay outside the the scatter attributable to photometric errors. The same stars were identified from both procedures, with the exception that the more conservative criterion adopted here, namely that the IR excess had to exceed 0.5 mag after correction, eliminated 6 stars (Nos. 1, 62, 99, 250, 888, and 891).
Table 6 lists the extinction-corrected colors in magnitudes relative to the band, after correction for interstellar reddening. Table 7 gives the magnitudes relative to after correction for both interstellar reddening and photospheric flux density. For the stars without an individual estimate of reddening, we applied the mean reddening given in Table 5 and assumed a temperature of 9000 K, as described; temperatures are in Table 7. For the other stars, those for which we have individual measurements of the reddening from spectroscopy or the method, we can obtain an estimate of the stellar temperature, and those temperatures are listed in Table 7.
| Star No. | Excess Type | ()0 | ()0 | ([3.6])0 | ([4.5])0 | ([5.8])0 | ([8])0 | ([24])0 | |
|---|---|---|---|---|---|---|---|---|---|
| (mag) | (mag) | (mag) | (mag) | (mag) | (mag) | (mag) | (mag) | ||
| 4 | Thin | 11.37 | -0.05 | -0.04 | 0.19 | 0.31 | 0.43 | 0.69 | 1.57 |
| 6 | Empty/Thin [8] | 11.76 | 0.03 | 0.04 | 0.04 | 0.05 | 0.32 | 0.81 | 5.88 |
| 13 | Empty/Thin [8] | 9.02 | -0.15 | -0.25 | -0.29 | -0.26 | -0.15 | 0.77 | 7.87 |
| 14 | Empty/Thin [8] | 11.94 | 0.24 | 0.21 | 0.17 | 0.14 | 0.26 | 0.88 | 6.07 |
| 15 | Empty/Thin [8] | 12.14 | -0.14 | -0.11 | -0.07 | 0.02 | 0.07 | 0.78 | 9.30 |
| 18 | Thick (AeBe) | 10.69 | 0.76 | 1.48 | 2.74 | 3.21 | 3.77 | 4.68 | 8.37 |
| 51 | Empty/Thin [8] | 12.23 | 0.18 | 0.13 | 0.09 | 0.04 | 0.18 | 0.88 | 5.80 |
| 61 | Empty/Thin [8] | 12.63 | 0.11 | 0.00 | -0.05 | -0.04 | 0.29 | 1.01 | 7.50 |
| 65 | Empty/Thin [5.8] | 12.31 | 0.07 | 0.12 | 0.32 | 0.45 | 0.82 | 1.79 | 6.69 |
| 66 | Empty/Thin [5.8] | 12.45 | 0.11 | 0.11 | 0.20 | 0.18 | 1.00 | 2.51 | 8.61 |
| 73 | Empty/Thin [8] | 12.34 | 0.20 | 0.28 | 0.31 | 0.24 | 0.62 | 1.44 | 7.87 |
| 80 | Empty/Thin [8] | 12.46 | 0.19 | 0.16 | 0.18 | 0.17 | 0.28 | 1.17 | 5.10 |
| 85 | Empty/Thin [8] | 12.35 | -0.05 | -0.05 | -0.02 | -0.04 | 0.19 | 0.92 | 6.52 |
| 86 | Empty/Thin [8] | 12.32 | 0.04 | 0.03 | 0.00 | 0.00 | 0.03 | 0.70 | 4.95 |
| 93 | Empty/Thin [8] | 11.92 | 0.06 | 0.09 | 0.08 | 0.05 | 0.33 | 1.06 | 5.40 |
| 98 | Empty/Thin [8] | 12.21 | 0.06 | -0.01 | 0.03 | 0.05 | 0.35 | 1.04 | 7.08 |
| 103 | Empty/Thin [8] | 12.64 | -0.01 | -0.06 | 0.01 | 0.01 | 0.37 | 1.41 | 7.51 |
| 107 | Thick (AeBe) | 10.95 | 0.30 | 0.83 | 2.05 | 2.57 | 2.94 | 3.49 | 5.19 |
| 122 | Thin | 11.43 | 0.47 | 0.82 | 1.61 | 1.88 | 2.17 | 3.22 | 3.99 |
| 128 | Thick (AeBe) | 11.27 | 0.30 | 0.68 | 1.69 | 2.18 | 2.60 | 3.35 | 6.19 |
| 137 | Thick (AeBe) | 11.49 | 0.26 | 0.74 | 2.07 | 2.74 | 3.53 | 5.00 | 7.58 |
| 139 | Empty/Thin [5.8] | 11.31 | 0.11 | 0.05 | 0.14 | 0.22 | 0.66 | 2.03 | 7.27 |
| 143 | Empty/Thin [8] | 12.19 | 0.22 | 0.29 | 0.40 | 0.53 | 0.64 | 1.45 | 7.73 |
| 144 | Empty/Thin [24] | 6.04 | -0.13 | -0.20 | -0.28 | -0.28 | -0.18 | 1.15 | |
| 180 | Empty/Thin [8] | 11.52 | -0.05 | -0.11 | -0.13 | -0.12 | 0.08 | 0.87 | 5.55 |
| 183 | Thin | 7.52 | 0.05 | 0.22 | 0.56 | 1.01 | 1.40 | 2.62 | |
| 184 | Empty/Thin [8] | 12.37 | 0.11 | 0.10 | 0.12 | 0.12 | 0.27 | 0.88 | 5.71 |
| 201 | Empty/Thin [8] | 13.13 | 0.21 | 0.22 | 0.34 | 0.31 | 0.57 | 0.97 | 4.99 |
| 244 | Empty/Thick [24] | 9.90 | -0.18 | -0.21 | -0.28 | -0.30 | -0.29 | -0.27 | 3.42 |
| 259 | Empty/Thin [8] | 12.94 | 0.13 | 0.14 | 0.12 | 0.07 | 0.25 | 0.77 | 6.66 |
| 261 | Empty/Thin [8] | 12.98 | 0.12 | 0.07 | 0.26 | 0.26 | 0.65 | 2.01 | 5.64 |
| 270 | Empty/Thin [8] | 13.16 | 0.13 | 0.08 | 0.10 | 0.07 | 0.47 | 1.42 | 5.20 |
| 271 | Thin | 11.82 | 0.30 | 0.61 | 1.18 | 1.52 | 1.86 | 2.36 | 0.57 |
| 272 | Empty/Thin [8] | 12.63 | 0.13 | 0.18 | 0.22 | 0.18 | 0.46 | 1.07 | 7.88 |
| 275 | Empty/Thin [8] | 12.42 | 0.06 | 0.03 | 0.05 | 0.09 | 0.29 | 0.88 | 6.94 |
| 279 | Empty/Thin [8] | 12.77 | 0.08 | 0.07 | 0.08 | 0.11 | 0.37 | 1.18 | 4.56 |
| 294 | Empty/Thin [8] | 13.10 | 0.03 | -0.04 | -0.05 | -0.10 | 0.11 | 1.05 | 5.13 |
| 334 | Empty/Thin [8] | 14.44 | -0.04 | 0.02 | 0.07 | 0.11 | 0.30 | 0.80 | 4.36 |
| 340 | Empty/Thin [8] | 11.53 | 0.00 | 0.01 | 0.09 | 0.14 | 0.20 | 0.58 | 3.30 |
| 343 | Thick (AeBe) | 12.46 | 0.38 | 1.01 | 2.50 | 4.57 | 8.17 | ||
| 386 | Empty/Thin [8] | 11.69 | -0.12 | -0.12 | -0.20 | -0.22 | -0.18 | 1.56 | 0.17 |
| 391 | Empty/Thick [24] | 12.80 | -0.10 | -0.12 | -0.14 | -0.17 | -0.15 | 0.04 | 5.87 |
| 461 | Thin | 12.59 | 0.18 | 0.29 | 0.69 | 1.02 | 1.26 | 1.82 | |
| 520 | Thick (AeBe) | 11.49 | 0.20 | 0.61 | 2.53 | 3.61 | 5.39 | ||
| 536 | Empty/Thin [8] | 12.14 | 0.20 | 0.17 | 0.13 | 0.81 | 9.26 | ||
| 563 | Empty/Thick [24] | 11.98 | -0.04 | -0.08 | -0.04 | 0.50 | 4.23 | ||
| 574 | Empty/Thin [8] | 12.08 | 0.20 | 0.14 | 0.11 | 0.10 | 0.12 | 0.90 | 3.60 |
| 599 | Empty/Thin [8] | 12.90 | 0.00 | 0.04 | 0.02 | 0.03 | 0.15 | 0.74 | |
| 642 | Empty/Thin [8] | 12.09 | 0.12 | 0.07 | 0.10 | 1.07 | 1.89 | ||
| 652 | Empty/Thick [24] | 11.56 | 0.02 | -0.01 | 0.09 | 0.41 | 5.02 | ||
| 682 | Thin/Thick | 11.81 | 0.19 | 0.43 | 1.77 | 2.36 | 3.11 | 4.58 | 7.09 |
| 721 | Empty/Thin [8] | 12.64 | 0.05 | 0.01 | 0.00 | 1.44 | 6.23 | ||
| 728 | Empty/Thin [8] | 12.89 | 0.09 | 0.04 | 0.10 | 0.74 | 5.52 | ||
| 729 | Empty/Thin [8] | 12.31 | 0.00 | -0.04 | -0.06 | -0.05 | 0.02 | 0.91 | 4.54 |
| 740 | Thick (AeBe) | 12.16 | 0.47 | 1.11 | 2.43 | 2.98 | 3.70 | 4.84 | 7.73 |
| 826 | Empty/Thin [8] | 13.10 | 0.14 | 0.23 | 0.33 | 1.27 | 4.94 | ||
| 856 | Empty/Thin [8] | 12.64 | 0.05 | 0.01 | 0.00 | 1.44 | 5.20 | ||
| 882 | Thin/Thick | 11.98 | 0.18 | 0.21 | 0.44 | 0.78 | 1.39 | 2.35 | 5.16 |
| 901 | Empty/Thin [8] | 12.82 | 0.08 | 0.04 | 0.06 | 0.11 | 0.31 | 0.86 | 4.08 |
| 902 | Empty/Thin [8] | 12.74 | 0.16 | 0.11 | 0.05 | -0.08 | 0.40 | 1.36 | 5.00 |
| 912 | Empty/Thin [8] | 12.93 | -0.02 | -0.09 | -0.07 | -0.10 | 0.34 | 1.48 | 4.23 |
| 917 | Empty/Thin [8] | 13.11 | 0.00 | -0.04 | 0.02 | 0.02 | 0.31 | 1.16 | 7.35 |
| 923 | Empty/Thin [8] | 12.71 | 0.40 | 0.40 | 0.42 | 0.35 | 0.62 | 1.28 | 5.79 |
| (1) | (2) | (3) | (4) | (5) | (6) | (7) | (8) | (9) | (10) |
|---|---|---|---|---|---|---|---|---|---|
| opt. num. | Excess Type | ||||||||
| (K) | (mag) | (mag) | (mag) | (mag) | (mag) | (mag) | (mag) | ||
| 4 | Thin | 11200 | -0.04 | -0.06 | 0.16 | 0.26 | 0.38 | 0.65 | 1.52 |
| 6 | Empty/Thin [8] | 11200 | 0.04 | 0.02 | 0 | -0.01 | 0.27 | 0.76 | 5.83 |
| 13 | Empty/Thin [8] | 25450 | -0.05 | -0.1 | -0.08 | -0.05 | 0.09 | 1.03 | 8.15 |
| 14 | Empty/Thin [8] | 9000 | 0.21 | 0.12 | 0.03 | -0.03 | 0.08 | 0.69 | 5.85 |
| 15 | Empty/Thin [8] | 11200 | -0.13 | -0.13 | -0.1 | -0.03 | 0.02 | 0.74 | 9.24 |
| 18 | Thick (AeBe) | 15200 | 0.78 | 1.49 | -1.05 | 3.21 | 3.76 | 4.7 | 8.40 |
| 51 | Empty/Thin [8] | 9000 | 0.15 | 0.04 | -0.05 | -0.13 | 0 | 0.69 | 5.58 |
| 61 | Empty/Thin [8] | 9000 | 0.08 | -0.09 | -0.19 | -0.21 | 0.11 | 0.82 | 7.28 |
| 65 | Empty/Thin [5.8] | 8180 | 0.01 | -0.01 | 0.12 | 0.21 | 0.56 | 1.52 | 6.40 |
| 66 | Empty/Thin [5.8] | 9000 | 0.08 | 0.02 | 0.06 | 0.01 | 0.82 | 2.32 | 8.39 |
| 73 | Empty/Thin [8] | 9000 | 0.17 | 0.19 | 0.17 | 0.07 | 0.44 | 1.25 | 7.65 |
| 80 | Empty/Thin [8] | 9000 | 0.16 | 0.07 | 0.04 | 0 | 0.1 | 0.98 | 4.88 |
| 85 | Empty/Thin [8] | 11200 | -0.04 | -0.06 | -0.05 | -0.09 | 0.14 | 0.87 | 6.46 |
| 86 | Empty/Thin [8] | 9790 | 0.02 | -0.03 | -0.09 | -0.12 | -0.1 | 0.57 | 4.80 |
| 93 | Empty/Thin [8] | 8340 | 0 | -0.04 | -0.11 | -0.18 | 0.09 | 0.81 | 5.12 |
| 98 | Empty/Thin [8] | 9000 | 0.03 | -0.1 | -0.11 | -0.12 | 0.17 | 0.85 | 6.86 |
| 103 | Empty/Thin [8] | 9000 | -0.04 | -0.15 | -0.13 | -0.16 | 0.19 | 1.22 | 7.29 |
| 107 | Thick (AeBe) | 9000 | 0.26 | 0.74 | 1.9 | 2.4 | 2.76 | 3.3 | 4.97 |
| 122 | Thin | 9000 | 0.44 | 0.73 | 1.47 | 1.71 | 1.99 | 3.03 | 3.77 |
| 128 | Thick (AeBe) | 8180 | 0.24 | 0.55 | 1.49 | 1.94 | 2.34 | 3.08 | 5.89 |
| 137 | Thick (AeBe) | 8920 | 0.22 | 0.64 | 1.93 | 2.56 | 3.35 | 4.81 | 7.36 |
| 139 | Empty/Thin [5.8] | 16800 | 0.18 | 0.14 | 0.26 | 0.33 | 0.79 | 2.16 | 7.42 |
| 143 | Empty/Thin [8] | 6800 | 0.11 | 0.07 | 0.06 | 0.14 | 0.22 | 1.01 | 7.24 |
| 144 | Empthy/Thin [24] | 30000 | -0.01 | -0.03 | -0.03 | -0.01 | 0.12 | 1.47 | |
| 180 | Empty/Thin [8] | 11200 | -0.04 | -0.12 | -0.16 | -0.17 | 0.03 | 0.82 | 5.49 |
| 183 | Thin | 34000 | 0.18 | 0.39 | 0.82 | 1.29 | 1.7 | 2.96 | |
| 184 | Empty/Thin [8] | 11200 | 0.12 | 0.09 | 0.09 | 0.07 | 0.22 | 0.83 | 5.65 |
| 201 | Empty/Thin [8] | 9560 | 0.19 | 0.16 | 0.23 | 0.17 | 0.43 | 0.83 | 4.82 |
| 244 | Empty/Thick [24] | 20100 | -0.09 | -0.1 | -0.12 | -0.14 | -0.11 | -0.07 | 3.63 |
| 259 | Empty/Thin [8] | 9000 | 0.1 | 0.05 | -0.02 | -0.1 | 0.07 | 0.58 | 6.44 |
| 261 | Empty/Thin [8] | 9000 | 0.09 | -0.02 | 0.12 | 0.09 | 0.47 | 1.82 | 5.42 |
| 270 | Empty/Thin [8] | 9000 | 0.1 | -0.01 | -0.04 | -0.1 | 0.29 | 1.23 | 4.98 |
| 271 | Thin | 6350 | 0.16 | 0.34 | 0.78 | 1.06 | 1.37 | 1.85 | 0.00 |
| 272 | Empty/Thin [8] | 6650 | 0.01 | -0.06 | -0.14 | -0.23 | 0.02 | 0.61 | 7.37 |
| 275 | Empty/Thin [8] | 9000 | 0.03 | -0.06 | -0.09 | -0.08 | 0.11 | 0.69 | 6.72 |
| 279 | Empty/Thin [8] | 9000 | 0.05 | -0.02 | -0.06 | -0.06 | 0.19 | 0.99 | 4.34 |
| 294 | Empty/Thin [8] | 9000 | 0 | -0.13 | -0.19 | -0.27 | -0.07 | 0.86 | 4.91 |
| 334 | Empty/Thin [8] | 9000 | -0.07 | -0.07 | -0.07 | -0.06 | 0.12 | 0.61 | 4.14 |
| 340 | Empty/Thin [8] | 11200 | 0.01 | -0.01 | 0.05 | 0.09 | 0.15 | 0.54 | 3.24 |
| 343 | Thick (AeBe) | 9790 | 0.36 | 0.96 | 2.38 | 4.44 | 8.02 | ||
| 386 | Empty/Thin [8] | 11200 | -0.11 | -0.13 | -0.23 | -0.27 | -0.23 | 1.51 | 0.11 |
| 391 | Empty/Thick [24] | 9000 | -0.13 | -0.21 | -0.28 | -0.34 | -0.33 | -0.15 | 5.65 |
| 461 | Thin | 9000 | 0.15 | 0.2 | 0.55 | 0.85 | 1.08 | 1.63 | |
| 520 | Thick (AeBe) | 9450 | 0.18 | 0.55 | 2.38 | 3.45 | 5.22 | ||
| 536 | Empty/Thin [8] | 9000 | 0.17 | 0.08 | -0.04 | 0.62 | 9.04 | ||
| 563 | Empty/Thick [24] | 9000 | -0.07 | -0.17 | -0.21 | 0.31 | 4.01 | ||
| 574 | Empty/Thin [8] | 9000 | 0.17 | 0.05 | -0.03 | -0.07 | -0.06 | 0.71 | 3.38 |
| 599 | Empty/Thin [8] | 9000 | -0.03 | -0.05 | -0.12 | -0.14 | -0.03 | 0.55 | |
| 642 | Empty/Thin [8] | 7500 | 0.04 | -0.1 | -0.21 | 0.73 | 1.51 | ||
| 652 | Empthy/Thick [24] | 11200 | 0.03 | -0.02 | 0.04 | 0.36 | 4.96 | ||
| 682 | Thin/Thick | 8750 | 0.15 | 0.33 | 1.61 | 2.16 | 2.91 | 4.37 | 6.85 |
| 721 | Empty/Thin [8] | 9000 | 0.02 | -0.08 | -0.17 | 1.25 | 6.01 | ||
| 728 | Empty/Thin [8] | 9000 | 0.06 | -0.05 | -0.07 | 0.55 | 5.30 | ||
| 729 | Empty/Thin [8] | 9000 | -0.03 | -0.13 | -0.2 | -0.22 | -0.16 | 0.72 | 4.32 |
| 740 | Thick (AeBe) | 8340 | 0.41 | 0.98 | 2.24 | 2.76 | 3.46 | 4.6 | 7.45 |
| 826 | Empty/Thin [8] | 8510 | 0.09 | 0.11 | 0.11 | 1.04 | 4.68 | ||
| 856 | Empty/Thin [8] | 9000 | 0.02 | -0.08 | -0.17 | 1.25 | 4.98 | ||
| 882 | Thin/Thick | 9000 | 0.15 | 0.12 | 0.3 | 0.61 | 1.21 | 2.16 | 4.94 |
| 901 | Empty/Thin [8] | 9000 | 0.05 | -0.05 | -0.08 | -0.06 | 0.13 | 0.67 | 3.86 |
| 902 | Empty/Thin [8] | 9000 | 0.13 | 0.02 | -0.09 | -0.25 | 0.22 | 1.17 | 4.78 |
| 912 | Empty/Thin [8] | 11200 | -0.01 | -0.1 | -0.1 | -0.15 | 0.29 | 1.43 | 4.17 |
| 917 | Empty/Thin [8] | 9000 | -0.03 | -0.13 | -0.12 | -0.15 | 0.13 | 0.97 | 7.13 |
| 923 | Empty/Thin [8] | 9000 | 0.37 | 0.31 | 0.28 | 0.18 | 0.44 | 1.09 | 5.57 |

4.2 Classification of Spectral Energy Distributions
After examination of the SEDs of the stars in IC 1805 with excesses above the photosphere, we find that the SED morphologies can be sorted into five categories. The categories are described below and listed in Column 2 of Tables 6 and 7. The magnitudes of the IR excess relative to for typical examples of four of the categories are plotted in Figure 7. The stars with optically thin excess emission are discussed in more detail in Section 5 and their SEDs are shown in Figure 10. SEDs for all of the stars with IR excesses are shown in Figure 11 in the Appendix.
We first list the categories, and then describe them in subsections. The categories are :
-
•
Disks with excess emission at and all longer wavelengths consistent with that expected for optically thick disks (“optically thick”). These could also be described as Herbig AeBe stars.
-
•
Disks with optically thin excess emission at and at all longer wavelengths for which a detection was made (“optically thin”).
-
•
Disks with optically thin emission at the shorter IR wavelengths and optically thick emission at longer wavelengths (“thin/thick”).
-
•
Stars for which optically thin excess emission first appears in either the IRAC bands, usually only at 8 m, or at 24 m (“empty/thin”).
-
•
Disks with optically thick emission at 24 m but flux densities consistent with photospheric emission only in and the IRAC bands (“empty/thick”).
For the last two categories, the Spitzer wavelength at which the excess emission is first detected is listed in brackets in the second column of Tables 6 and 7.

4.2.1 Optically Thick (AeBe Stars)
The category of “optically thick” is defined as disks with excess emission at and all longer wavelengths consistent with that expected for optically thick disks. In a recent study, Hernandez et al. (2005) defined the region in the reddening-corrected vs. diagram occupied by Herbig AeBe stars. Figure 8 shows this region along with the reddening-corrected colors of the stars in our current sample. Nine stars lie inside or very near the boundary of the region defined by Hernandez et al. (2005) and based on their colors alone would be classified as AeBe stars. Near-infrared colors do not tell the whole story, however. Stars 271 and 122, which lie very near the AeBe boundary and which would probably be called AeBe stars based on photometry, have smaller excesses in the IRAC bands (see Figure 9 below) than more typical AeBe stars. We have classified both as optically thin based on the longer wavelength data, thereby leaving only seven optically thick (AeBe) stars. These stars are labeled “Thick (AeBe)” in column 2 of Tables 6 and 7.
It is generally assumed, based on extensive studies of lower mass PMS stars that exhibit similar IR excesses, that objects with SEDs consistent with emission from an optically thick disk are also accreting (e.g., Lada et al. 2006). To date, there has not been a search for evidence of accretion signatures among a large sample of intermediate mass stars selected to have optically thick disks based solely on their observed IR SEDs. However, in subsequent discussion, we make the assumption that, by analogy with their lower mass counterparts, intermediate mass objects with optically thick disks are likely still accreting material through their circumstellar disks.
4.2.2 Optically Thin
This “optically thin” category is defined as disks with optically thin excess emission at and at all longer wavelengths for which a detection was made. This group is far from homogeneous. Two stars (122 and 271) have excess nearly as large as the optically thick (AeBe) stars but lower excesses at longer wavelengths. Surprisingly, the upper limit on the excess at 24 m for No. 271 is 0 mag. One star in this category, No. 461, may be blended with No. 292. Another star, No. 183, was classified as a classical Be star by Massey et al. (1995a). Classical Be (CBe) stars are losing mass, and their IR excesses are produced by free-free emission arising in a circumstellar decretion disk. CBe stars occupy a region in the two-color plot near the origin; 90% have excesses in both and that are 0.3 mag. (Dougherty, Taylor, & Clark 1991; Dougherty et al. 1994). All five of these stars are labeled “Thin” in column 2 of Tables 6 and 7, and their SEDs are shown in Figure 11.
4.2.3 Thin/Thick
This category (“Thin/Thick”) is defined as disks with optically thin emission at the shorter IR wavelengths and optically thick emission at longer wavelengths. This category includes only 2 stars, Nos. 682 and 882. Star 682 has smaller excesses at and than is typical of optically thick (AeBe) stars, but the excess in the IRAC bands and at 24 m is similar to that of optically thick (AeBe) stars. Star No. 882 has less excess emission than typical AeBe stars out through the IRAC bands but optically thick emission at 24 m. These stars are labeled Thin/Thick in Column 2 of Tables 6 and 7.
4.2.4 Empty/Thin
This “Empty/Thin” category includes stars for which optically thin excess emission first appears in either the IRAC bands, usually only at 8 m, or in one case only (No. 144) at 24 m. The wavelength at which the excess first appears is listed in Column 2 of Tables 6 and 7 (“Empty/Thin [5.8]”, [8], or [24]). These are disks whose inner regions are devoid of small dust grains and/or emitting gas within the limits of our ability to assess excess emission exceeding the uncertainties in our photometry and/or our knowledge of reddening.
Three of these stars, Nos. 65, 66, and 139, first exhibit excess emission at [5.8], and the excess is larger at [8], suggesting that we are indeed seeing emission from a disk in which the inner region as been cleared of small dust grains.
For the remaining 42 stars in this category, the abrupt SED rise between 5.8 m and 8 m is too large to be explained easily by a continuous energy distribution such as those seen in either the stars with optically thin emission or in the optically thick (AeBe) stars. The lack of a short wavelength “Wien tail” to the SED of the excess emission observed at 8 m suggests that the excess at 8 m may be caused by polycyclic aromatic hydrocarbon (PAH) emission rather than thermal emission from interstellar-like dust grains. Indeed, these stars occupy a position in a plot of [3.6][5.8] vs. [4.5][8] similar to that of PAH-rich galaxies (see Figure 9). (See, e.g., Hernandez et al. 2007 for a comparison of colors of galaxies and pre-main sequence stars.) The IC 1805 objects, however, have stellar PSFs and to our limiting magnitude we expect negligible contamination from galaxies (Fazio et al. 2004b). Moreover, we have spectral types for 16 of these objects and can thus confirm that the excess emission arises from optically-identified members of the IC 1805 complex.
The question then is whether the emission is an artifact of the data reduction process or, if real, whether it arises arises from PAH background emission or from the stellar disk. In order to address this question, we conducted several different tests.
First, we manually investigated the images of each object, particularly those at 8 m. Some of the objects with excesses only at [8] are located in regions where there is no bright 8 m ISM emission.
Next, we tried different reduction procedures. The IRAC photometry extraction described above in §2 used an aperture of 3 px and a sky annulus of 3 to 7 px. We also performed the 8 m photometry using different settings (e.g., 2 px and 2 to 6 px, with the associated aperture correction), and the same measurement was obtained to within 0.3 mag (usually well within that) and below the 0.5 mag limit we set above for identifying an 8 m excess.
If the flux density measured using the same aperture/annulus at a nearby location was comparable to the measured target flux density, then the measurement might well be spurious. We took our 3 px aperture/3-7 px annulus measurements and performed the same photometry offset by 8 px in the direction in the 8 m images, which is close to but not exactly a shift in RA. This offset was performed blindly, e.g., no effort was made to ensure that there were no adjacent sources at that location. For the overwhelming majority of our sources in general and all but 4 of the sources identified as 8 m excess sources, this offset flux density was more than 0.3 mag fainter, often significantly (more than 3 mag) fainter than the flux density measured for the nearby 8 m source.
If the flux density measured in the sky annulus were to exceed that measured in the target aperture, then the derived 8 m flux density could well be spurious. For the overwhelming majority of our sources in general and all but 1 of the sources identified as 8 m excess sources, the object flux density significantly exceeds that measured in the sky annulus.
Finally, we looked at the distribution of sky annulus flux density values to see if the objects identified as 8 m excess objects fell only in regions where this value is the highest. The 8 m excess objects are not preferentially located in regions where the measured sky annulus flux density is highest. There are even a significant number of objects with no 8 m excess and with significantly higher sky annulus flux densities than the highest found in the 8 m excess sample.
We conclude that the 8 m excesses are real, likely arise from PAH emission, and are most probably associated with a circumstellar disk. Diagnosing the properties of such putative disks would require measurements at 24 m. Unfortunately, all but four of the stars in this category have upper limits for [24] that are larger than 4 mag, and so the disks could be either optically thick or optically thin (see, e.g., Hernandez et al. 2007 for a sample of [24] magnitudes for pre-main sequence stars). One of the stars, Nos. 386, has an upper limit for [24] of 0.11, which is consistent with no excess. Nos. 574 and 642 have upper limits for [24] of 3.38 and 1.51, respectively, and No. 340 has a measured value of 3.24. All three are consistent with excesses measured for debris disks; for comparison, [24] for Pic, which has one of the largest 24 m excesses known, is 3.5 (Rebull et al. 2008).
4.2.5 Empty/Thick
This last category consists of disks with optically thick emission at 24 m but flux densities consistent with just photospheric emission in and the IRAC bands. The four stars in this category are designated as “Empty/Thick” in Column 2 of Tables 6 and 7. Owing to the high and variable upper limits to 24 m flux densities listed in Table 1, the number of stars in this category is almost certainly a lower limit to the true frequency of such objects.
4.2.6 Discussion of categories

As Figure 8 shows, most of the stars in this sample with IR excesses would not be identified with photometry alone. Two of the stars just outside the boundary of the AeBe star region (Nos. 271 and 122) would probably be classified as AeBe stars based on their near infrared photometry alone. These stars, however, have lower excesses in the IRAC bands than the optically thick (AeBe) stars. This is illustrated in Figure 9, which shows a plot of vs. . In this plot, the colors have been corrected for reddening but the photospheric flux density has not been subtracted. The optically thick (AeBe) stars are well separated from the other categories by virtue of their large excesses at shorter wavelengths. This diagram also shows the large number of stars for which we measure excesses of 0.5-1.75 mag in but no excesses at shorter wavelengths (empty/thin stars). This region is also well-populated in the same color-color plot for W5 (see Koenig & Allen 2010).
The current sample was optically selected, and one might be concerned that the stars with disks are on average more reddened (embedded) than those without, and that the effective magnitude limit of the IR excess stars is brighter than for the no-excess stars. The averaged extinction in is, however, similar for the two groups: =2.50 for the cluster members with excesses and 2.67 for the cluster members with no IR excess. This sample should, therefore, allow us to compare directly stars that are in various stages of disk evolution subsequent to the deeply embedded phase.
4.3 Percentage of disks around B and A type stars
With these data, we can estimate what percentage of stars more massive than 2 M☉ and less than 3 Myr old have disks. Obviously, we know the fraction of stars with IR excesses among the confirmed members. However, membership for the cooler stars was based largely on spectral classification, and stars with IR excesses are probably over-represented in the spectroscopic sample; when we constructed the list of stars to be observed spectroscopically, we had already partially reduced the Spitzer data and had identified the stars with the largest IR excesses, which were then given high priority for spectroscopy. For example, all of the stars subsequently classified as AeBe stars were included in the spectroscopic sample.
By contrast, the stars without IR excesses chosen for spectroscopy were selected at random from stars observed by Massey et al. (1995a). In order to estimate the true fraction of stars that show IR excesses, we have used the percentage of cluster members with no IR excess found among our spectroscopic sample to estimate the percentage of likely cluster members among the stars for which we only have photometry. To do so, we divided the stars with spectroscopy and no IR excess into bins according to observed magnitude and counted the fraction of stars in each bin that were determined to be members based on spectral classification. We then similarly divided the sample of stars with photometry and no membership information into magnitude bins and applied the correction factors derived from the spectroscopic sample to estimate the likely number of members. On average, 75% of the no-excess stars with spectra proved to be members, with some evidence for increasing contamination by non-members at fainter magnitudes. Applying the correction factors to each magnitude bin for the stars without spectra, we find that 288 of the 391 stars without spectra are likely to be members.
Table 8 summarizes the membership of IC 1805 including the basis for deciding membership. The first three rows in this Table include the stars determined to be members based on their reddening (i.e., the stars in Table 3). The fourth row includes all of the additional stars with IR excesses, and we have assumed that all stars with IR excesses are members. If we then include the likely 288 additional stars, the total number of cluster members in our sample is estimated to be 548, of which 63 or only 11.5% have IR excesses.
| No. of stars | Membership Status |
|---|---|
| 81 | Stars with no excess IR emission but reddening derived by Q-method consistent with cluster reddening |
| 116 | Stars with no excess IR emission but reddening derived from spectral classification consistent with cluster reddening |
| 32 | Stars with IR excesses and reddening derived from either the Q-method or spectral classification consistent with cluster reddening |
| 31 | Stars assumed to be members because of their IR excesses |
| 288 | Stars with no IR excess and no information about reddening but on a statistical basis likely to be members as determined from the ratio of members/non-members in the spectroscopic sample |
| 548 | Total number members (63 have IR excesses) |
The numbers of disks of each type are listed in Table 9. The last column of the Table gives the percentage of IC 1805 members that have disk emission in each of the five categories. Only about 1.3% of the total sample have optically thick disks, i.e., are of the Herbig AeBe type. All of the stars with optically thick disks have masses between 2 and 4 M☉, and the fraction of optically thick disks in this more restricted mass range is still only 1.6%. This should be compared with low mass stars, about half of which retain their optically thick disks (i.e., remain classical T Tauri stars) at an age of about 3 Myr (Haisch et al. 2001).
Although all the same types of SEDs are seen among lower mass stars (e.g., Lada et al. 2006; Muzerolle et al. 2006), the proportions are quite different. Specifically, the majority (9%) of the stars with excesses among our sample of intermediate mass stars have excesses only at wavelengths longer than 5 m. A similar result is found for intermediate mass stars in W5 (Koenig & Allen 2010) and NGC 6611 (Rebull, Wolff, & Strom, unpublished). SEDs of this type are rare among stars with masses less than that of the Sun. It is important to note, when comparing SEDs of intermediate- and low-mass stars, that the excesses at specific wavelengths probe emission arising from very different disk radii.
| Type of SED | Possible interpretation | No. of stars | Fraction of cluster members |
|---|---|---|---|
| Optically Thick (AeBe) | Likely Accretion Disk | 7 | 1.3% |
| Optically Thin (thin throughout near IR and at 24 m if detected) | Either gas emission or homologously depleted disks | 5 | 0.9% |
| Thin/Thick (Near IR thin/24 m thick) | Possible EGP Formation | 2 | 0.4% |
| Empty/Thin (No excess in ; optically thin emission first appears at ) | Emission from second generation dust | 45 | 8.2% |
| Empty/Thick (Optically thick emission at 24 m; no excess at shorter wavelengths) | Photoevaporation or companion formation | 4 | 0.7% |
Another difference between the current intermediate mass sample and disks around stars with masses similar to or lower than that of the Sun is the large number of disks that are apparently in an evolutionary state more advanced than the initial, optically thick accretion phase. Of the stars with disks, only 11% are optically thick while 89% appear to have SEDs indicative of a later phase of evolution. This contrasts strongly with lower mass stars (Lada et al. 2006; Muzerolle et al. 2010).
5 Discussion
5.1 Factors Determining Disk Properties
The data presented in Tables 6 and 7 provide a starting point for discussing the evolution of disks among intermediate mass stars. To understand the different types of SEDs observed, we need to consider both the likely range of disk initial conditions and the factors that affect the evolution of accretion disks.
(a) Disk initial conditions. There is a paucity of information available regarding the initial properties (M and ) among intermediate-mass stars. Hence, we must use the extensive data available for the low-mass stars as a guide. Andrews & Williams (2007) provide a summary of the frequency distribution of disk masses among the young ( 2 Myr) populations in two nearby star-forming regions: Taurus and Ophiuchus. Their results, based on sub-millimeter and millimeter-continuum estimates of disk masses, show a wide range ( 2 dex) of masses. To provide some representative numbers, Andrews & Williams (2007) find that 50% of optically thick disks surrounding stars with masses in the range 0.2 to 1 M☉ have 0.01 M☉, while only about 10% of their samples contain 0.05 M☉. Andrews & Williams (2005, 2007) also find that the upper envelope of the relationship between and the mass of the central star () scales linearly with (higher disk mass for higher mass stars). It is noteworthy that the range in disk accretion rates (e.g., Muzerolle et al. 2003) also spans a range exceeding 2 dex. For an accretion disk modelled as an “alpha disk,” , where is the disk surface density, . For disks with homologous surface density-radius distributions, . Were these simple assumptions applicable, much of the observed range in disk accretion rate could be attributed to the observed range of disk masses. Of course, nature is likely to be more complex, and at least some of the variation in could arise from differences in the radial distribution of disk surface density as well as disk viscosity.
(b) Disk Evolution. Three factors drive disk evolution: (i) draining and spreading of an accretion disk as a result of angular momentum evolution (e.g., Calvet, Hartmann, & Strom 2000); (ii) photoevaporation of the disk driven by a combination of X-ray, far-ultraviolet, and extreme ultraviolet radiation acting on a draining and spreading disk (see Gorti, Dullemond, & Hollenbach 2009 for a current discussion and review of previous work); and (iii) grain settling, grain growth, and the formation of planetesimals and planets, which can alter the dust/gas ratio, the dust opacity, and the distribution of gas and dust via formation of tidal gaps. The timescale to deplete the initial disk mass by a factor of 100 via draining and (consequent spreading) is yr (e.g., Calvet, Hartmann, & Strom 2000). Based on the Gorti et al. (2009) assumptions, the time for photoevaporation to remove gas and dust from a circumstellar disk with initial mass of 0.1 M☉ surrounding a star of mass 2 M☉ is 4 Myr; for stars with mass M☉, the comparable timescales drop rapidly with increasing mass (to 0.5 Myr for a 7 M☉ star). The effects of planet formation on the lifetime of accretion disks with initial high masses and rates of disk destruction are not well constrained at present.
This brief summary of the range of disk initial conditions and the factors that together affect disk evolution provides a framework for discussing the observed evolution of disk properties of intermediate mass stars at least in a rudimentary way. In the following subsections, we provide a summary of plausible physical explanations for each of the observed SED classes and suggest additional measurements that in principle should provide the basis for choosing among these explanations.
5.2 SEDs consistent with optically thick accretion disks
As we argue in the previous section, our data show that at ages of 1-3 Myr, only 2% of stars with M are still surrounded by optically thick accretion disks. No evidence of optically thick emission is found for stars 4 M☉. Studies (Haisch et al. 2001; Lada et al. 2006) of disk properties for solar like stars ( M☉) show that at 2 Myr, a much larger fraction of such lower mass objects (30-60%) exhibit evidence for optically thick disks. (Such disks are sometimes categorized as “primordial disks,” despite the fact that although still accreting and optically thick, the mass and structure of such accretion disks must have changed significantly since the star-disk system ceased to be fed by infalling material from its natal protostellar core. We suggest that this nomenclature be re-examined [e.g., Evans et al. 2009]). By comparison, the fraction of solar-like stars surrounded by accretion disks does not drop to values as small as 6% until ages 5-7 Myr (Dahm & Hillenbrand 2007; Haisch et al. 2001). Our results are qualitatively consistent with the trend reported by Dahm & Hillenbrand (2007), who find no evidence for optically thick accretion disks for stars with 1.2 M☉ in IC 2362 ( 5 Myr) and with earlier results reported by Hillenbrand et al. (1993), who conclude that no stars with 5 M☉ in the young cluster NGC 6611 show evidence of optically thick accretion disks at 1-2 Myr.
We propose that a combination of photoevaporative erosion of disks combined with differences in initial disk masses can explain the absence of optically thick accretion disks among stars with 4 M☉, and also the small fraction of stars showing evidence of optically thick disks among stars with 2 M☉. As noted above, Gorti, Dullemond, & Hollenbach (2009) estimate the timescale for photoevaporation to erode a “typical” disk () surrounding intermediate mass stars spanning a range of masses. For a star having 2 M☉, they estimate a disk lifetime of 4 Myr presuming that photoevaporation is the primary cause for disk dissipation; for 7 M☉, they estimate a disk lifetime 0.5 Myr. Their results suggest that the rapid increase in photoevaporation rate with increasing mass (a result of the dramatic rise in extreme-ultraviolet (EUV) luminosity as a function of mass along the main sequence) provides a natural explanation for the paucity of optically thick disks found among stars with 4 M☉ in a cluster whose members span ages 1-3 Myr.
The small fraction of optically thick disks (2%) found to surround stars of 2 M☉ may reflect the fact that the median disk mass around intermediate mass stars may be 0.01 rather than 0.05 (as assumed by Gorti, Dullemond, & Hollenbach 2009), if these objects have a distribution of similar to that characterizing lower mass stars (Andrews & Williams 2005, 2007). If so, then the lifetime of the median disk around a star with 2 M☉ will be reduced by a factor of 5 from the 4 Myr lifetime estimated by Gorti, Dullemond and Hollenbach (2009) for a disk of 0.05 . If so, the lifetime of a median mass disk for a 2 M☉ star would be 0.8 Myr. Hence, by an age of 3 Myr, we would expect all but the most massive disks among the cohort of 2 M☉ stars in IC 1805 to have been eroded by photoevaporation. The 2% that still possess disks would plausibly represent that small fraction of stars with disks masses near the expected upper limit of 0.1 .
5.3 SEDs consistent with optically thin disk emission
Disks classified as “optically thin” show measurable excess emission above photospheric levels (at all IRAC bands, and where available, MIPS-24), but at levels that lie at least a magnitude (and more typically 2-3 magnitudes) below those characteristic of geometrically flat, optically thick accretion disks (i.e., disk structures that would obtain in an accretion disk in which grains have settled to the disk midplane at radii 10-20 AU; see Hillenbrand et al. 1992). Only five such disks are found among our sample of IC 1805 members, and one of those is likely a CBe star. This represents 0.9% of our total sample, and so such disks are rare. Below, we discuss two possible origins for the observed excess emission: from optically thin gas and optically thin dust.
The possibility that gas emission accounts for the observed excesses in stars showing SEDs similar to our optically thin class was discussed by Hillenbrand et al. (1992) in their study of a large sample of Herbig AeBe stars; the authors adopted the nomenclature “Group III” for these objects. This nomenclature has sometimes resulted in confusion given the by now common practice of referring to low mass PMS stars that lack any infrared excess emission as “Class III” objects. The objects in “Group III” in the Hillenbrand et al. (1992) sample of AeBe stars show strong H emission, have spectral types ranging from B0-B3, and are embedded within molecular cloud complexes (as evidenced by their illuminating nearby reflection nebulae). Hillenbrand et al. (1992) speculated that these objects might be analogous to classical Be stars, whose H emission lines and small IR excesses are believed to arise in gaseous decretion disks produced as a consequence of rapid rotation.
As noted, one optically thin disk found in our study of IC 1805 surrounds a B2 star, which was classifed as a Be star by Massey et al. (1995a). One other (No. 4) is a B8 star. We do not have spectral types for two others (No. 122 and 461), but given their observed and magnitudes, they are also likely to be late B stars. No. 271, which is on the borderline between optically thick and thin emission, is an F8 star.

Thus four of the optically thin disks in our sample are likely to be considerably later in spectral type than those comprising the “Group III” stars discussed by Hillenbrand et al. (1992) and also later in spectral type than the majority of CBe stars. Unfortunately, the spectra used to classify stars in our sample lack the spectral resolution needed to identify H emission objects unambiguously, particularly given the high and variable emission arising from the H II region surrounding the cluster. Nevertheless, their SEDs provide the basis for testing whether their excess emission could arise from a gaseous disk. In Figure 10, we plot the SEDs for each of our optically thin disks. Superposed on this plot is the median SED, along with the upper and lower quartile SEDs derived from observations of a sample of 101 CBe stars (Cote and Waters 1987). This Figure shows that the shape of the SEDs for these objects mimics those that characterize the gaseous disks of CBe stars.
Optically thin emission could also arise from dust emission. Currie et al. (2009) have indeed argued that among low mass PMS stars, such SEDs arise in “homologously depleted disks (HDDs).” According to these authors, such disks represent a relatively long-lived “transition phase” as optically thick accretion disks begin to develop systems of planetesimals, and later, planets. They suggest that HDDs are significantly depleted in small dust grains relative to typical optically thick accretion disks. The SED slopes for the excess emission produced by these disks approximately follow a power law through 24 m, a result similar to that shown in Figure 10. In analogy to our “optically thin disks,” the disks classified as HDDs are underluminous compared to an optically thick, geometrically thin disk by a factor of 2-3 from 5.8 m to 24 m. Currie et al. suggest that these features are consistent with a disk that loses a significant amount of mass of small dust grains at all disk radii simultaneously, which they attribute to the growth of dust to larger bodies.
Critical to distinguishing between competing explanations (gas vs. dust emission) for optically thin disks around pre-main sequence stars of all masses would be measurements of (a) Balmer emission line profiles, whose observation would reveal the likely presence of circumstellar gas, and whose morphology would reveal whether or not the gas is accreting; (b) high spectral resolution measurements of CO or other gas tracers; the shape of such features would provide incontrovertible evidence of gas in Keplerian motion around the star; and c) silicate emission features, whose presence would provide clear evidence of heated dust in an optically thin disk and whose morphology would diagnose whether or not significant grain growth has taken place. Until such measurements are available, it will be impossible to distinguish between a gas or dust origin for the excess emission arising in optically thin disks around pre-main sequence stars.
5.4 SEDs consistent with optically thin inner and optically thick outer disks (thin/thick)
These sources have weaker and IRAC flux densities compared to those corresponding to optically thick accretion disks, but 24 m flux densities that are consistent with emission arising from optically thick disks. There are low mass analogs among well studied examples of stars with “inner holes and gaps” (of size 2-10 AU) such as Hen 3, TW Hya (Calvet et al. 2005; Low et al. 2005; see also Strom et al. 1989 and Skrutskie et al. 1990 for an historical perspective on this class of disks, initially dubbed “transition disks”). Only two stars (Nos. 682 and 882) fall in this category – that is, 1/4 the number with optically thick disks and only 0.4% of the total sample of IC 1805 members. Note, however, that in most cases, the high upper limits to 24 m flux densities mitigate against firm detection of other such objects which may be present in our optically-selected sample of candidate members.
The small excesses found at short IR wavelengths in such disks have been attributed to emission arising from small dust grains located in inner disk regions (in these cases, 20 AU). Based on this hypothesis, Robitaille et al. (2006) estimate that to M☉ of small dust grains can explain the SEDs for “typical” thin/thick disk surrounding low mass stars. Mass estimates based on mm- and sub-mm measurements suggest outer disk masses ranging from to M☉ (Najita, Strom, & Muzerolle 2007), but see Marin et al. (2010) and Cieza et al. (2010) for examples of similar objects with much lower disk masses.
Najita et al. (2007) have suggested that the observed properties of thin/thick disk systems, at least among low mass pre-main sequence stars, can best be explained by positing the formation of a Jovian-mass planet in the inner regions ( 10 AU) of an accretion disk having total mass and surface density consistent with forming planets of 1 . Simulations suggest that in such disks, accretion onto the star will continue via “accretion streams,” albeit at rates lower than those characterizing accretion disks of comparable mass but in which giant planet formation has not (yet?) taken place (e.g., Lubow, Seibert, & Artymowicz 1999). The Jovian mass planet opens up a gap, whose size depends on the mass of the planet and the physical properties of the accretion disk. The lower accretion rate onto the star results because the planet accretes 90% of the material flowing inward from the outer regions of the (still) optically thick outer disk regions. The duration of this phase is expected to be short ( years), owing to the rapid rate at which material accretes onto the Jovian mass planet; once the planet reaches a sufficiently high mass, it can truncate the disk tidally, and halt accretion onto the star. The presence of optically thin emission arising from the inner disk regions presents a puzzle; the accretion rates onto the star, coupled with reasonable estimates of the disk viscosity, suggest that the accreting material populating the inner disk must be highly depleted in small grains relative to the populations of such grains in an unprocessed ‘interstellar mix’ of gas and solid material. The mechanism(s) needed to deplete the small grain population are currently unknown (though see Najita et al. 2007 for a discussion of various possibilties).
Determining whether the formation of a Jovian mass planet is a plausible explanation for the thin/thick disks observed among the intermediate mass stars in our sample would require measurements of (a) outer disk masses inferred from millimeter and sub-millimeter measurements, in order to place thin/thick objects in the vs plane; (b) accretion rates inferred from modeling Balmer or Brackett line emission profiles (e.g., Muzerolle, Calvet, & Hartmann 1998; Muzerolle, Calvet, & Hartmann 2001); (c) observation of the distribution of gas in the inner and outer disks via measurement of line profiles for gas tracers such as CO and H2O; such mid-IR measurements can diagnose the presence/absence of gaps (e.g., Najita et al. 2010; Brittain, Najita & Carr 2009; Najita, Crockett, & Carr 2008). If the planet formation hypothesis is correct, the thin/thick disks should exhibit low accretion rates compared to those typical of optically thick accretion disks of comparable mass and CO or H2O profiles consistent with “gaps” in the distribution of gas consistent with the gas flow models proposed by, for example, Lubow et al. (1999). Unfortunately, with the exception of accretion rates estimated via Balmer or Brackett line profiles, the sensitivity of current ground-based optical/IR and mm telescopes is insufficient to carry out such measurements for clusters as distant as IC 1805. However, searches for analogs of thin/thick disks among more proximate regions of intermediate mass star formation (e.g., the North American Nebula at a distance 600 pc; see Guieu et al. 2009 and Rebull et al. 2010) may provide a target list of sufficient richness for more detailed studies.
5.5 SEDs consistent with empty inner holes and optically thin outer disks (empty/thin)
Such disks show no evidence of significant excess (0.5 mag; see §4.2) above the stellar photosphere for wavelengths , where is the shortest wavelength at which significant excess emission is observed to lie above photospheric levels. These stars are nearly 10 times more common than the optically thick accretion disk population and comprise 8.9% of the total population of IC 1805 members with 2 M☉.
Unfortunately, all but one of the stars in IC 1805 that fall in this category lack 24 m measurements, owing primarily to a combination of sensitivity and confusion between source and nebular background at this wavelength. That one star (No. 340) could be a variant within the thin/thick disk objects and thus could be in the process of forming extrasolar giant planets. For the other stars, we cannot distinguish between this possibility or an alternative, namely that they might be analogs of the objects discussed by Currie et al. (2009): objects in which the observed optically thin excess emission at 8 m among our IC 1805 sample of empty/thin disks derives directly from the growth of planets following the precepts of Kenyon and Bromley (2005; 2008), i.e., the “collisional cascade” model. In this case, the emission seen at 24 m even for the older stars studied by Currie et al. (see also Hernandez et al. 2006) fall below the upper limits measured at 24 m for the IC 1805 stars in this category.
The Kenyon and Bromley simulations start with a swarm of -10 km icy bodies that collide and rapidly grow ( 1-2 Myr) to a size of 1000 km (runaway growth phase). Once icy bodies grow to 1000 km sizes, they stir the leftover planetesimals to much higher velocities. These higher velocities reduce the rate of planet growth (gravitational focusing is less important), and the planets enter a phase of oligarchic growth. The higher velocities characteristic of the stirred planetesimal swarm also cause more energetic collisions between planetesimals, resulting in more fragmentation and an increase in the dust production rate. Currie et al. (2007; 2008) present a series of color-color diagrams in which they track the evolution of IRAC and MIPS-24 excesses as a function of time. Qualitatively, there is an initial rise in excess emission resulting from planetesimal formation and stirring, followed by a peak, and an exponential decay resulting from a diminishing number of remnant planetesimals, combined with removal of small dust by radiation pressure and Poynting-Robertson drag. For their ‘canonical’ model, the peak in 8 m emission vs. time occurs early, 1 Myr, and decays rapidly thereafter, while the peak for 24 m occurs at 10 Myr, reflecting the more leisurely timescales for planet building in the outer disk (where lower Keplerian rotation speeds obtain) as compared with the inner disk. Hence, as stars evolve over the age range 1-10 Myr, the emission at 8 m and shortward is expected to drop rapidly, while the excess at 24 microns increases. Since our IC 1805 sample spans ages 1-3 Myr, it is tempting to attribute the observed 8 micron excess emission to the stirring of planetesimals in the inner disk. We note, however, that the magnitude of the 8 m excess emission seen in IC 1805, typically slightly more than one magnitude, appears to exceed that predicted by the canonical Kenyon and Bromley model. Adjustments to their model (e.g., Currie et al. 2007) that posit a greater density of planetesimals in the inner regions and/or include the effects of PAH emission from the dust might plausibly produce the larger excesses that we observe (see §4.2).
5.6 SEDs consistent with empty inner and optically thick outer disks (empty/thick)
The SEDs in this category exhibit flux densities consistent with photospheric emission at wavelengths 8 m and shortward, and 24 m flux densities consistent with an optically thick disk. Only four objects in our sample have SEDs consistent with “empty/thick” disks (that is, slightly less than half of the number of optically thick accretion disks). Two mechanisms could explain such disks: (a) tidal isolation of the inner and outer disk by a supra-Jovian mass () planet, a brown dwarf, or a stellar companion; or (b) isolation of the inner and outer disk via photoevaporation driven by EUV radiation from the central star. In particular, isolation, and rapid inner disk clearing, occurs when the photoevaporation rate driven by the central star exceeds the rate at which material from the outer disk accretes inward to the central star, thus precluding inward accretion. Once this happens, material in the inner disk is isolated from the outer disk, following which it accretes rapidly onto the star (on a viscous timescale). After the disk develops an empty “inner hole,” radiation from the central star can illuminate the inner disk “wall” located at an initial radius, , which is equal to the radius at which the escape speed of radiatively heated disk material exceeds the gravitational pull of the star-disk system, . Once the inner disk empties, photoevaporation begins to erode the disk not only from the surface, but from “inside out” as increases in response to photoevaporation of material from the inner wall of the disk; the demise of the disk is near!
The factors (e.g., Alexander et al. 2006; Clarke, Gendrin, & Sotomayor 2001) that affect when and whether this latter mechanism becomes important depend on (i) the frequency distribution of initial disk accretion rates, which in turn reflect the distribution of disk sizes and masses; (ii) the decrease in disk accretion rate with time; and (iii) the photoevaporation rate. Disks with lower initial accretion rates (perhaps those with lower initial masses) will reach the “balance point” between photoevaporation and accretion rates earlier than their brethren among higher initial accretion rate (higher mass) disks. Whether photoevaporative clearing “wins” in any particular disk depends on both initial conditions and the (unknown, but eventually constrainable) rates at which giant planet-building takes place.
From the discussion above, it appears plausible to assume that photoevaporation plays a major role in driving the evolution of disks among stars more massive than 2 M☉. Recall that the overwhelming majority of intermediate (2-4 M☉) mass stars in IC 1805 have already lost their disks at very early ages ( 2 Myr), and moreover, higher mass stars (which are expected to photoevaporatively erode their disks on timescales 0.5 Myr) are observed to lack any remnant accretion disks. Both observations are qualitatively consistent with photoevaporation models (Gorti, Dullemond, & Hollenbach 2009). Are the empty/thick disks among our sample evidence of the ongoing effects of photoevaporation on the few surviving optically thick accretion disks?
Two factors provide some, albeit relatively weak, support for this proposal. First, the radius () at which disks become susceptible to photoevaporation is 20 AU for a 3 M☉ star (Gorti, Dullemond, & Hollenbach 2009). As noted above, isolated material within accretes onto the star rapidly (on a timescale years), leaving an inner disk hole of initial dimension . For a disk with AU, the observed SED should exhibit no excess shortward of 8 m, and excess emission consistent with that from an optically thick disk at 24 m. The observed morphology of the SEDs observed for our empty/thick disks jibes with SEDs expected for disks whose structure is determined by ongoing photoevaporation. The lifetime of empty inner/thick outer disk systems is short: several years. Hence we would expect that, were photoevaporation responsible for producing the majority of empty/thick systems, such systems should comprise about 10-20% of the number of optically thick accretion disk systems that survive for 2 Myr (the age of most stars in IC 1805). The observed fraction, 4/8, is larger but perhaps not inconsistent with this estimate, given the small numbers of empty/thick and optically thick accretion disk systems.
More robustly choosing between the hypotheses that companions or photoevaporation are the predominant cause of this rare disk type requires (a) sensitive searches for companions; and (b) measurements aimed at constraining accretion rates, disk gas mass, and outer disk masses. If photoevaporation is producing empty/thick disks, then we expect to see no evidence of accretion, no evidence of inner disk gas, and low outer disk masses (consistent with the low accretion rates necessary if photoevaporation is to isolate outer from inner disks). If companions produce the inner holes, then we should be able to detect spectral features from brown dwarf and cool stellar companions directly via high signal-to-noise spectroscopic searches (e.g., Prato et al. 2002). If supra-Jovian mass planets are responsible, it will be necessary to carry out high contrast ratio adaptive optics imaging of nearby analogs of the thin/thick objects in IC 1805 (e.g., those in IC 348; Muzerolle et al. 2006).
6 Conclusions
6.1 Main Conclusions
We have carried out a study of the rich, star-forming complex IC 1805 based on optical, NIR, and Spitzer mid-IR photometry, and classification resolution optical spectroscopy. Our basic conclusions are as follows.
1. The stars more massive than 12 M☉ appear to be concentrated within a relatively small region of the parent molecular cloud for the IC 1805 complex. The ages of these stars were estimated to lie between 1-3 Myr by Massey et al. (1995a). Given the uncertainty in estimating the ages of intermediate mass pre-main-sequence stars, we have assumed that the ages of the 2-4 M☉ stars studied in this paper are also 1-3 Myr.
2. We find that (i) no stars more massive than M☉ exhibit optically thick IR emission, as is characteristic of the circumstellar material surrounding Herbig AeBe stars; (ii) among stars in the mass range , less than 2% of the stars exhibit such excesses.
3. Examination of the SEDs for those stars showing IR excesses reveals four additional distinct categories: (a) emission at -band and longer wavelengths that lies significantly below that expected for an optically thick, geometrically flat reprocessing disk; we denote these as “optically thin” disks; (b) excess emission smaller than that expected for optically thick accretion disks at and, in the case of No. 882, also in the IRAC bands, but with excess emission at 24 m consistent with that expected for optically thick accretion disks; we call these thin inner region/thick outer region disks (“thin/thick”); (c) no excess emission significantly above photospheric levels at , and excess emission at least 2.5 times smaller than that expected for optically thick accretion disks at ; these disks are denoted empty inner region/thin outer region (“empty/thin”); and (d) no excess emission above photospheric levels through the IRAC bands, and excess emission consistent with that expected for an optically thick accretion disk at 24 m; we call these empty inner region/thick outer region disks (“empty/thick”). Among stars with masses greater than 2 M☉, the fraction of the total population of IC 1805 members in each of these categories is: (optically thick [AeBe]) 1.3%; (optically thin) 0.9%; (thin/thick) 0.4%; (empty/thin) 8.2%; and (empty/thick) 0.7%
4. We interpret stars in the “optically thick” category as the tail end of a population of optically thick accretion disks that have survived for 3 Myr; 98% of their brethren have already transitioned from the accretion phase to the other categories described above, or show no evidence of remnant or second generation “debris” disk material (at least as yet). We estimate that the median lifetime for optically thick accretion disks in this mass range is 0.5 Myr, and speculate that the 2% remaining in the accretion phase until 2 Myr are those that had initial disk masses near the high end of the distribution of disk masses that characterized intermediate mass stars on the birthline (just after they detach from their infalling envelopes).
5. We suggest that photoevaporation, driven by the powerful extreme and far ultraviolet radiation fields characteristic of stars with M☉ likely accounts for the fact that none of the high-mass stars in this survey shows evidence of excess emission arising in an optically thick accretion disk; such disks are destroyed by photoevaporation on timescales 0.5 Myr. We argue that photoevaporation as well represents an attractive mechanism for explaining the rapid destruction of disks among stars with .
6. We propose that stars in the “optically thin” category are either surrounded by gas-dominated disks, analogous to the decretion disks believed to surround classical, rapidly rotating Be stars, or by debris disks in which vigorous dust production is ongoing both in the terrestrial and outer planet regions.
7. We suggest that the “thin inner disk/ thick outer disk” SED likely results from the formation of a Jovian mass planet that has produced a gap inward of the orbital radius of the planet. Such disks find their analog among well-studied “transition disks” around low mass stars that share this SED morphology with the intermediate mass stars studied here.
8. We suggest that stars in the fourth category owe their “empty inner disk/thin outer disk” SEDs to the production of dust by a planetesimal swarm located at disk radii 10 AU.
9. Stars in the last category, those with empty inner disks and optically thick outer disks (“empty/thick”), seem best explained by positing either a companion of mass sufficient to tidally isolate material located in the outer optically thick disk; or a disk in which the accretion rate has dropped below the photoevaporation rate. Disks in this latter state quickly develop an inner hole, as material inward of the photoevaporation radius () accretes onto the central star on a viscous timescale, while material in the outer disk is prevented from accreting inward from .
6.2 Implications for Planet Building
Optically thin disks, if they are indeed building planets, are likely forming planetesimals and/or low mass planets. If so, then the observed optically thin emission arises from dust produced in collisions between planetesimals spanning a wide range (1 to 20 AU). However, before accepting this explanation, it is essential to establish that the observed excesses arise primarily from dust rather than gas.
Thin/thick disks are the most likely candidates to be forming giant planets. Of a sample of nearly 500 stars of intermediate mass ( 2-4 M☉), only two objects exhibit this type of SED. If these objects are indeed forming Jovian mass planets, it is interesting to note that the orbital distance of the planet is 20 AU (that is, the size of the ‘gap’ inward of the region of the disk which produces emission consistent with that observed for an optically thick disk at 24 m). This distance roughly corresponds to the ice sublimation radius for a disk surrounding a 3 M☉ star, the radius that many theories of giant planet formation posit as a natural place for forming giant planets, where a ‘snowstorm’ at the ice sublimation radius may accelerate the rapid formation of a massive solid core that ultimately accretes surrounding gas (Ida & Lin 2008).
The 45 objects found in the empty/thin category may be in a very early stage of planetesimal/planet building in which planetesimal building in the inner disk ( 10 AU) is already well underway.
Even if all of the objects in the optically thin, thin/thick, and empty/thin categories are in the process of forming either planetesimals or planets, not more than 10% of the stars in IC 1805 show evidence of such activity. This is far below the fraction in older groups (e.g., Hernandez et al. 2006). The absence of significant numbers of stars exhibiting signatures of nascent planet-building may well result from our inability to measure 24 m flux densities (as opposed to upper limits or the star being off the edge of the map) for all but 5% (48 of the 974) of the stars in the total sample. If planetesimal building mimics the ‘canonical’ model first suggested by Kenyon & Bromley (2005; 2008), then we might expect for most stars with ages 1-2 Myr and older, the ‘wave’ of planet building has already passed through the inner portions of the disk observed in the IRAC bands. If so, then planetesimal collisions (and resulting production of dust debris) should be restricted to the outer disk, in which case IR excess emission will be observable only at wavelengths 24 m and beyond. The significant fraction (46%) of disks in Orion Ia (10 Myr) and in Orion Ib ( 5 Myr; 38% disks) that show optically thin emission at 24 m, but exhibit no excess emission at shorter wavelengths (Hernandez et al. 2006) would suggest that we could indeed, be missing a large number of such disks in IC 1805. Observations of a sample of intermediate mass stars in the North American Nebula ( 600 pc), where more robust 24 m measurements are possible, would provide a test of the hypothesis that a significant number of young ( 2 Myr) intermediate mass stars are undergoing planetesimal collisions in their outer disks (following a short-lived phase of such planet-building in their inner disks).
References
- (1) Alexander, R.D., Clarke, C. J., & Pringle, J. E. 2006, MNRAS, 369, 229
- (2) Andrews, S. M., & Williams, J. P. 2005, ApJ, 631, 1134
- (3) Andrews, S. M., & Williams, J. P. 2007, ApJ, 659, 705
- (4) Brittain, S. D., Najita, J. R., Carr, J. S. 2009, ApJ702, 85
- (5) Calvet, N., et al. 2005, ApJ, 630, L185
- (6) Calvet, N., Hartmann, L. & Strom, S.E. 2000 in Protostars and Planets IV (University of Arizona Press, Tucson) p 377.
- (7) Cieza, L. A., et al. 2010, ApJ, 712, 925
- (8) Clarke, C. J., Gendrin, A., & Sotomayor, M. 2001, MNRAS, 328, 485
- (9) Cote, J. & Waters, L. B. F. M. 1987, A&A 176, 93
- (10) Crawford, D.L., & Perry, C. L. 1976, AJ, 81, 419
- (11) Currie, T., et al. 2007, ApJ, 663, L105
- (12) Currie, T., et al. 2008, ApJ, 672, 558
- (13) Currie, T., & Kenyon, S. 2009, AJ, 138, 703
- (14) Currie, T., et al. 2009, ApJ, 698, 1
- (15) Dahm, S. E., & Hillenbrand, L. A. 2007, AJ, 133, 2072
- (16) Dougherty, S.M., Taylor, A. R., & Clark, T. A. 1991, AJ, 102, 1753
- (17) Dougherty, S.M. et al. 1994, A&A 290, 609
- (18) Engelbracht, C., et al., 2007, PASP, 119, 994
- (19) Evans, N., et al. 2009, arXiv:0901.1691v1
- (20) Fazio, G., et al.2004a, ApJS, 154, 10
- (21) Fazio, G. G., et al. 2004b, ApJS, 154, 39
- (22) Finkenzeller, U. 1985, å, 151, 340
- (23) Flaherty, K. M., et al. 2007, ApJ, 663, 1069
- (24) Gordon, K., et al.2005, PASP, 117, 503
- (25) Guieu, S., et al. 2009, ApJ, 697, 787
- (26) Gorti, U., Dullemond, C. P., & Hollenbach, D. 2009, ApJ, 705, 1237
- (27) Haisch, K. E., Jr., Lada, E. A., & Lada, C. J., 2001, ApJ, 553, L153
- (28) Hernandez, J., et al. 2005, AJ, 129, 856
- (29) Hernandez, J., et al. 2006, ApJ, 652, 472
- (30) Hernandez, J., et al. 2007, 662, 1067
- (31) Hillenbrand, L. A. 1997, AJ, 113, 1733
- (32) Hillenbrand, L. A., Strom, S. E., Vrba, F. J., & Keene, J. 1992, ApJ, 397, 613
- (33) Hillenbrand, L. A., Massey, P., Strom, S. E., & Merrill, K. M. 1993, AJ, 106, 1906
- (34) Ida, S., & Lin, D. N. C. 2008, ApJ, 685, 584
- (35) Indebetouw, R., et al. 2005, ApJ, 619, 931
- (36) Kang, M., Bieging, J. H., Povich, M. S., & Lee, Y. 2009, ApJ, 706, 83
- (37) Kenyon, S.J., & Bromley, B. C., 2005, AJ, 130, 269
- (38) Kenyon, S.J., & Bromley, B.C., 2008, ApJS, 179, 451
- (39) Koenig, X., & Allen, L. A. 2010, in preparation
- (40) Lada, C. J., et al. 2006, AJ, 131, 1574L
- (41) Low, F.J., et al. 2005, ApJ, 631, 1170
- (42) Lubow, S.H., Seibert, M., & Artymowicz, P. 1999, ApJ, 526, 1001
- (43) Makovoz, D., & Marleau, F. 2005, PASP, 117, 1113
- (44) Massey, P., Johnson, K. E., & Degioia-Eastwood, K. 1995a, ApJ, 454, 151
- (45) Massey, P., Lang, C. C., Degioia-Eastwood, K., & Garmany, C. D. 1995b, ApJ, 438, 188
- (46) Massey, P., Puls, J., Pauldrach, A. W. A., Bresolin, F., Kudritzki, R. P., & Simon, T. 2005, ApJ, 627, 477
- (47) Merin, B., et al. 2010, ApJ, 718, 1200
- (48) Muzerolle, J., Calvet, N., & Hartmann, L. 1998, ApJ, 492, 743
- (49) Muzerolle, J., Calvet, N., & Hartmann, L. 2001, ApJ, 550, 944
- (50) Muzerolle, J., et al. 2003, ApJ, 592, 266
- (51) Muzerolle, J. et al. 2006, ApJ643, 1003
- (52) Muzerolle, J., Allen, L. E., Megeath, S. T., Hernandez, J., & Guthermuth, R. A. 2010, ApJ, 708, 1107
- (53) Najita, J.R., Strom, S. E., & Muzerolle, J. 2007, MNRAS, 378, 369
- (54) Najita, J.R., Crockett, N. & Carr, J. 2008, ApJ, 687, 1168
- (55) Najita, J.R., Carr, J. S., Strom, S. E., Watson, D.M., Pascucci, I., Hollenbach, D., Gorti, U. & Keller, L. 2010, ApJ, 712, 274
- (56) Prato, L, Simon, M., Mazeh, T., McLean, I. S., Norman, D., and Zucker, S. 2002, ApJ, 569, 863
- (57) Rebull, L., et al., 2008, ApJ, 681, 1484
- (58) Rebull, L., et al.2010, ApJ, in preparation
- (59) Rieke, G. H., & Lebofsky, M. J. 1985, ApJ, 288, 618
- (60) Rieke, G., et al.2004, ApJS, 154, 25
- (61) Robitaille, T. P., Whitney, B. A., Indebetouw, R. , Wood, K., & Denzmore, P. 2006, ApJS, 167, 256
- (62) Sagar, R., Myakutin, V. I., Piskunov, A. E., & Dluzhnevskaya, O. B. 1988, MNRAS, 234, 831
- (63) Schaller, G., Schaerer, D., Meynet, G., & Maeder, A. 1992, A&AS, 96, 269
- (64) Siess L., Dufour E., Forestini M. 2000, A&A, 358, 593
- (65) Skrutskie, M. F., Dutkevitch, D., Strom, S. E., Edwards, S., Strom, K. M., & Shure, M. A. 1990, AJ, 99, 1187
- (66) Skrutskie, M., et al.2006, AJ, 131, 1163
- (67) Strom, S. E. 1972, PASP, 84, 745
- (68) Strom, S. E., Strom, K. M., Brooke, A. L., Bregman, J., & Yost, J. 1972, ApJ, 171, 267
- (69) Strom, K. M., Strom, S. E., Edwards, S., Cabrit, S., & Skrutskie, M. F. 1989, AJ, 97, 1451
- (70) Testi, L., Palla, F. and Natta, A. 1998 A&AS 133, 81
- (71) Vasilevskis, S., Sanders, W.L., & van Altena, W. F. 1965 AJ, 70, 806
- (72) Warren, P. H., & Hesser, J. E. 1978, ApJS, 36, 497
- (73) Werner, M., et al., 2004, ApJS, 154, 1
Appendix A Complete set of SEDs
Figure 11, available online only, shows the complete set of SEDs for the stars with excesses. The magnitudes relative to have been corrected for reddening, and the photospheric emission has been subtracted.
