S-waves and the extraction of
Abstract:
The Violating asymmetry in mixing () is one of the most promising measurements where physics beyond the Standard Model could be revealed. As such, analyses need to be subjected to great scrutiny. The mode has been used, and the mode proposed for future measurements. These modes both have two vector particles in the final state and thus angular analyses must be used to disentangle the contributions from and configurations. The angular distributions, however, could be distorted by the presence of S-waves masquerading as low mass pairs, that could result in erroneous values of . The S-waves could well be the result of a final state formed from an -quark -quark pair in a spin-parity state, such as the meson. Data driven and theoretical estimates of the decay rate into the final state are given, when . The S-wave contribution in should be taken into account when determining by including a S-wave amplitude in the fit. This may change the central value of current results and will also increase the statistical uncertainty. Importantly, the mode has been suggested as an alternative channel for measuring .
1 Introduction
Measurements of Charge-Parity () violation in the meson system are sensitive to the presence of heavy, as yet undiscovered, particles. The violating angle , the so called “phase of mixing” is a particularly important place to look for physics beyond the Standard Model, since the expected asymmetry is very small, [1], thus allowing the effects of any new physics to be more easily observed. Both CDF [2] and D0 [3] have investigated using decays. Central values have been found far from the expected Standard Model values, but the errors are large and the results are not statistically significant.
Since the final state consists of two spin-1 particles, it is not a -eigenstate, yet it is well known that violation can be measured using angular analyses [4]. Except for one very recent analysis [5], previous determinations have ignored the possibility of an S-wave system in the region of the . Not accounting for the S-wave can bias the result, and the resulting quoted error is smaller than if the S-wave components are allowed in the fit.
2 Evidence for S-waves
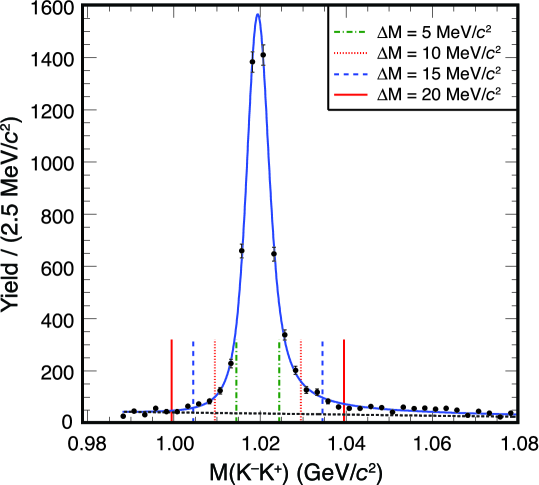
In fact, there is a great deal of evidence for S-waves in many decays where vectors are dominant. Consider the reaction . This mode has long been known to have large and components [6]. CLEO has looked explicitly at the low mass region in the Dalitz plot [7]. Fig. 1 shows the mass projection in the region near 1 GeV. The signal is extracted by fitting the yield in each bin of , so no background remains in the plot. There is an additional component of signal beneath the . To estimate the size of this component, the CLEO data are fit to a Breit-Wigner to describe the , convoluted with a Gaussian for detector resolution, and in addition a linear component that we take as an S-wave based on Dalitz plot studies. The fraction of S-wave depends on the mass interval considered. For 10 MeV around the mass there is a 6.3% S-wave contribution, which rises to 8.9% for a 15 MeV interval. (Note that these fractions depend on the experimental resolution.)
If the S-wave here is the (980) state, then we should see an signal peak in the final state, since the (980) decays into as well as . A BaBar Dalitz plot analysis shows a large signal [8].
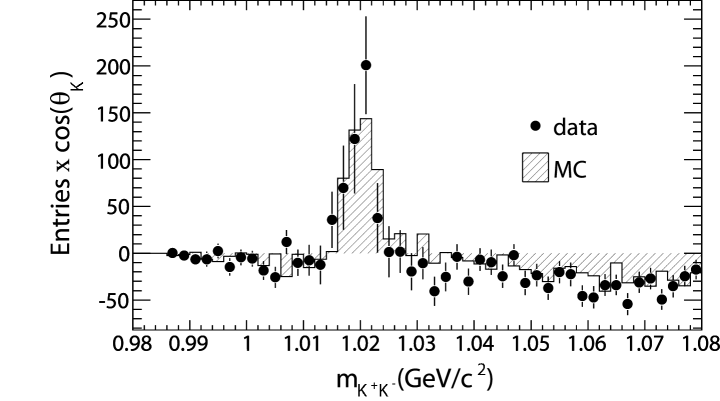
S-wave effects have also been observed in semileptonic charm decays. FOCUS observed an interfering S-wave amplitude in the channel with a rate fraction of (2.70.4)% with respect to the P-wave in the invariant mass region between 0.8–1.0 GeV [9]. BaBar measured an S-wave fraction in decays of % for invariant masses between 1.01–1.03 GeV [10]. The invariant mass spectrum when weighted by the decay angle shows a clear distortion due to the interference (Fig. 2).
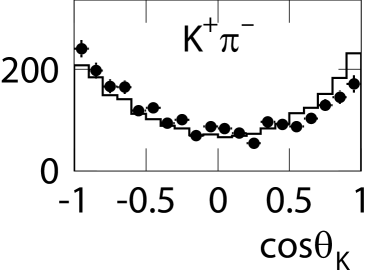
The analogous channel to in decay is well known to have an S-wave component in the mass region. This interference, in fact, has been used by BaBar to measure and thus remove an ambiguity in the value of from the measurement. The S-wave component in the region of the is measured as % of the P-wave for GeV [11]. BaBar uses this interference to remove ambiguities in the measurement of , where is the violating angle measured in decays, for example. Visual evidence of the S-wave can be seen in Fig. 3 where there is an obvious asymmetry of the decay angle distribution of the kaon in the rest-frame.
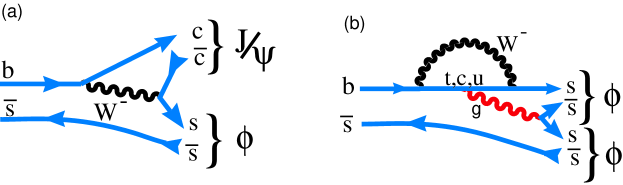
Perhaps it may be hoped that the S-wave under the in is smaller due to the relatively narrow width () of the (4.3 MeV) compared to the (51 MeV), but even so, the question is how much does the presence of the S-wave affect the extraction of ? Similar considerations apply to the measurement of violation in the process . Here the problem is exacerbated by the presence of two ’s in the final state. The decay diagrams for both of these processes are shown in Fig. 4. In both cases the forms a . Other manifestations of quarks are the , and (980) mesons. The first two are pseudoscalars, while the last is a scalar.
The formalism for the time dependent and decay rates as a function of the decay angular distributions is given in Ref. [12]. Addition of the S-wave amplitudes was done by Xie et al. [13]. The number of terms to consider increases from 6 to 10. Another approach has been given by Azfar et al. [14]. Adding the S-wave terms in the fit can only increase the experimental error. The size of the effect depends on many factors including the magnitude and phase of the S-wave amplitude, , values of the strong phases, detector acceptances, biases, etc..
While S-waves are a nuisance in analyzing the final state, they can also be used beneficially. When the materializes as a there cannot be an iso-vector state as pair is isoscalar. Near the mass the can materialize as a pair in the state and this state is useful for measurements [15]. The final state is a eigenstate, thus no angular analysis is necessary! Note, that the modes and can also be used, but they involve photons in the decay and thus have lower efficiency at hadron colliders.
Predictions of the ratio
| (1) |
have been given based on decay data, and purely from theory. Stone and Zhang using decays where was detected in both and modes predicted % [15]. CLEO made an estimate of % based on the ratio of the branching fractions for to at where the mass difference between the and the final state hadron is largest, which best approximates decays [16].
Theoretical predictions for are difficult, however there are a few heroic attempts. Colangelo, De Fazio and Wang use Light Cone Sum Rules to make two predictions [17]. For the first they use their calculations of which are at leading order (LO) and at non-leading order (NLO), combined with the measured to predict =24% (LO) and =41% (NLO). Secondly, they use the form-factor calculation of Ball and Zwicky [18] to predict =13% (LO) and =22% (NLO), where refers to only longitudinal production, so since transverse production is about 46% this lowers their predictions for the second case by almost a factor of two [6]. The experimental predictions above for based on decays are also enhanced by normalizing to final states that are mostly longitudinal. Thus they should be lowered.
In a later paper using QCD factorization Colangelo, De Fazio and Wang [19] predict using CDSS form-factors [20], and using Ball and Zwicky [18] . These predictions are somewhat smaller than those given above, but still have as 36% or 20%. Within the framework of QCD factorization O. Leitner et al. [22] give a range of predictions for that are in the 30-50% range. Thus predictions for have a rather wide range from 7-50%.
The only reported experimental search for was done by BELLE using 23.6 fb-1 of data taken on the resonance, about 1/5 of their total accumulated data sample. They find % at 90% c.l. [21]. Their data however show a hint of signal with a central value about half of the upper limit. It will be quite interesting to see which experiment finds the signal first. CDF has recently put the S-wave amplitudes in their fits for in the channel. They find that the fitted fraction of S-wave in the signal region is % at 95% c.l. [5]. They do not however, report any result for a direct search using the channel.
In conclusion, S-waves are ubiquitous, they appear whenever looked for and must be taken into account in measurements of amplitudes, phases, and violation. Kudos to CDF for including S-waves in their most recent fits. In addition it appears to be wise to add S-wave amplitudes in the analysis of and surely in . Furthermore, especially since angular analysis is not required, may be a useful mode to add to the statistical precision on the measurement of and will provide a useful systematic check [23].
Acknowledgments
I thank the U. S. National Science Foundation for support and L. Zhang for his collaboration on this work.
References
- [1] J. Charles et al., Eur. Phys. J. C41, 1 (2005), hep-ph/0406184.
- [2] T. Aaltonen et al. (CDF), Phys. Rev. Lett. 100, 161802 (2008), arXiv:0712.2397v1 [hep-ex].
- [3] V. M. Abazov et al. (D0), Phys. Rev. Lett. 101, 241801 (2008), arXiv:0802.2255v1 [hep-ex]; see also talk of A. Chandra in these proceedings.
- [4] I. Dunietz, H. R. Quinn, A. Snyder, W. Toki and H. J. Lipkin, Phys. Rev. D 43, 2193 (1991); J. L. Rosner, Phys. Rev. D 42, 3732 (1990); A. S. Dighe, I. Dunietz, H. J. Lipkin and J. L. Rosner, Phys. Lett. B 369, 144 (1996), hep-ph/9511363.
- [5] L. Oakes, “ Measurement of at CDF,” in these proceedings.
- [6] K. Nakamura et al.. (Particle Data Group), J. Phys. G 37, 075021 (2010).
- [7] J. Alexander et al. (CLEO), Phys. Rev. Lett. 100 161804, (2008).
- [8] B. Aubert et al. (BaBar), Phys. Rev. D 79, 032003 (2009), arXiv:0808.0971 [hep-ex].
- [9] J. M. Link et al., (FOCUS Collaboration), Phys .Lett. B 621, 72 (2005) hep-ex/0503043.
- [10] B. Aubert et al., (BaBar Collaboration), /Phys Rev D. 78, 051101 (2008) arXiv:0807.1599 hep-ex.
- [11] B. Aubert et al. (BaBar), Phys. Rev. D71, 032005 (2005), arXiv:hep-ex/0411016; see also B. Aubert et al. (BaBar), Phys. Rev. D76, 031102 (2007), arXiv:0704.0522v2 [hep-ex].
- [12] T. Aaltonen Phys. Rev. Lett. 100, 121803 (2008).
- [13] Y. Xie et al., JHEP 0909, 074 (2009).
- [14] F. Azfar, et al. “Formulae for the Analysis of the Flavor-Tagged Decay ,” arXiv:1008.4283 [hep-ph]
- [15] S. Stone and L. Zhang, Phys. Rev. D79, 074024 (2009) [arXiv:0812.2832].
- [16] K. M. Ecklund et al. (CLEO), Phys. Rev. D 80 052009 (2009) arXiv:0907.3201 [hep-ex].
- [17] P. Colangelo, F. De Fazio and W. Wang, Phys. Rev. D81 074001, (2010) arXiv:1002.2880 [hep-ph].
- [18] P. Ball R. Zwicky Phys. Rev. D71, 014029 (2005) hep-ph/0412079.
- [19] P. Colangelo, F. De Fazio and W. Wang, “Nonleptonic to charmonium decays: analyses in pursuit of determining the weak phase ,” arXiv:1009.4612 [hep-ph]
- [20] P. Colangelo, F. De Fazio, P. Santorelli and E. Scrimieri, Phys. Rev. D53 3672, (1996); Erratum-ibid. D57, 3186 (1998).
- [21] R. Louvot, “ Decays at B-factories,” in these proceedings.
- [22] O. Leitner et al., “Scalar resonance effects on the mixing angle,” arXiv:1003.5980 [hep-ph].
- [23] S. Stone and L. Zhang, “Measuring the CP Violating Phase in Mixing Using ,” arXiv:0909.5442 [hep-ph]