Searching for compact objects in SNRs G27.8+0.6 and G28.8+1.5111Based on observations obtained with XMM-Newton, an ESA science mission with instruments and contributions directly funded by ESA Member States and NASA.
Abstract
We analyzed XMM-Newton observations of two center-filled supernova remnants, G27.8+0.6 and G28.8+1.5, to search for pulsars/pulsar wind nebulae (PWNe) and other types of neutron stars associated with these remnants. We discovered a PWN candidate within the extent of the centrally-peaked radio emission of G27.8+0.6. The X-ray morphology of the PWN candidate and its position with respect to the host supernova remnant suggest that the alleged pulsar might be moving away from the supernova remnant’s center with a transverse velocity of around 100–200 km s-1. The majority of the detected X-ray point sources in both fields are classified as main-sequence stars, based on their bright optical counterparts and relatively soft X-ray spectra. The remaining medium-hard and hard sources are most probably either AGNs or cataclysmic variables, although we cannot completely rule out the possibility that some of these sources are neutron stars.
1 Introduction
Stellar evolution models predict that the core-collapse supernova explosions produce both a supernova remnant (SNR) and either a neutron star (NS) or a black hole (BH). The exact fraction of these two types of compact objects is not well constrained, but considering that the majority of SN explosions are believed to be the core-collapse events, a significant fraction of SNRs are expected to harbour NSs. A significant number of these NSs are rapidly spinning, and are often detected as radio, X-ray or -ray pulsars.
A young energetic pulsar loses most of its rotational energy in form of a pulsar wind (Rees & Gunn, 1974), which interacts with the surrounding medium and forms a pulsar wind nebula (PWN) that is observed as radio and/or X-ray diffuse emission (Gaensler & Slane, 2006). Due to the complexity of this interaction and anisotropy of the pulsar wind, PWNe display various shapes including toroidal structures, jets, and sometimes cometary-shaped tails formed when the pulsar is moving with a supersonic speed through the ambient medium (Kargaltsev & Pavlov, 2008). Hence, to obtain a better census of the NS–SNR associations, high-resolution X-ray (and radio) observations are very useful, as they can identify PWNe.
Recent sensitive, high-resolution X- and -ray observations have also revealed unexpected diversity in the populations of NSs associated with SNRs, which, in addition to classical radio pulsars, also include anomalous X-ray pulsars (AXPs), soft gamma-ray repeaters (SGRs), compact central objects (CCOs), and perhaps other classes of radio-quiet NSs (Kaspi & Helfand, 2002). A class of radio-quiet NSs was predicted by Shklovskii (1980), who suggested that due to their strong magnetic fields, these NSs will decelerate rapidly and become inactive in several hundreds of years after the SN explosion. Alternatively, NSs can be born with low magnetic fields (“antimagnetars”; e.g., see Halpern & Gotthelf, 2010, and references therein). The CCO in Cas A, revealed in the first-light Chandra image (see also Pavlov & Luna, 2009), is an example of such a source.
Out of almost 50 NSs possibly associated with SNRs (listed in Table 1 of Kaspi et al., 2002), 30% were detected as radio pulsars, 30% as various radio-quiet compact objects (AXPs, SGRs, CCOs), while the remaining NS–SNR associations were proposed because a diffuse, non-thermal X-ray nebula (PWN), and/or radio synchrotron nebula (plerion) were detected within the SNR, suggesting the presence of a pulsar. Kargaltsev & Pavlov (2008) list a total of 18 SNR-PWN-pulsar associations and 14 PWNe in which no pulsar has been detected to date. Kaplan et al. (2004, 2006) searched for NSs in a volume-limited (closer than 5 kpc) sample of radio-shell SNRs, but found no NSs down to the luminosity limit of typical NSs of the same ages as the observed SNRs. To search for compact stellar remnants and/or PWNe in all center-filled and composite SNRs within 5 kpc, a snapshot survey has been carried out with XMM-Newton. We present the analysis of two such SNRs, G27.8+0.6 and G28.8+1.5.
The center-filled SNR G27.8+0.6, with a relatively low surface brightness, was detected in single-dish pointed observations at 2.69, 4.75 and 10.2 GHz (Reich et al., 1984). The central part is strongly polarized, indicating a non-thermal origin and supporting the SNR classification. Reich et al. (1984) estimated the age and distance of the SNR to be 35–55 kyrs and 2–3 kpc, respectively, adopting the evolutionary model for center-filled SNRs of Weiler & Panagia (1980).
G28.8+1.5 was detected by Schwentker (1994) in ROSAT observations as a diffuse X-ray emission covering a region of , and identified by non-thermal radio emission as a 30-kyr-old SNR at a distance of 4 kpc. Schwentker (1994) also reported a 5.45 s period pulsations from a point source (which is not in the XMM-Newton field of view) in the vicinity of this SNR. However, this result has not been confirmed later (Song et al., 2000).
In a search for compact objects in these two center-filled SNRs, we analyzed all X-ray sources detected by XMM-Newton in their fields. To classify the detected objects and select PWN/NS candidates, we used the inferred X-ray properties and cross-correlation with optical, infrared, and radio data. In Section 2 we summarize our data analysis and present the compiled catalogs of the detected X-ray sources in both fields (Section 2.1), and also a search for their counterparts at other wavelengths and the proposed classifications (Section 2.2). Finally, we discuss PWN/NS candidates in Section 3.
.
2 Observations and results
G27.8+0.6 and G28.8+1.5 were observed in the Full Frame mode using medium filters. Table 1 lists the observation IDs and dates, the total exposure times and the exposure times after high-background screening. The data analysis was performed using the XMM-Newton Science Analysis System (SAS) v7.1.0. We produced PN, MOS1, and MOS2 event files using the SAS tasks epchain and emchain, and then excluded the times with high background using a threshold count-rate of 1.5 cts s-1 for all three detectors.
To search for X-ray sources in the two SNR fields, we produced PN, MOS1 and MOS2 images in five energy bands: 0.2–0.5 keV, 0.5–1.0 keV, 1.0–2.0 keV, 2.0–4.5 keV, and 4.5–12.0 keV (bands B1 to B5, respectively). This is a standard band selection for the source detection procedures in SAS, for which the source significance (detection likelihood) calculation is well established. For the PN images in band B1 we selected only single-pixel events (PATTERN=0), while single and double-pixel events (PATTERN4) were included in the other energy bands. Such a PATTERN selection was motivated by significantly higher noise from particle background in the softest PN band. We selected 1–4 pixel events (PATTERN12) in all five bands of the MOS images. For each image we produced the exposure map corrected for vignetting, the background and sensitivity maps, and the corresponding detector mask to define source detection areas. These maps were used as inputs for our source detection procedures in each SNR field.
2.1 The X-ray source catalogs
To detect the X-ray sources in the observed fields, we run the standard SAS source detection procedures searching simultaneously in a total of 15 images for each field (the 5 energy bands B1 to B5 in each of the 3 EPIC cameras). The SAS task emldetect was used to determine the parameters of the detected sources (significance, count-rates, fluxes, and hardness ratios) by using a maximum likelihood fit. We selected the likelihood threshold value of mlmin=7, which allows detection of even very weak sources (S/N34; see the SAS manual).
To convert the vignetting-corrected count rate to flux for each source in each energy band, we estimated the energy conversion factors for the PN and MOS medium filters using W3PIMMS222http://heasarc.gsfc.nasa.gov/Tools/w3pimms.html (Table 2). The cataloged values are calculated for a power-law model with a photon index of 1.7 absorbed by the columns of 1.5 and cm-2 for G27 and G28, respectively333These absorption columns are equal to the Galactic Hi columns measured in the directions of the two SNRs (Table 2).. This model fits well the majority of the detected sources, i.e, intrinsically medium-hard sources, although we found that the inferred fluxes are not very sensitive to the spectral model selection. For example, for soft sources (e.g., best-fitted by a black-body model) our cataloged flux values are overestimated by only 10%. On the other hand, for significantly harder sources (for example, a power-law with a photon index of 1) the cataloged flux values are underestimated by approximately 30%. The calculated fluxes are actually much more sensitive to the assumed absorption columns. For example, nearby stars would be much less absorbed, but even if we assume an column of only cm-2, the flux values listed in Tables 3 and 5 would be overestimated by approximately a factor of 2, which, however, does not affect the source classification significantly (Section 2.2).
After compiling the list of X-ray sources detected above the threshold in both SNR fields, we compared the X-ray positions with optical and near-infrared (NIR) data to determine possible offsets of the two XMM-Newton pointings. We cross-correlated the X-ray positions with optical (USNO-B1; Monet et al., 2003) and NIR (2MASS; Skrutskie et al., 2006) catalogs using a distance of the combined X-ray and optical/infrared positional error to associate the optical/infrared and the X-ray source. We used the identified optical/infrared counterpart candidates to calculate mean offsets in RA and DEC, but did not notice any systematic shift (within the uncertainties) with respect to the optical/infrared data. A standard 1 (residual) systematic positional error of (Watson et al., 2003) was then added quadratically to the statistical positional uncertainties of the cataloged sources.
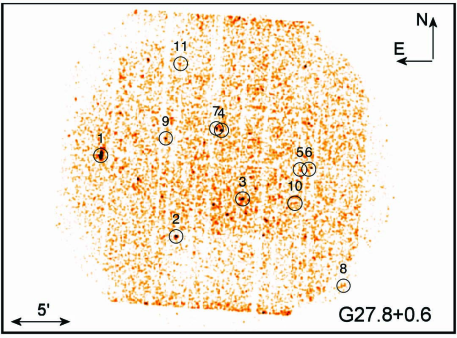
We detected 11 point X-ray sources in the field of G27.8+0.6, and 28 sources in the G28.8+15 field. The results are summarized in Tables 3 to 6. Tables 3 and 5 list the X-ray properties of these sources. The source identification number is listed in column 1 (the same source number is also used in Figure 1), while the position and the total positional error, which includes the statistical and systematic errors, are listed in clumns 2 and 3, respectively. The source detection likelihoods in all 15 images are added and transformed to the equivalent single-band detection likelihood, which is listed in column 4. Columns 5 and 6 list the total number of the accumulated counts and corresponding error, and the total flux and error in the 0.2–12.0 keV band. The fraction of the soft (0.2-4.5 keV) flux, used to calculate the ratio of the X-ray to optical flux (see Section 2.2), is listed in column 7. The hardness ratio, defined as ) (where is the count rate) and errors, all from the combined PN, MOS1, and MOS2 data, are listed in column 8. Visual inspection of the broad-band images revealed a marginaly extended source (src. #1) in the field of G27.8+0.6. We discuss this source in Section 3.
Tables 4 and 6 list the results of the cross-correlation with the USNO-B1, 2MASS, and radio (NVSS, Condon et al., 1998) catalogs, which are described in detail in Section 2.2. The detected USNO-B1/2MASS counterparts are listed in column 2, together with the offsets from the X-ray position (3), and the corresponding X-ray to optical flux ratio (4). The tentative source classification is given in column 5, and we discuss it further in Section 2.2, while column 6 lists the probability of the optical/NIR association.
The point-source sensitivity limit of the XMM-Newton observation in the field of G27.8+0.6 is about erg cm-2 s-1 [corresponding to an unabsorbed luminosity of (1–3) erg s-1 at the estimated SNR distance of 2–3 kpc and cm-2], and slightly deeper across G28.8+1.5 [ ergs cm-2 s-1 or erg s-1 at the distance of 3–5 kpc and cm-2 estimated for this SNR]. The brightest source in the G27.8+0.6 field ( ergs cm-2 s-1) is an order of magnitude brighter than any of the other detected sources, while in the second field the measured absorbed fluxes range from to erg cm-2 s-1.
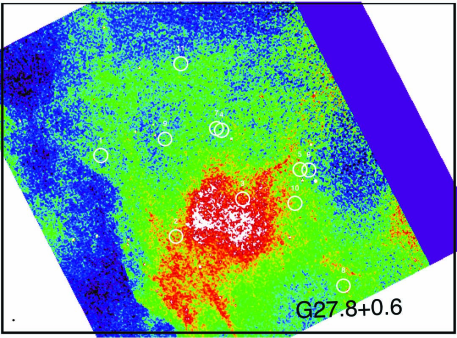
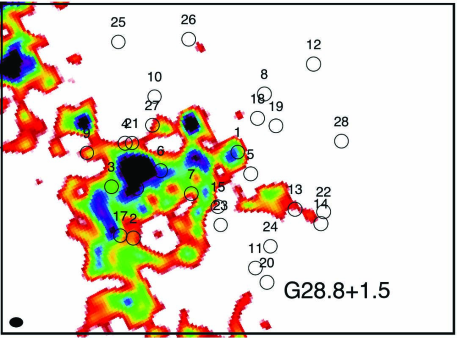
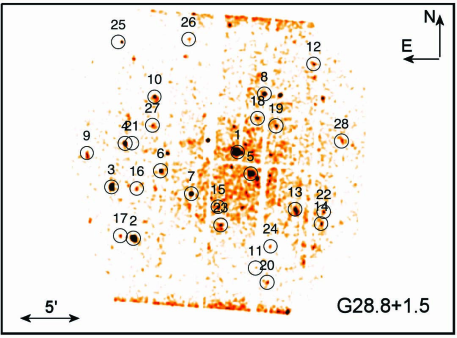
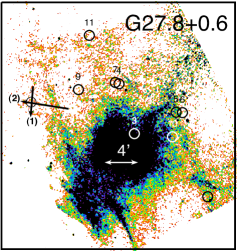
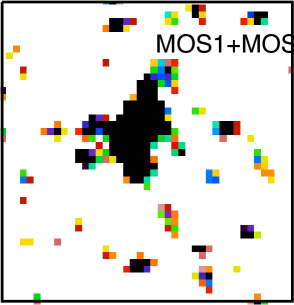
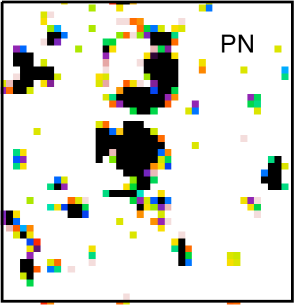
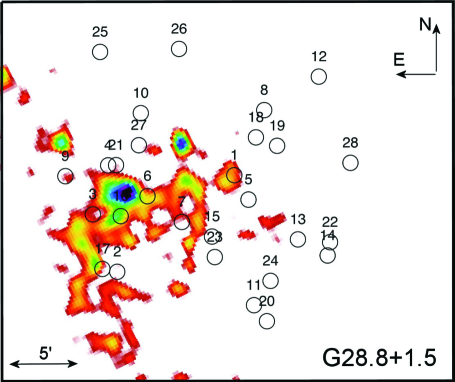
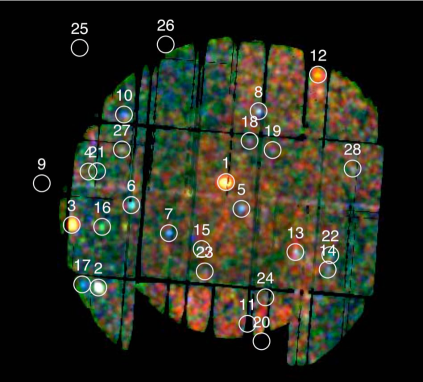
Figure 1 shows the radio images of the two SNRs, and the broad band (0.2–12.0 keV) images of both fields, combining PN, MOS1, and MOS2 data. The detected X-ray sources are shown as circles in each field. The top left panel shows the VLA (1.4 GHz) image of G27.8+0.6. Its bright central region is clearly visible as well as a larger () faint extended component. The fainter extended component is also seen at lower frequencies in the single-dish radio observations (Reich et al., 1984). The bottom left panel shows the region of G28.8+1.5 observed by VLA at 0.325 GHz. Both VLA images are extracted from MAGPIS (White et al., 2005). Sources 3 (in G27.8+0.6) and 6 (in G28.8+1.5) appear to be well centered within the bright radio emission regions (see also Section 3).
Since the XMM-Newton observations of the G27.8+0.6 and G28.8+1.5 are very short, the small number of accumulated counts limits spectral analysis, even for the brightest sources. However, the hardness ratios suggest that we detected different source populations: the sources exhibiting intrinsically hard spectra (e.g HR), and several extremely soft sources with most of the X-ray emission below 0.5 keV (e.g HR).
2.2 Cross-correlation and classification of X-ray sources
We cross-correlated all the X-ray sources listed in Tables 3 and 5 with the USNO-B1, 2MASS, and NVSS catalogs.
We found USNO-B1 counterpart candidates for each of the 28 X-ray sources detected in the G28.0+1.5 field, and all except two sources (src. #1 and #7) in the field of G27.8+0.6. Although we find most of the candidate optical counterparts within the positional uncertainty of the X-ray source444All the optical candidate counterparts are within the of the X-ray positional error., there is a high probability of a chance coincidence, due to a broad PSFs of the XMM-Newton detectors and a high density of stars in the Galactic plane.
Based on the optical source density ( and field sources in a box in the field of G27.8+0.6 and G27.8+1.5, respectively), we calculate the probabability555We estimate it as the probability of finding zero field sources in the circle of radius , , where is the distance between the optical and X-ray positions. that each listed optical source is the true counterpart (Tables 4 and 6).
To classify the sources we also used the X-ray-to-optical flux ratio calculated as , following Maccacaro et al. (1988). In this formula is measured in the first four bands (0.2–4.5 keV) because the source classification scheme of Maccacaro et al. (1988) is based on the relatively soft X-ray band (0.3–3.5 keV) of the Einstein Observatory. We used the average of the B2 and R2 USNO magnitudes instead of (mostly unavailable) V magnitudes, but the difference between these magnitudes for the main sequence stars should be less than (2000asqu.book.....C). We have verified this for several stars in our catalogs, for which the USNO and the position of the optical source with the cataloged V magnitude are sufficiently close (i.e., the three magnitudes are most likely measured from the same source). However, the difference between the averaged USNO and V magnitudes for sources classified as AGN/CVs seems to be slightly larger (up to 0.5) but still not large enough to change our source classifications.
The cross-correlation with the 2MASS catalog yielded 9 and 23 candidate counterparts for the G27.8+0.6 and G28.8+1.5 field, respectively. We found only one radio counterpart – the 3.6-mJy NVSS source 183932–023919 – coinciding with the X-ray source #27 from the G28.8+1.5 field.
We used the multi-wavelength data to classify the cataloged sources. In particular, we used the X-ray hardness ratios and optical and NIR properties to identify main-sequence stars and other source classes in our sample. Main-sequence stars are expected to have significantly smaller values of log(). Depending on the stellar type, the log() for stars is in the range –5 to –0.5, while galaxies, AGNs, X-ray binaries (XRB) and cataclysmic variables (CVs) are expected to have significantly stronger X-ray emission comparing to optical (e.g., for AGNs; Maccacaro et al., 1988). We also used NIR colors, in addition to the optical data, to confirm the stellar classifications (e.g., see Table 6 in Finlator et al., 2000). We used these selection criteria and tentatively classified the majority of the detected sources in both SNR fields.
2.2.1 Sources in the G27.8+0.6 field
In the field of SNR G27.8+0.6 we classified 8 sources as main sequence stars (Table 4) based on their log( and relatively soft X-ray spectra. The NIR colors support the proposed spectral classification, suggesting that the majority of these objects are nearby stars.
There is an optical counterpart candidate within the error circle of source #3. Although the X-ray-to-optical ratio suggests a stellar classification, the distance between the optical and X-ray position is almost 6′′, making the chance coincidence very likely (see Table 4). In addition, the X-ray spectrum of this source is significantly harder than the typical stellar spectra. We identified a 2MASS source closer to the X-ray position (off by 2′′), which suggests that the source is either an AGN, CV or a faint X-ray binary.
We note that the probability of a chance coincidence between the source #8 and its possible optical counterpart is also very high (about 40%). However, this source, which exhibits a soft X-ray spectrum, is detected at a large offset from the center of the field of view, which reduces the accuracy of the X-ray position.
Two sources (src. #1 and #7), which display relatively hard X-ray spectra in comparison with identified field stars, do not have any cataloged optical or infrared counterparts. While one of these objects (src. #7) is detected as a weak X-ray source (, see Table 3), source #1 is the brightest source in the field. Furthermore, the morphology and spectral properties of this source suggest that this object could be a NS created in the explosion of G27.8+0.6 and moving away from its birth site. We discuss this source in more detail in Section 3.
2.2.2 Sources in the G28.8+1.5 field
All of the 28 sources detected in the G28.8+1.5 field have optical candidate counterparts within the X-ray error circle. Based on the X-ray, optical and NIR data, we classified 11 sources as stars, while 3 objects are stars or galaxies, according to their NIR colors. The remaining 14 sources have significantly larger X-ray-to-optical flux ratios and harder X-ray spectra. The surface number density of these hard sources is approximately the same as that of the background extragalactic sources (Ebisawa et al., 2005), suggesting that most of them are AGNs, although some of them might be either faint X-ray binaries, or, more likely, cataclysmic variables, which are considered to be prime candidates for faint Galactic hard X-ray sources (e.g., Ebisawa et al., 2005, and references therein).
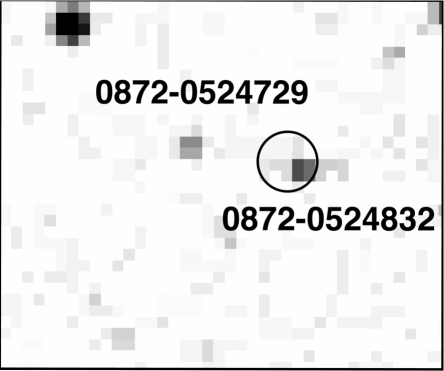
With approximately 400 accumulated counts in the PN data, source #1 (Table 5) is the only source in the field of G28.8+1.5 sufficiently bright for spectral analysis. We found the best fit model for this source to be an absorbed MEKAL ( keV) plus a hard component represented by a power-law model (). The low value of the absorption column (below cm-2) indicates that the source is much closer than the SNR. We found that the flux obtained from the spectral fit, ergs cm-2 s-1 (0.212 keV), is slightly lower than the cataloged value (which assumes a PL model with a significantly larger absorption column). We also obtained an acceptable fit for this source using a two-temperature plasma model ( and keV), typical of active late-type stars (e.g., Güdel, 2004), but could not find an acceptable fit for a single-component or any combination of the power-law or blackbody models. However, as Figure 2 indicates, there are probably two X-ray sources (most likely stars) at this position, which are difficult to resolve with XMM-Newton.
3 PWN/NS candidates
3.1 A PWN candidate in G27.8+0.6
No extended diffuse X-ray emission coming from the SNR shell or its central regions is visible in the EPIC images of G27.8+0.6. This is not surprising because after filtering the data affected by flaring the remaining good-time exposure was only about 4.9 ks for PN, 10 ks for MOS1, and 8.4 ks for MOS2 (Table 1), making it very difficult to detect any faint, large-scale emission above the background.
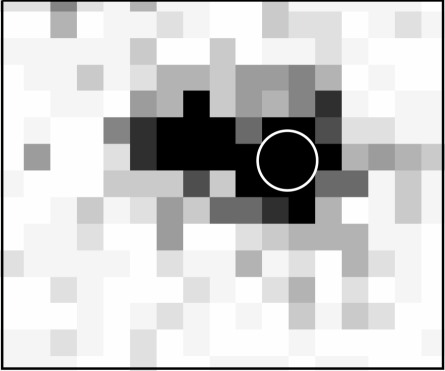
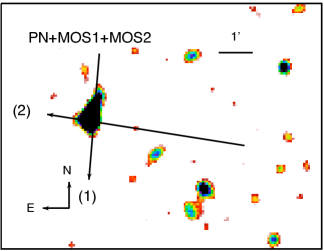
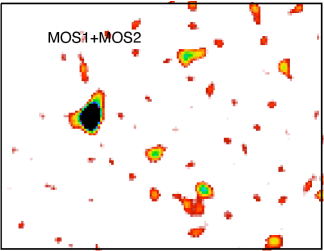
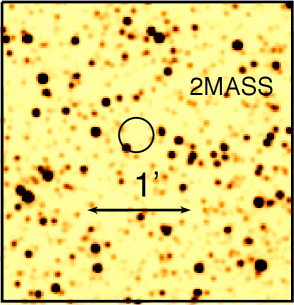
However, we have detected a bright, possibly extended source offset by 20′ (or 12 pc at the SNR’s distance of 2–3 kpc) from the presumed SNR’s center (Figure 3). Although the source was not flagged as extended in our source detection procedures, the smoothed (Figure 3) and binned (Figure 4) images suggest that there is a small elongation in the North direction and perhaps some weak emission to the East from the point source. Although the number of accumulated counts is small (see Table 3) because of the short exposures, the extended structures are clearly visible, not only in the combined data but also in individual PN and MOS images. We note that there is a CCD gap and a bad column across the source in the PN data, which cuts off a significant fraction of the point source, and perhaps also a part of the candidate nebula666We have excluded all border pixels from these images (by selecting FLAG=0), to make sure that no artificial structures are produced in the vicinity of the source.. Since the source is detected 10′ off-axis, the EPIC PSFs are elongated in the North-South direction. However, the entire source extent is not likely to be due to the PSF distortion777For example, compare with the PSF of source 2 in the G28.6+1.5 field, which, at approximately the same off-axis angle, is less elongated. . In addition to possible extended emission in the vicinity of the point source, there are several relatively bright blobs visible in the Southwest and Northwest directions, forming a triangular-like shape with the point source at the vertex. These blobs (with a signal to noise of 3–4, estimated in an aperture of in the 0.7–10 keV, measuring the background from the nearby area) might be part of extended emission at a distance of from the source. Figure 4 (right) shows a NIR (2MASS) image of the same region with no optical counterpart at the position of the X-ray source. We have searched optical catalogs and found no sources within 15′′ radius with (and down to the limiting magnitude of the USNO-B1 catalog, ; Monet et al., 2003).
To determine the spectral properties of our PSR candidate, we extracted the source spectra from the PN and MOS data and group them with a minimum of 10 counts per bin. However, the small number of the accumulated photons (60 in PN and slightly more in MOS1+MOS2 after subtracting the background) in our short-exposure observations, and a large (50%) background contribution, did not allow us to constrain well the fitting parameters.
We have obtained an acceptable fit () for an absorbed power-law model with the photon index and the hydrogen column density cm-2, consistent with the Hi value from Dickey & Lockman (1990). Using this model, we estimated the source flux to be about888this a factor of 2 below the flux listed in Table 3 due to using different model parameters erg s-1cm-2 in the 1.5–10 keV band, implying a luminosity range of erg s-1 for an assumed distance of 2–3 kpc.
The right panel of Figure 3 shows the radio map of G27.8+0.6 and the position of the PWN candidate with respect to the SNR center. The two arrows (also shown in the EPIC image on the left) indicate two possible velocity directions of the pulsar candidate, based on the PWN shape. If the blobs extending westwards are part of a “tail” formed by a bow-shock, due to the pulsar’s supersonic velocity, then, according to the existing MHD models (e.g., Bucciantini et al., 2005), the pulsar travels in the direction of the arrow marked 2, i.e., away from the center of the brightest part of the extended radio emission, which probably coincides with the site of the SN explosion. The extended emission to the North could be then explained as equatorial emission (a torus; Weisskopf et al., 2000). However, we cannot exclude the possibility that the pulsar candidate is moving in the direction of arrow 1 (i.e., the “tail” extends to the North, and the blobs are not associated with the PWN candidate). Although, in this case, the pulsar’s velocity would be nearly perpendicular to the expected radial direction, similar behavior was also observed in other SNR-PWN systems and explained by a high initial velocity of the NS progenitor, which caused the SN explosion offset from the center of the wind-blown cavity and the remnant’s geometric center (e.g., similar to the PWN in the IC443; Gaensler et al., 2006).
We conclude that the lack of the optical counterpart, the X-ray spectral properties and possible extended emission surrounding the source are all consistent with the proposed PWN identification. If the nebula was formed by the central pulsar associated with G27.8+0.6, its velocity999The velocity is estimated from the remnant’s age and the traveled distance of 12 pc if the pulsar’s birth place is at the SNR center. of around 100–300 km s-1 would be consistent with measured velocities of other pulsars. In addition, its position close to the host SNR edge, suggests that perhaps the pulsar’s velocity is at the transition from being subsonic in the SNR interior to supersonic outside the SNR. According to the current models (van der Swaluw, 2005, and references therein), the pulsar’s velocity becomes supersonic with respect to the ambient gas when the pulsar approaches the regions of cooler material near the edge of the shocked ejecta (for a SNR in the Sedov phase this occurs at the of the distance from the SNR’s center). In this evolutionary stage, there are two PWN components: in addition to the X-ray bright PWN enveloping the moving pulsar, there is also a relic PWN (center-filled radio plerion) formed in the supersonic SNR expansion stage and still emitting synchrotron radiation at radio frequencies, with significantly longer lifetimes. Although our X-ray and radio data seem to be entirely consistent with this picture, further observations are needed to confirm that the source is extended and to study its X-ray morphology in detail.
Finally, we note that we cannot entirely rule out the possibility that source #3 is a NS associated with G27.8+0.6. This source is located close to the center of the plerionic radio emission and its candidate optical/NIR counterparts are 6′′/2′′ away (see Section 2.2). However, even in this case, source #1 would remain a PWN candidate without a radio SNR association, which is a rather common occurrence (e.g., see Kargaltsev & Pavlov, 2008).
3.2 Supernova remnant G28.8+1.5
The bottom right panel of Figure 1 shows an amorphous region (10′ in diameter) of extended X-ray emission around the central part of SNR G28.8+1.5. Although faint, the diffuse emission has apparently a soft spectrum (suggesting a thermal plasma) as it can be seen in the exposure-corrected101010To produce the exposure-corrected images, we used the exposure maps corrected for vignetting. color-coded EPIC image (Figure 5, right). The comparison with the radio map (Figure 5, left) shows that the X-ray emission comes from the region inside the bright rim of radio emission (i.e., perhaps part of the radio shell). In addition to shell-type, center-filled and composite (a combination of shell and center-filled morphology) SNRs, there is around 8% of SNRs with radio shells filled with thermal X-ray emission, called mixed-morphology SNRs (Rho & Petre, 1998). Although the mechanism of the central thermal X-ray emission is not well understood, almost all of the mixed-morphology SNRs appear to be interacting with clouds (e.g., Koo et al., 2001). While the XMM-Newton data suggest that G28.8+1.5 might be a mixed-morphology SNR, high spatial resolution observations are needed to see whether this emission can be resolved into possible point sources and truly diffuse emission coming from the SNR, and measure its spectrum.
There are two point X-ray sources close to the center of the diffuse emission, source #1, which we identified as a star (or, more likely, a pair of unresolved stars), and source #5, whose optical and infrared counterparts suggest an AGN classification. However, due to the broad PSF of the EPIC cameras, a Chandra observation would be needed to confirm some of these identifications. In particular, we note that several sources (most of which are identified as AGNs) have large offsets from their candidate optical counterparts (e.g., sources #6, 8, 9, 17, 18, 21, 22; see Table 6), which put their identifications into question. Among these sources, particular attention deserves source #6, which coincides with the brightest radio emission region that could be a radio PWN.
4 Conclusions
We analyzed XMM-Newton observations of two center-filled SNRs, G27.8+0.6 and G28.8+1.5, in a search for their central pulsars/PWNe and/or other types of NSs associated with these SNRs. We compiled the X-ray source catalogs, measured the fluxes and hardness ratios, and also searched for cataloged optical, infrared and radio counterparts, which we used to classify these objects.
We found that most of the detected sources in both fields are foreground stars. The proposed classification of these sources is based on hardness of their X-ray spectra and optical and infrared properties of their candidate counterparts in the USNO-B1 and 2MASS catalogs. The remaining sources are classified as AGNs (perhaps also including several galaxies and CVs), although the separations between the X-ray and optical/infrared positions for these objects are significantly larger. Hence, some of the proposed optical counterparts may be coincidental (e.g., some of these sources might be NSs).
We identified one possibly extended source (Src. #1 in G27.8+0.6) as a PWN candidate associated with G27.8+0.6. This bright source does not have an optical counterpart and its morphology and X-ray spectrum seem to be consistent with the proposed PWN classification. The position of the PWN candidate with respect to its host SNR suggests a possible scenario: the alleged pulsar is moving away from the SNR center with a velocity of 200300 km s-1, and its position is near the edge of the shocked ejecta, approaching the cooler regions of the ambient material. At this stage the pulsar’s velocity becomes supersonic, and a bow-shock nebula is being formed. A high-resolution timing observation is needed to search for pulsations from this source.
Source #3 in G27.8+0.6 and source #6 in G28.8+1.5 could also be NSs associated with the SNRs, based on their locations within the regions of brightest radio emission (radio plerions) combined with relatively low probability of optical/NIR associations.
We also detected faint extended emission around the central region of G28.8+1.5 (apparently inside its partial radio shell). If this emission is associated with G28.8+1.5, it would put this source in a rare class of mixed-morphology SNR.
(http://www.nofs.navy.mil/data/ fchpix/).
| SNR | Obs. ID. | Date | Coordinates | EPIC PN | EPIC MOS1 | EPIC MOS2 | |
|---|---|---|---|---|---|---|---|
| RA/DEC (J2000) | Ta (Tb) | Ta (Tb) | Ta (Tb) | ||||
| G27.8+0.6 | 0301880401 | 2005-10-04 | 18:39:49.9 | -04:24:00 | 4.93 (8.53) | 10.16 (10.16) | 8.36 (10.16) |
| G28.8+1.5 | 0301880901 | 2005-10-04 | 18:39:04.9 | -02:43:44 | 14.03 (14.93) | 16.38 (16.56) | 16.56 (16.56) |
exposure time in units of ks after background screening
total exposure time in units of ks
| Detector | B1 | B2 | B3 | B4 | B5 |
|---|---|---|---|---|---|
| ( erg cm-2 ct-1) | |||||
| PN | 1.56 | 2.07 | 3.36 | 8.76 | 28.31 |
| MOS | 6.22 | 6.44 | 8.19 | 19.88 | 94.95 |
| Src | Position | Err | LoD | Cts | Flux | Soft fr. | HR | ||||
|---|---|---|---|---|---|---|---|---|---|---|---|
| J2000 | arcsec | erg s-1cm-2 | |||||||||
| 1 | 18:40:37.49, -04:17:36.7 | 1.7 | 482.8 | 340 20 | 2.07 0.17E-12 | 0.16 | 0.77 0.16 | ||||
| 2 | 18:40:10.97, -04:24:42.8 | 2.2 | 37.3 | 50 9 | 4.78 2.99E-14 | 0.70 | -1.00 0.16 | ||||
| 3 | 18:39:47.50, -04:21:25.0 | 2.1 | 26.2 | 57 10 | 9.96 2.18E-14 | 0.20 | 0.98 0.19 | ||||
| 4 | 18:39:54.95, -04:15:24.0 | 2.5 | 17.9 | 40 9 | 1.81 1.03E-14 | 1 | -1.00 0.23 | ||||
| 5 | 18:39:27.30, -04:18:50.0 | 2.2 | 23.0 | 47 10 | 1.59 1.45E-14 | 0.93 | -1.00 0.17 | ||||
| 6 | 18:39:24.20, -04:18:52.8 | 3.0 | 10.6 | 39 9 | 2.28 1.23E-14 | 0.67 | -0.65 0.48 | ||||
| 7 | 18:39:56.74, -04:15:14.1 | 2.4 | 12.8 | 39 9 | 2.78 1.49E-14 | 0.80 | -0.26 0.16 | ||||
| 8 | 18:39:11.97, -04:29:02.0 | 2.7 | 9.1 | 31 8 | 1.18 0.85E-13 | 0.10 | 0.002 0.001 | ||||
| 9 | 18:40:14.58, -04:16:06.2 | 2.4 | 12.2 | 40 9 | 6.69 2.99E-14 | 0.32 | -0.08 0.04 | ||||
| 10 | 18:39:29.07, -04:21:48.1 | 3.1 | 8.3 | 28 8 | 1.51 1.10E-14 | 1 | -1.00 0.25 | ||||
| 11 | 18:40:09.32, -04:09:33.4 | 2.9 | 7.4 | 27 7 | 2.68 2.51E-14 | 0.48 | -0.62 0.60 |
| Src ID | USNO/2MASSa | Distb | Class | Probc | |
|---|---|---|---|---|---|
| arcsec | |||||
| 1 | PWN? | ||||
| 2 | 0855-0384773/18401094-0424451 | 2.5/2.4 | -3.7 | star | 0.85/0.86 |
| 3 | 0856-0387120/18394759-0421233 | 5.7/2.2 | -1.7 | AGN/CV | 0.44/0.88 |
| 4 | 0857-0385700/18395497-0415237 | 0.6/0.4 | -1.7 | star | 0.99/0.99 |
| 5 | 0856-0386213/18392730-0418533 | 1.8/3.3 | -1.7 | star | 0.92/0.76 |
| 6 | 0856-0386032/18392418-0418497 | 3.5/3.1 | -1.6 | star | 0.73/0.78 |
| 7 | |||||
| 8 | 0855-0381458/18391172-0429001 | 4.6/4.1 | -2.4 | star | 0.59/0.65 |
| 9 | 0857-0386237/18401436-0416068 | 3.3/3.3 | -1.3 | star | 0.76/0.76 |
| 10 | 0856-0386293/18392887-0421468 | 3.4/3.1 | -2.0 | star | 0.75/0.78 |
| 11 | 0858-0387113/18400912-0409349 | 1.7/3.4 | -2.4 | star | 0.93/0.75 |
a the closest optical(USNO)/NIR(2MASS) source within the 3
error circle of the X-ray position
b the distance between the USNO/2MASS and the X-ray position
c the probability that the optical/NIR source is the true counterpart
| Src | Position | Err | LoD | Cts | Flux | Soft fr. | HR | |||
|---|---|---|---|---|---|---|---|---|---|---|
| J2000 | arcsec | erg s-1cm-2 | ||||||||
| 1 | 18:39:03.041, -02:42:01.94 | 1.5 | 1820.0 | 1389 49 | 1.72 0.09E-13 | 0.88 | -0.91 0.18 | |||
| 2 | 18:39:39.844, -02:49:35.62 | 1.6 | 579.6 | 417 22 | 2.05 0.28E-13 | 0.65 | -0.31 0.04 | |||
| 3 | 18:39:47.509, -02:45:05.47 | 1.6 | 592.7 | 417 22 | 1.84 0.38E-13 | 0.52 | -0.79 0.24 | |||
| 4 | 18:39:42.684, -02:41:15.97 | 1.8 | 190.8 | 109 12 | 2.61 1.82E-14 | 0.84 | -1.0 0.1 | |||
| 5 | 18:38:58.595, -02:43:56.28 | 1.7 | 166.8 | 206 17 | 1.23 0.14E-13 | 0.29 | 0.48 0.1 | |||
| 6 | 18:39:30.338, -02:43:40.26 | 1.7 | 149.1 | 208 22 | 1.03 0.21E-13 | 0.62 | -0.14 0.03 | |||
| 7 | 18:39:19.516, -02:45:41.11 | 1.7 | 148.4 | 173 16 | 1.06 0.15E-13 | 0.37 | 0.52 0.12 | |||
| 8 | 18:38:53.640, -02:36:55.80 | 1.8 | 83.0 | 134 15 | 1.46 0.24E-13 | 0.22 | 0.31 0.07 | |||
| 9 | 18:39:56.135, -02:42:06.84 | 2.0 | 91.1 | 129 16 | 2.54 0.61E-13 | 0.25 | 0.41 0.12 | |||
| 10 | 18:39:32.438, -02:37:10.31 | 1.9 | 50.5 | 94 13 | 2.08 0.37E-13 | 0.14 | 0.84 0.56 | |||
| 11 | 18:38:56.855, -02:52:12.36 | 2.0 | 40.4 | 90 15 | 1.67 0.38E-13 | 0.22 | 0.46 0.21 | |||
| 12 | 18:38:36.507, -02:34:18.19 | 1.9 | 45.2 | 91 12 | 2.13 0.98E-14 | 1 | -1.0 0.17 | |||
| 13 | 18:38:43.052, -02:47:02.80 | 1.9 | 50.6 | 108 16 | 6.74 1.69E-14 | 0.36 | 0.26 0.08 | |||
| 14 | 18:38:33.725, -02:48:18.47 | 2.2 | 21.7 | 73 13 | 6.62 2.14E-14 | 0.25 | 0.30 0.12 | |||
| 15 | 18:39:10.057, -02:46:49.66 | 2.0 | 22.6 | 72 13 | 1.98 0.76E-14 | 0.52 | -0.02 0.01 | |||
| 16 | 18:39:38.748, -02:45:13.75 | 2.1 | 28.2 | 61 11 | 1.55 1.06E-14 | 1 | -1.0 0.17 | |||
| 17 | 18:39:44.507, -02:49:22.19 | 2.4 | 18.6 | 60 11 | 8.04 2.87E-14 | 0.38 | 0.53 0.26 | |||
| 18 | 18:38:56.257, -02:39:04.03 | 2.1 | 21.1 | 67 13 | 5.12 1.50E-14 | 0.25 | 0.43 0.20 | |||
| 19 | 18:38:49.592, -02:39:43.74 | 2.0 | 23.0 | 73 13 | 7.02 1.63E-14 | 0.16 | 0.46 0.21 | |||
| 20 | 18:38:52.798, -02:53:27.74 | 2.1 | 19.0 | 54 10 | 1.87 1.13E-14 | 0.77 | -0.85 0.17 | |||
| 21 | 18:39:40.212, -02:41:14.89 | 2.0 | 24.0 | 41 10 | 1.60 2.19E-14 | 0.30 | -0.51 0.43 | |||
| 22 | 18:38:32.954, -02:47:15.94 | 2.0 | 21.4 | 55 11 | 2.55 1.31E-14 | 0.70 | 0.02 0.01 | |||
| 23 | 18:39:09.179, -02:48:26.14 | 2.3 | 17.4 | 64 12 | 4.89 1.31E-14 | 0.23 | 0.29 0.11 | |||
| 24 | 18:38:51.662, -02:50:17.99 | 2.4 | 13.5 | 39 10 | 6.55 1.89E-14 | 0.14 | 0.66 0.62 | |||
| 25 | 18:39:45.213, -02:32:22.42 | 3.3 | 8.8 | 35 12 | 1.34 1.10E-13 | 0.30 | -0.06 0.04 | |||
| 26 | 18:39:20.415, -02:32:08.09 | 2.4 | 12.6 | 46 11 | 4.43 2.46E-14 | 0.46 | 0.42 0.23 | |||
| 27 | 18:39:33.050, -02:39:41.15 | 2.1 | 14.4 | 59 12 | 2.67 1.25E-14 | 0.46 | -0.06 0.03 | |||
| 28 | 18:38:26.545, -02:41:03.59 | 2.2 | 14.0 | 56 12 | 2.42 1.44E-14 | 0.28 | 0.09 0.04 |
| Src | USNO/2MASSa | Distb | Class | Probc | |
|---|---|---|---|---|---|
| arcsec | |||||
| 1 | 0872-0524632/18390292-0242033 | 3.4/2.2 | -0.9 | star | 0.76/0.89 |
| 2 | 0871-0519069/18393984-0249372 | 1.0/1.6 | -0.8 | star | 0.98/0.94 |
| 3 | 0872-0528442/18394750-0245056 | 1.0/0.2 | -2.1 | star | 0.98/0.99 |
| 4 | 0873-0529676/ | 0.3/ | -0.8 | star | 0.99/ |
| 5 | 0872-0524304/18385867-0243556 | 2.9/1.3 | -0.5 | AGN/CV | 0.82/0.96 |
| 6 | 0872-0526884/18393041-0243446 | 5.6/4.5 | -0.2 | AGN/CV | 0.47/0.61 |
| 7 | 0872-0525933/18391953-0245476 | 2.8/6.6 | -0.9 | AGN/CV | 0.83/0.35 |
| 8 | 0873-0525927/18385353-0237012 | 4.8/5.7 | -1.2 | AGN/CV | 0.57/0.45 |
| 9 | 0872-0529117/18395631-0242087 | 4.2/3.3 | -1.2 | AGN/CV | 0.65/0.77 |
| 10 | 0873-0528766/18393230-0237074 | 3.6/3.5 | -1.1 | AGN/CV | 0.73/0.74 |
| 11 | 0871-0515153/18385665-0252137 | 2.8/3.2 | -1.2 | AGN/CV | 0.83/0.78 |
| 12 | 0874-0529861/18383663-0234189 | 1.8/2.1 | -3.8 | star | 0.92/0.90 |
| 13 | 0872-0523159/18384311-0247016 | 0.5/1.5 | -1.3 | star or GAL | 0.99/0.95 |
| 14 | 0871-0513364/18383390-0248209 | 3.4/3.7 | 0.0 | AGN/CV | 0.76/0.72 |
| 15 | 0872-0525201/18390987-0246532 | 1.6/4.5 | -1.5 | star | 0.94/0.61 |
| 16 | 0872-0527751/18393871-0245156 | 1.0/2.0 | -1.7 | star | 0.98/0.91 |
| 17 | 0871-0519498/18394421-0249239 | 5.0/4.7 | -0.8 | AGN/CV | 0.55/0.59 |
| 18 | 0873-0526103/18385657-0239038 | 4.7/4.8 | -0.8 | AGN/CV | 0.59/0.57 |
| 19 | 0873-0525656/ | 3.9/ | -1.3 | AGN/CV | 0.69/ |
| 20 | 0871-0514833/18385276-0253274 | 0.5/0.5 | -1.4 | star | 0.99/0.99 |
| 21 | 0873-0529499/18394054-0241153 | 4.4/5.0 | -2.5 | star | 0.63/0.55 |
| 22 | 0872-0522454/ | 5.6/ | -0.7 | AGN/CV | 0.47/ |
| 23 | 0871-0516197/18390912-0248290 | 0.3/3.0 | -2.0 | star or GAL | 0.99/0.80 |
| 24 | 0871-0514762/18385212-0250137 | 2.0/8.1 | -1.4 | AGN/CV | 0.91/0.20 |
| 25 | 0874-0534435/18394499-0232148 | 2.0/8.2 | -0.6 | star | 0.91/0.20 |
| 26 | 0874-0532767/18392034-0232082 | 1.3/1.1 | -0.9 | AGN/CV | 0.96/0.97 |
| 27 | 0873-0528856/18393299-0239382 | 2.1/3.0 | -1.0 | star | 0.90/0.80 |
| 28 | 0873-0524047/18382638-0241016 | 3.2/3.0 | -1.6 | star or GAL | 0.78/0.80 |
a the closest optical(USNO)/NIR(2MASS) source within the 3
error circle of the X-ray position
b the distance between the USNO/2MASS and the X-ray position
c the probability that the optical/NIR source is the true counterpart
References
- Bucciantini et al. (2005) Bucciantini, N., Amato, E., & Del Zanna, L. 2005, A&A, 434, 189
- Condon et al. (1998) Condon, J. J., Cotton, W. D., Greisen, E. W., Yin, Q. F., Perley, R. A., Taylor, G. B., & Broderick, J. J. 1998, AJ, 115, 1693
- Dickey & Lockman (1990) Dickey, J. M., & Lockman, F. J. 1990, ARA&A, 28, 215
- Ebisawa et al. (2005) Ebisawa, K., et al. 2005, ApJ, 635, 214
- Finlator et al. (2000) Finlator, K., et al. 2000, AJ, 120, 2615
- Gaensler et al. (2006) Gaensler, B. M., Chatterjee, S., Slane, P. O., van der Swaluw, E., Camilo, F., & Hughes, J. P. 2006, ApJ, 648, 1037
- Gaensler & Slane (2006) Gaensler, B. M., & Slane, P. O. 2006, ARA&A, 44, 17
- Güdel (2004) Güdel, M. 2004, A&A Rev., 12, 71
- Halpern & Gotthelf (2010) Halpern, J. P., & Gotthelf, E. V. 2010, ApJ, 709, 436
- Kaplan et al. (2004) Kaplan, D. L., Frail, D. A., Gaensler, B. M., Gotthelf, E. V., Kulkarni, S. R., Slane, P. O., & Nechita, A. 2004, ApJS, 153, 269
- Kaplan et al. (2006) Kaplan, D. L., Gaensler, B. M., Kulkarni, S. R., & Slane, P. O. 2006, ApJS, 163, 344
- Kargaltsev & Pavlov (2008) Kargaltsev, O., & Pavlov, G. G. 2008, in American Institute of Physics Conference Series, Vol. 983, 40 Years of Pulsars: Millisecond Pulsars, Magnetars and More, ed. C. Bassa, Z. Wang, A. Cumming, & V. M. Kaspi
- Kaspi et al. (2002) Kaspi, V. M., Gotthelf, E. V., Gaensler, B. M., & Lyutikov, M. 2002, in Astronomical Society of the Pacific Conference Series, Vol. 271, Neutron Stars in Supernova Remnants, ed. P. O. Slane & B. M. Gaensler, 233
- Kaspi & Helfand (2002) Kaspi, V. M., & Helfand, D. J. 2002, in Astronomical Society of the Pacific Conference Series, Vol. 271, Neutron Stars in Supernova Remnants, ed. P. O. Slane & B. M. Gaensler, 3
- Koo et al. (2001) Koo, B.-C., Rho, J., Reach, W. T., Jung, J., & Mangum, J. G. 2001, ApJ, 552, 175
- Maccacaro et al. (1988) Maccacaro, T., Gioia, I. M., Wolter, A., Zamorani, G., & Stocke, J. T. 1988, ApJ, 326, 680
- Monet et al. (2003) Monet, D. G., et al. 2003, AJ, 125, 984
- Pavlov & Luna (2009) Pavlov, G. G., & Luna, G. J. M. 2009, ApJ, 703, 910
- Rees & Gunn (1974) Rees, M. J., & Gunn, J. E. 1974, MNRAS, 167, 1
- Reich et al. (1984) Reich, W., Furst, E., & Sofue, Y. 1984, A&A, 133, L4
- Rho & Petre (1998) Rho, J., & Petre, R. 1998, ApJ, 503, L167
- Schwentker (1994) Schwentker, O. 1994, A&A, 286, L47
- Shklovskii (1980) Shklovskii, I. S. 1980, PASP, 92, 125
- Skrutskie et al. (2006) Skrutskie, M. F., et al. 2006, AJ, 131, 1163
- Song et al. (2000) Song, L., Mihara, T., Matsuoka, M., Negoro, H., & Corbet, R. 2000, PASJ, 52, 181
- van der Swaluw (2005) van der Swaluw, E. 2005, Advances in Space Research, 35, 1123
- Watson et al. (2003) Watson, M. G., et al. 2003, Astronomische Nachrichten, 324, 89
- Weiler & Panagia (1980) Weiler, K. W., & Panagia, N. 1980, A&A, 90, 269
- Weisskopf et al. (2000) Weisskopf, M. C., et al. 2000, ApJ, 536, L81
- White et al. (2005) White, R. L., Becker, R. H., & Helfand, D. J. 2005, AJ, 130, 586