Supernova PTF 09uj: A possible shock breakout from a dense circumstellar wind
Abstract
Type-IIn supernovae (SNe), which are characterized by strong interaction of their ejecta with the surrounding circumstellar matter (CSM), provide a unique opportunity to study the mass-loss history of massive stars shortly before their explosive death. We present the discovery and follow-up observations of a Type IIn SN, PTF 09uj, detected by the Palomar Transient Factory (PTF). Serendipitous observations by GALEX at ultraviolet (UV) wavelengths detected the rise of the SN light curve prior to the PTF discovery. The UV light curve of the SN rose fast, with a time scale of a few days, to a UV absolute AB magnitude of about . Modeling our observations, we suggest that the fast rise of the UV light curve is due to the breakout of the SN shock through the dense CSM ( cm-3). Furthermore, we find that prior to the explosion the progenitor went through a phase of high mass-loss rate ( M⊙ yr-1) that lasted for a few years. The decay rate of this SN was fast relative to that of other SNe IIn.
Subject headings:
stars: mass-loss — supernovae: general — supernovae: individual (PTF 09uj)1. Introduction
Early ultraviolet (UV) detection of supernovae (SNe) of all types in the shock-breakout phase holds great potential for probing the nature and properties of SN progenitors (e.g., Colgate 1974; Falk & Arnett 1977; Klein & Chevalier 1978; Matzner & McKee 1999; Waxman et al. 2007; Katz, Budnik & Waxman 2010; Piro, Chang & Weinberg 2010; Rabinak & Waxman 2010; Nakar & Sari 2010). Shock-breakout observations provide a measure of the progenitor radius and the structure of its outer layers (e.g., Soderberg et al. 2008; Gezari et al. 2008; Schawinski et al. 2008).
Type IIn SNe are characterized by the presence of a blue continuum and narrow emission lines in their optical spectra (e.g., Schlegel 1990; Filippenko 1997). These features are usually interpreted as the signatures of interaction of the SN ejecta with dense circumstellar matter (CSM), due to stellar mass loss prior to the explosion. SNe IIn are probably an inhomogeneous class of objects whose main properties are dictated by the presence of dense CSM rather than by the details of the explosion. Therefore, SNe showing evidence for strong interaction are unique probes of scenarios in which a stellar explosion follows a major mass-loss event, and they can be used to study the mass-loss rate from progenitor stars (e.g., Chugai & Danziger 1994; Chugai et al. 1995; Fransson et al. 2002; Gal-Yam et al. 2007; Ofek et al. 2007; Smith et al. 2007; Smith & McCray 2007; Gal-Yam & Leonard 2009; Dessart et al. 2009).
Here we present the discovery of a Type IIn SN, PTF 09uj, which was serendipitously observed in the UV by GALEX (Martin et al. 2005) shortly after the explosion.
2. Observations and data Reduction
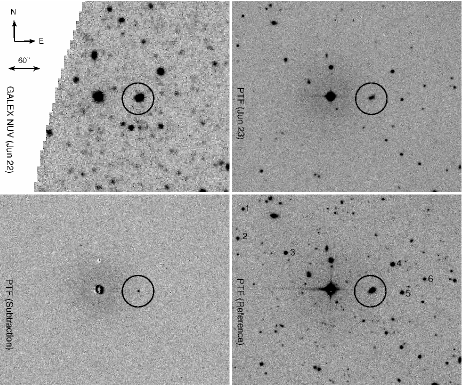
SN PTF 09uj was discovered on 2009 June 23.30 (UTC dates are used throughout this paper) by the Palomar Transient Factory111http://www.astro.caltech.edu/ptf/. (PTF; Law et al. 2009; Rau et al. 2009) conducted with the Oschin 48-inch Schmidt telescope (P48) at Palomar Observatory. The SN is associated with an mag galaxy, SDSS222Sloan Digital Sky Survey; York et al. (2000). J142010.86+533341.9 (Fig. 1) — a late-type disk galaxy at a redshift of (distance Mpc333We assume WMAP-5 cosmological parameters (Komatsu et al. 2008) and insignificant peculiar velocity.).
2.1. Photometry
Follow-up photometry was obtained using the automated Palomar 60-inch telescope (Cenko et al. 2006; Table 1). As noted above, this field was observed by GALEX on several occasions (Table 1).
Photometry of PTF 09uj in the PTF and P60 images was obtained by the common point-spread function image-subtraction method (Gal-Yam et al. 2004; Gal-Yam et al. 2008). Estimates of uncertainties were obtained from the scatter in the magnitudes of artificial sources. The photometry was calibrated using -band magnitudes of six SDSS stars (Fig. 1). Calibration errors were added in quadrature to the image-subtraction errors (Table 1).
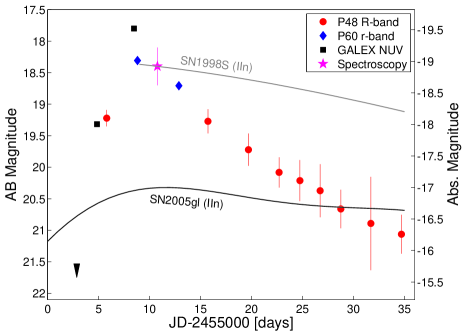
The GALEX photometry was carried out by performing aperture photometry with a radius around the SN host galaxy, and subtracting its light as measured in the reference image. The reference image was constructed by combining the four GALEX images of this field taken prior to the SN explosion, between 2009 May 4 and May 14. Since GALEX uses photon-counting detectors (i.e., individual photons are time tagged; Martin et al. 2005), we had the opportunity to look for flux variations on relatively short timescales. In particular, we examined the earliest image in which the SN was detected, which was taken on June 22 and had an exposure time of 1364 seconds. We extracted the time-tags of the 4597 photons found within of the SN and binned these photons on timescales from 3 to 1000s. We found no significant variations in flux as a function of time. We note that about of these photons originate from the SN and the rest are due to the host galaxy. The GALEX NUV and P48 -band light curves of PTF 09uj are presented in Figure 2.
| Telescope | UTC 2009 | band | Magnitude | |
|---|---|---|---|---|
| [AB mag] | [Jy] | |||
| P48 | Jun 02.3aaThe last P48 non-detection before the discovery. | bbAll of the P48 observations were conducted using the Mould -band filter. Photometry was measured in the combined images of the same field taken each night (usually two). | ||
| Jun 23.30 | ||||
| Jul 03.22 | ||||
| Jul 07.20 | ||||
| Jul 10.21 | ||||
| Jul 12.24 | ||||
| Jul 14.23 | ||||
| Jul 16.26 | ||||
| Jul 19.21 | ||||
| Jul 22.20 | ||||
| P60 | Jun 26.31 | |||
| Jun 26.31 | ||||
| Jun 26.31 | ||||
| Jun 30.38 | ||||
| Jun 30.38 | ||||
| Jun 30.38 | ||||
| GALEX | Jun 20.36 | |||
| Jun 22.35 | ||||
| Jun 25.98 | ||||
| LickccThe magnitude from Lick observatory is based on synthetic photometry of the spectrum using the code described by Poznanski et al. (2002). | Jun 28.27 | spec | ||
Note. — is calculated at 2316 Å, 4718 Å, 6184 Å, and 7499 Å for the , , PTF /, and bands, respectively. Magnitude uncertainties include (in quadrature) absolute calibration errors of 0.099 mag for the PTF -band measurements, and 0.071, 0.037, and 0.029 mag for the P60 , , and bands, respectively. An aperture correction of 0.12 mag was applied to the GALEX- magnitudes (Morrissey et al. 2007).
2.2. Spectroscopy
We observed PTF 09uj with an exposure time of 1800 s with the Kast double spectrograph (Miller & Stone 1993) mounted at the Cassegrain focus of the Shane 3-m telescope at Lick Observatory; the 5500 Å dichroic was employed. On the blue arm, we used the 600 lines mm-1 grism blazed at 4310 Å to provide spectral coverage of 3500–5550 Å and a dispersion of 1.02 Å pixel-1, while on the red arm we used the 300 lines mm-1 grating blazed at 7500 Å for a wavelength range of 5400–10000 Å and a dispersion of 4.60 Å pixel-1.
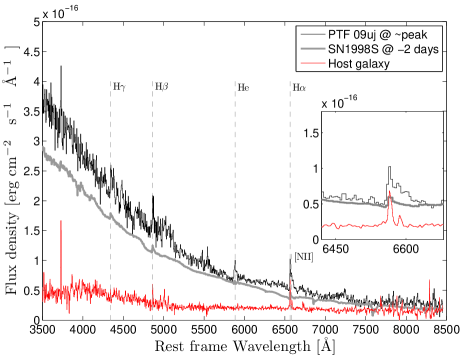
The Lick spectrum was reduced using standard routines in IRAF444IRAF is distributed by the National Optical Astronomy Observatory, which is operated by the Association for Research in Astronomy, Inc., under cooperative agreement with the National Science Foundation. (details provided by Cenko et al. 2008). Flux calibration was performed relative to the standard stars BD +28∘ 4211 (blue side) and BD +26∘ 2606 (red side). The Lick spectrum of PTF 09uj is shown in Figure 3. Given the lack of Na I absorption lines in the SN spectrum and the low Galactic extinction toward this SN ( mag; Schlegel et al. 1998), we do not correct for extinction.
3. Interpretation
The spectrum of PTF 09uj, which was taken around peak light, shows a blue continuum, with narrow H emission and no prominent, broad absorption features. This “narrow” line is actually broader than the H line from the host galaxy and shows a hint of a P-Cygni profile (Fig. 3 inset). The spectrum also exhibits a narrow He I emission line (measured rest wavelength 5884 Å, corresponding to He I 5876) which is not present in the host-galaxy spectrum. These observations suggest that PTF 09uj is a SN IIn enshrouded with a dense CSM.
However, the -folding decline rate of the SN flux is about 10 days. This is faster than the steepest declining SNe IIn previously known, such as SN 1998S (Fassia et al. 2000), SN 2005gl (Gal-Yam et al. 2007), and SN 2005ip (e.g., Smith et al. 2009); compare with the light curves of the first two in Figure 2.
Another possible difference between PTF 09uj and SN 1998S is the spectra. While the SNe spectra shown in Figure 3 were both taken around maximum light, PTF 09uj evolved faster and therefore these spectra probably do not correspond to the same epoch after explosion. In order to compare the spectra of the SNe taken at the same epoch after explosion it is probably more adequate to inspect the spectrum of SN 1998S taken days prior to maximum light (Fassia et al. 2001). This earlier spectrum of SN 1998S is different, with broader emission lines and strong “Wolf-Rayet”-like features (e.g., C III, N III).
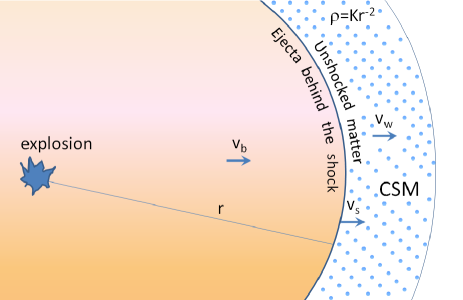
3.1. Shock Breakout in a Stellar Wind
The fast rise in UV light and the high peak luminosity ( erg s-1) motivates us to consider a model of a shock breakout which takes place within a dense, optically thick, stellar wind (see also Falk & Arnett 1977; Waxman et al. 2007). The blue continuum in the visible-light spectrum of PTF 09uj suggests that the emission is optically thick. Fitting a black-body curve to the , , , and -band photometry, obtained on June 25–26, we find a best-fit temperature of K (with r.m.s. of 0.13 magnitudes). We note that if line blanketing is effecting the spectrum, the true effective temperature could be even higher.
In the framework of the model considered here (see sketch in Fig. 4), the rising UV emission is due to a shock breakout within an optically thick wind. Some or most of the visible-light emission at later times is caused by diffusion of the shock-deposited energy.
We now calculate the properties of the shock and ejecta that are needed in order to explain the observations. In this calculation we use the observed peak luminosity and the rise time of the SN to calculate various parameters (i.e., mass, velocity, temperature).
The thickness of a radiation-mediated shock, , in units of the Thomson optical depth (e.g., Weaver 1976) is given by
| (1) |
Here is the speed of light and is the upstream ejecta (and shock) speed. A radiation-mediated shock “breaks down” or “breaks out” (i.e., radiation escapes ahead of the shock) when photons diffuse ahead of the shock faster than the shock propagates. For a wind-density profile where is a normalization constant and is distance from the center, the photon diffusion time from to is , independent of , while the shock propagation time is , growing with . Thus, the shock breaks down when it reaches . At this point, photons would diffuse and escape the wind on a time scale equal to multiplied by a log correction factor .
An alternative definition of the breakout radius is the radius at which the thickness of the shock is comparable to the scale height of the density variation. Since for a wind profile this scale is , with a corresponding optical depth , this happens at or , the same as obtained above. For small radii , the shock expansion time scale () is shorter than , and breakout takes place when . We further note that corresponds to the velocity of the faster parts of the shock. In §3.2 we will derive the ratio of this velocity to the bulk velocity of the ejecta ().
Assuming a radiation-dominated shock, the downstream temperature of the shock can be estimated by comparing the radiation energy density (assuming black-body radiation) with the kinetic energy per unit volume:
| (2) |
where is the radiation constant, is the time since the explosion, is the opacity, and is the density of the stellar wind at the shock breakout. Note that the right-hand side of Equation 2 is derived assuming a wind-density profile along with Equation 1 and . The factor of arises from the shock’s compression ratio , with an adiabatic index of . Here is the radius at which the shock breakout takes place.
In this framework, the kinetic energy of the explosion is converted into radiation at a rate of . Here we assume that the shock is optically thick and that the emission spectrum is roughly represented by a black-body spectrum. The assumption of black-body emission is justified, since for the shock velocity we infer, (see Eq. 4 below), there is no departure from thermal equilibrium. Such departure is expected only for higher velocity shocks, (Weaver 1976; Katz et al. 2010).
Based on Equation 1, and assuming we are observing at wavelength in the Rayleigh-Jeans tail,
| (3) |
where is the black-body total specific luminosity and is the Boltzmann constant.
By solving Equations 2 and 3, along with , we find that
| (4) |
where is the specific luminosity in units of erg s-1 Å-1 (equivalent to the luminosity measured on 2009 June 23, close to the first GALEX detection), is the wavelength at which the luminosity is measured in units of 6200 Å, is the opacity in units of 0.34 cm2 g-1 (assuming the opacity of completely ionized solar composition), and is the time between the explosion and the measurement of , in units of days. The distance from the star to the shell in which the breakout occurs is
| (5) |
This radius is larger than the size of a typical red supergiant, indicating that our assumption that the shock occurs “outside” the star, in a wind-density profile, is justified. The density is given by
| (6) |
where is the proton mass, and we also have
| (7) |
Here, is the effective temperature at the time in which we measured .
In addition, we can estimate the rise time of the SN light curve. In the case that the scale height of the material lying ahead of the shock is negligible compared with the radius at which the shock occurs (; i.e., shock takes place at the edge of the star), the rise time is (up to a log correction factor mentioned earlier). However, in the scenario discussed here there is a significant amount of material ahead of the shock and the rise time is day. This rise time is therefore slower than the rise time seen in some of the known shock breakout events (e.g., Gezari et al. 2008). In this scenario, after maximum light, the light curve is expected to decay exponentially on the diffusion time scale (; Falk & Arnett 1977), which in our case is about a week. This is similar to the observed decay rate.
The total mass in the fast ejecta within radius is . Here is the star radius. Assuming the wind density is and , we find
| (8) |
Note that the total mass in the ejecta may be larger (see §3.2), and therefore this equation provides only a lower limit to the mass. Next, the mass loss rate from the progenitor prior to the explosion is
| (9) |
where is the progenitor wind velocity in units of 100 km s-1. This mass-loss rate is required to persist for yr prior to the explosion.
Another important property is the kinetic energy in the faster parts of the shock, which is roughly given by
| (10) | |||||
| (11) |
As before the factor of arises from the shock’s compression ratio.
We note that if we relax the Rayleigh-Jeans approximation in Equation 3, and solve these equations using the full Planck formula, the solution does not change considerably555The values of , , , and are changed by a factor of ; is changed by a factor of ; by ; and and remain the same.. Therefore, for simplicity, we choose to show here the approximate solution.
Based on the temperature that we derive in Equation 7, the expected NUV luminosity is erg s-1 Å-1 (given by the Planck function multiplied by ). This is about times larger than observed. However, the UV emission may be affected by metal line blanketing, and is therefore less reliable than the visible-light luminosity.
Furthermore, we note that our assumption of a radiation-mediated shock is justified since in the case studied here the ratio of radiation energy density to plasma thermal energy density is very large, .
To summarize, based on our crude model we use the visible-light luminosity to derive the shock properties (e.g., , , , , ). The calculated is roughly consistent with the observed rise time of the UV light curve. Moreover, this model naturally explains the high observed luminosity in the NUV band.
3.2. The Bulk Velocity
The velocity we used so far corresponds to the faster parts of the ejecta. However, this does not necessarily represent most of the energy in the ejecta. As a sanity check, here we estimate the bulk velocity of the ejecta.
The shock that accelerates the ejecta gives more energy to slower shells. The energy as a function of velocity is given by
| (12) |
where is the bulk kinetic energy of the ejecta, is the bulk velocity, and , where (), (), for convective (radiative) envelopes666In the notation of Matzner & McKee (1999), , where . (Matzner & McKee 1999). A shell of velocity is decelerated when the energy in the shocked wind, , equals the energy in the decelerated shell, . Here and . Note that this includes the internal energy in the shocked wind (assuming the internal energy roughly equals the kinetic energy). This gives the deceleration radius
| (13) |
The wind optical depth at this radius is , or
| (14) |
As long as , the fast shell is decelerated and overtaken by the slower, more energetic, shells behind it. Breakout occurs when , which together with Equation 14 and assuming gives
| (15) |
where is the total mass in the ejecta. Since , the inferred value of is insensitive to the exact values of and , and to the unknown value of . Assuming M⊙, km s-1, and g cm-1 (corresponding to M⊙ yr-1 and km s-1), we get () for convective (radiative) envelopes.
This analysis suggests that Equations 4, 8, and 11 are reasonable approximations of the bulk properties of the ejecta. Specifically, if the total mass of the ejecta is an order of magnitude larger than that given by Equation 8, then the total kinetic energy of the SN will exceed erg, which is unlikely (at least for the garden variety of SNe).
4. Discussion
We present the discovery of PTF 09uj, which was serendipitously observed by GALEX at early times after the explosion. The spectrum of the SN and the bright UV signal suggest that this was a SN IIn powered by the diffusion of the shock energy and interaction of the ejecta with a dense CSM ( cm-3). This interpretation is consistent with both the fast rise of the UV light curve and the UV luminosity. The observed fast rise cannot be easily explained unless the progenitor is embedded in an optically thick wind. Moreover, a shock breakout from a stellar photosphere cannot generate such a bright UV signal (e.g., Rabinak & Waxman 2010).
Based on simple modeling, we suggest that prior to the explosion the progenitor went through a phase of high mass-loss rate, with M⊙ yr-1. The radius of the radiating region and the fast decay of the SN are suggestive of an episodic high mass-loss rate with a duration of about several years prior to the explosion. Our model suggests that the total mass of the ejecta is relatively low, roughly 1 M⊙. We stress that this is an order-of-magnitude estimate; the total ejected mass could be as high as a few solar masses, but probably not on the high end ( M⊙) of the ejected mass expected in typical SNe II.
The low ejecta mass, if true, may be due to one of the following: (i) most of the mass of the progenitor was not expelled by the SN explosion and it is in a form of a compact remnant; or (ii) most of the mass of the progenitor was expelled (e.g., wind) prior to the explosion. This is in contrast to more energetic SN explosions whose luminosity is powered by interaction with a dense CSM (e.g., Benetti et al. 2006; Ofek et al. 2007; Smith et al. 2007)
PTF is a wide and shallow survey in which about 3000 deg2 are actively surveyed at a given time down to a limiting magnitude of . GALEX sensitivity allows high signal-to-noise ratio detections of SN shock-breakout flashes at a redshift range which is similar to that probed by PTF. Specifically, we estimate that PTF should find several SNe each year for which GALEX early observations will be available. This estimate is based on the number of PTF SN discoveries, during 2009, which had GALEX serendipitous observations between 0 to 30 days prior to the PTF discovery.
References
- Benetti et al. (2006) Benetti, S., Cappellaro, E., Turatto, M., Taubenberger, S., Harutyunyan, A., & Valenti, S. 2006, ApJ, 653, L129
- Botticella et al. (2010) Botticella, M. T., et al. 2010, arXiv:1001.5427
- Cenko et al. (2006) Cenko, S. B., et al. 2006, PASP, 118, 1396
- Cenko et al. (2008) Cenko, S. B., et al. 2008, ApJ, 677, 441
- Chugai (1997) Chugai, N. N. 1997, Astronomy Reports, 41, 672
- Chugai & Danziger (1994) Chugai, N. N., & Danziger, I. J. 1994, MNRAS, 268, 173
- Chugai et al. (1995) Chugai, N. N., Danziger, I. J., & Della Valle, M. 1995, MNRAS, 276, 530
- Colgate (1974) Colgate, S. A. 1974, ApJ, 187, 333
- Dessart et al. (2009) Dessart, L., Hillier, D. J., Gezari, S., Basa, S., & Matheson, T. 2009, MNRAS, 394, 21
- Falk & Arnett (1977) Falk, S. W., & Arnett, W. D. 1977, A&AS, 33, 515
- Fassia et al. (2000) Fassia, A., et al. 2000, MNRAS, 318, 1093
- Fassia et al. (2001) Fassia, A., et al. 2001, MNRAS, 325, 907
- Filippenko (1997) Filippenko, A. V. 1997, ARA&A, 35, 309
- Fransson et al. (2002) Fransson, C., et al. 2002, ApJ, 572, 350
- Gal-Yam & Leonard (2009) Gal-Yam, A., & Leonard, D. C. 2009, Nature, 458, 865
- Gal-Yam et al. (2008) Gal-Yam, A., Maoz, D., Guhathakurta, P., & Filippenko, A. V. 2008, ApJ, 680, 550
- Gal-Yam et al. (2004) Gal-Yam, A., et al. 2004, ApJ, 609, L59
- Gal-Yam et al. (2007) Gal-Yam, A., et al. 2007, ApJ, 656, 372
- Gezari et al. (2008) Gezari, S., et al. 2008, ApJ, 683, L131
- Hodapp et al. (2004) Hodapp, K. W., et al. 2004, Astronomische Nachrichten, 325, 636
- Humphreys & Davidson (1994) Humphreys, R. M., & Davidson, K. 1994, PASP, 106, 1025
- Imshennik et al. (1981) Imshennik, V. S., Nadezhin, D. K., & Utrobin, V. P. 1981, Ap&SS, 78, 105
- Katz et al. (2010) Katz, B., Budnik, R., & Waxman, E. 2010, ApJ, 716, 781
- Kasen (2010) Kasen, D. 2010, ApJ, 708, 1025
- Klein & Chevalier (1978) Klein, R. I., & Chevalier, R. A. 1978, ApJ, 223, L109
- Kulkarni (2005) Kulkarni, S. R. 2005, arXiv:astro-ph/0510256
- Law et al. (2009) Law, N. M., et al. 2009, PASP, 121, 1395
- Martin et al. (2005) Martin, D. C., et al. 2005, ApJ, 619, L1
- Massey (2003) Massey, P. 2003, ARA&A, 41, 15
- Matheson et al. (2000) Matheson, T., Filippenko, A. V., Ho, L. C., Barth, A. J., & Leonard, D. C. 2000, AJ, 120, 1499
- Matzner & McKee (1999) Matzner, C. D., & McKee, C. F. 1999, ApJ, 510, 379
- Miller & Stone (1993) Miller, J. S., & Stone, R. P. S. 1993, Lick Observatory Technical Reports, 66 (Santa Cruz, CA: Lick Obs.)
- Nakar & Sari (2010) Nakar, E., & Sari, R. 2010, arXiv:1004.2496
- Ofek et al. (2007) Ofek, E. O., et al. 2007, ApJ, 659, L13
- Owocki et al. (2004) Owocki, S. P., Gayley, K. G., & Shaviv, N. J. 2004, ApJ, 616, 525
- Poznanski et al. (2002) Poznanski, D., Gal-Yam, A., Maoz, D., Filippenko, A. V., Leonard, D. C., & Matheson, T. 2002, PASP, 114, 833
- Rabinak & Waxman (2010) Rabinak, I., & Waxman, E. 2010, arXiv:1002.3414
- Rau et al. (2009) Rau, A., et al. 2009, PASP, 121, 1334
- Schawinski et al. (2008) Schawinski, K., et al. 2008, Science, 321, 223
- Schlegel et al. (1998) Schlegel, D. J., Finkbeiner, D. P., & Davis, M. 1998, ApJ, 500, 525
- Schlegel (1990) Schlegel, E. M. 1990, MNRAS, 244, 269
- Smith et al. (2003) Smith, N., Gehrz, R. D., Hinz, P. M., Hoffmann, W. F., Hora, J. L., Mamajek, E. E., & Meyer, M. R. 2003, AJ, 125, 1458
- Smith & McCray (2007) Smith, N., & McCray, R. 2007, ApJ, 671, L17
- Smith et al. (2007) Smith, N., et al. 2007, ApJ, 666, 1116
- Smith et al. (2009) Smith, N., et al. 2009, ApJ, 695, 1334
- Soderberg et al. (2008) Soderberg, A. M., et al. 2008, Nature, 453, 469
- Taam & Ricker (2006) Taam, R. E., & Ricker, P. M. 2006, astro-ph/0611043
- Wade & Horne (1988) Wade, R. A., & Horne, K. 1988, ApJ, 324, 411
- Waxman et al. (2007) Waxman, E., Mészáros, P., & Campana, S. 2007, ApJ, 667, 351
- Weaver (1976) Weaver, T. A. 1976, ApJS, 32, 233
- York et al. (2000) York, D. G., et al. 2000, AJ, 120, 1579