Study of the -ray source 1AGL J2022+4032 in the Cygnus Region
Abstract
Context. Identification of -ray-emitting Galactic sources is a long-standing problem in astrophysics. One such source, 1AGL J2022+4032, coincident with the interior of the radio shell of the supernova remnant Gamma Cygni (SNR G78.2+2.1) in the Cygnus Region, has recently been identified by Fermi as a -ray pulsar, LAT PSR J2021+4026.
Aims. We present long-term observations of 1AGL J2022+4032 with the AGILE -ray telescope, measuring its flux and light curve.
Methods. We compare the light curve of 1AGL J2022+4032 with that of 1AGL J2021+3652 (PSR J2021+3651), showing that the flux variability of 1AGL J2022+4032 appears to be greater than the level predicted from statistical and systematic effects and producing detailed simulations to estimate the probability of the apparent observed variability.
Results. We evaluate the possibility that the -ray emission may be due to the superposition of two or more point sources, some of which may be variable, considering a number of possible counterparts.
Conclusions. We consider the possibility of a nearby X-ray quiet microquasar contributing to the flux of 1AGL J2022+4032 to be more likely than the hypotheses of a background blazar or intrinsic -ray variabilty of LAT PSR J2021+4026.
Key Words.:
Gamma rays: stars: 1AGL J2022+4032, 1FGL J2021.5+4026, 3EG J2020+4017 — pulsars: LAT PSR J2021+40261 Introduction
Identification of the Galactic sources emitting -rays with energies above 100 MeV is a long-standing problem in astrophysics. With the launch of the AGILE -ray telescope in 2007 (Tavani et al., 2009a) and Fermi in 2008 (Atwood et al., 2009), a great deal of progress has been made. In particular, Fermi and AGILE have shown that the vast majority of Galactic -ray sources are probably pulsars and pulsar wind nebulae (Abdo et al., 2009a). However, new source classes have also been identified, including microquasars such as Cygnus X-1 (Sabatini et al., 2010), Cygnus X-3 (Tavani et al., 2009c; Abdo et al., 2009c), LS5039 (Abdo et al., 2009d) and LSI (LSI+61 303) (Abdo et al., 2009e), and Wolf-Rayet stars such as Eta Carinae (Tavani et al., 2009b).
As the identification of the remaining unidentified EGRET sources and the newly found AGILE and Fermi-LAT sources continues, the problem of source confusion will become increasingly serious. Although the angular resolution of both AGILE and Fermi are higher than that of EGRET, they also are sensitive to much lower fluxes, Fermi-LAT in particular. As a result, -ray error contours will not only continue to contain many plausible source counterparts, but will be increasingly likely to contain multiple real -ray sources above the nominal flux threshold.
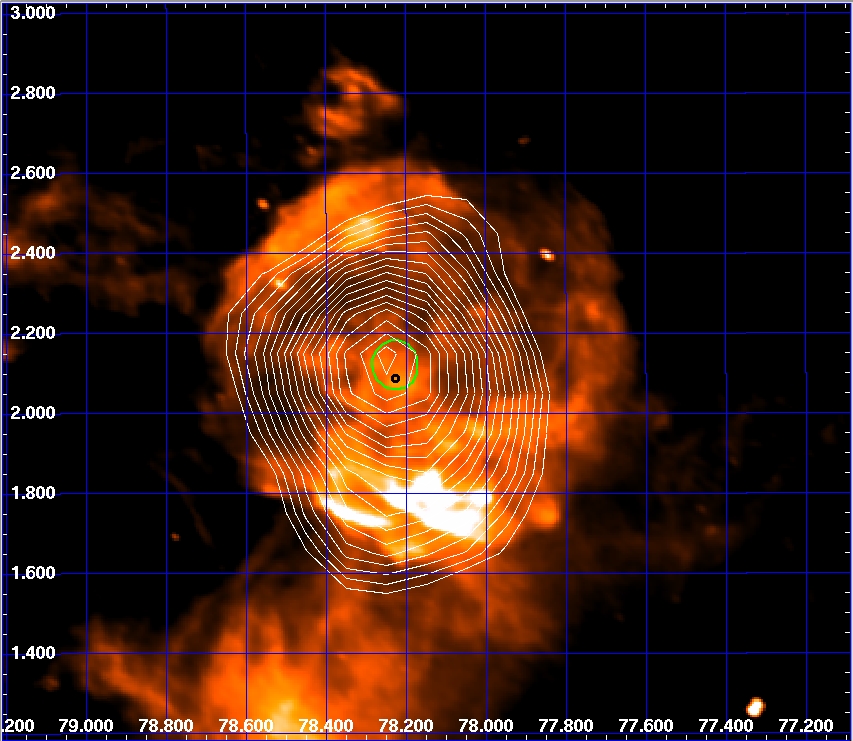
In this paper we provide evidence that 1AGL J2022+4032 in the Cygnus region 111Throughout this paper we refer to the Cygnus region, although physically this direction lies along the tangents of at least three different Galactic spiral arms at different distances, from the local kpc Orion spur, to the Perseus arm, to the Outer arm at kpc. (Pittori et al., 2009) may be one of these sources. We present a study of the time variability of the -ray flux of 1AGL J2022+4032 based on long term observations of the source by AGILE. This source was first discovered by COS-B as 2CG078+2, and was listed as the unidentified source 3EG J2020+4017 in the 3rd EGRET catalog (Hartman et al., 1999). It is located (Figure 1) within the wide radio shell of the prominent SNR Gamma Cygni (SNR G78.2+2.1). Searches for X-ray counterparts of the source were performed with a number of X-ray telescopes, including ROSAT (Brazier et al., 1996), ASCA (Uchiyama et al., 2002), INTEGRAL (Bykov et al., 2004), and Chandra (Becker et al., 2004; Weisskopf et al., 2006). Using a blind search technique, Fermi-LAT was finally able to identify this source, 1FGL J2021.5+4026 (Abdo et al., 2009a, 2010a), as -ray pulsar LAT PSR J2021+4026 (Abdo et al., 2009b). The -ray flux and spectra are consistent with a pulsar origin. However, -ray pulsars show no variability over time scales of weeks to months; indeed, significant variability on these time scales would be difficult to reconcile with theoretical models.
Beginning in November 2007, AGILE data from this source have revealed signs of variable -ray emission, as reported in ATel #1492 (Longo et al., 2008), #1547 (Giuliani et al., 2008) and #1585 (Chen et al., 2008). The evidence for -ray variability combined with its relatively high unpulsed -ray fraction could indicate either the presence of an additional -ray source coincident with 1FGL J2021.5+4026 or variability of the -ray pulsar LAT PSR J2021+4026.
2 Observations and Data Analysis
| Name | Position | Fluxa𝑎aa𝑎a-ray fluxes in units of . | |
| 1AGL J2021+3652, MeV | (l, b) = (75.22, 0.24) (stat) (syst) | 25.02 | 60 3 (stat) 10% (syst) |
| 1AGL J2022+4032, MeV | (l, b) = (78.23, 2.12) (stat) (syst) | 39.64 | 131 4 (stat) 10% (syst) |
| 1AGL J2032+4102, MeV | (l, b) = (80.08, 1.18) (stat) (syst) | 10.82 | (stat) 10% (syst) |
| J2033+4050b𝑏bb𝑏bPositionally consistent with Cygnus X-3., MeV | (l, b) = (79.84, 0.50) (stat) (syst) | 5.17 | 14 3 (stat) 10% (syst) |
| 1AGL J2021+3652, MeV | (l, b) = (75.16, 0.23) (stat) (syst) | 23.07 | 17 1 (stat) 10% (syst) |
| 1AGL J2022+4032, MeV | (l, b) = (78.21, 2.12) (stat) (syst) | 33.80 | 33 1 (stat) 10% (syst) |
| 1AGL J2032+4102, MeV | (l, b) = (80.05, 0.98) (stat) (syst) | 10.59 | 9 1 (stat) 10% (syst) |
AGILE has been in orbit since April 2007 and has observed the Cygnus
region numerous times, beginning in November 2007. We used these observations
to characterize the -ray variability of the sources in the Cygnus
region using the following procedure. First, we used the software tool
AG_multi2, one of the AGILE Scientific Tools, to perform
multi-source likelihood analysis on the deep-integration AGILE-GRID
data using the FM3.119_2 filter. This analysis revealed
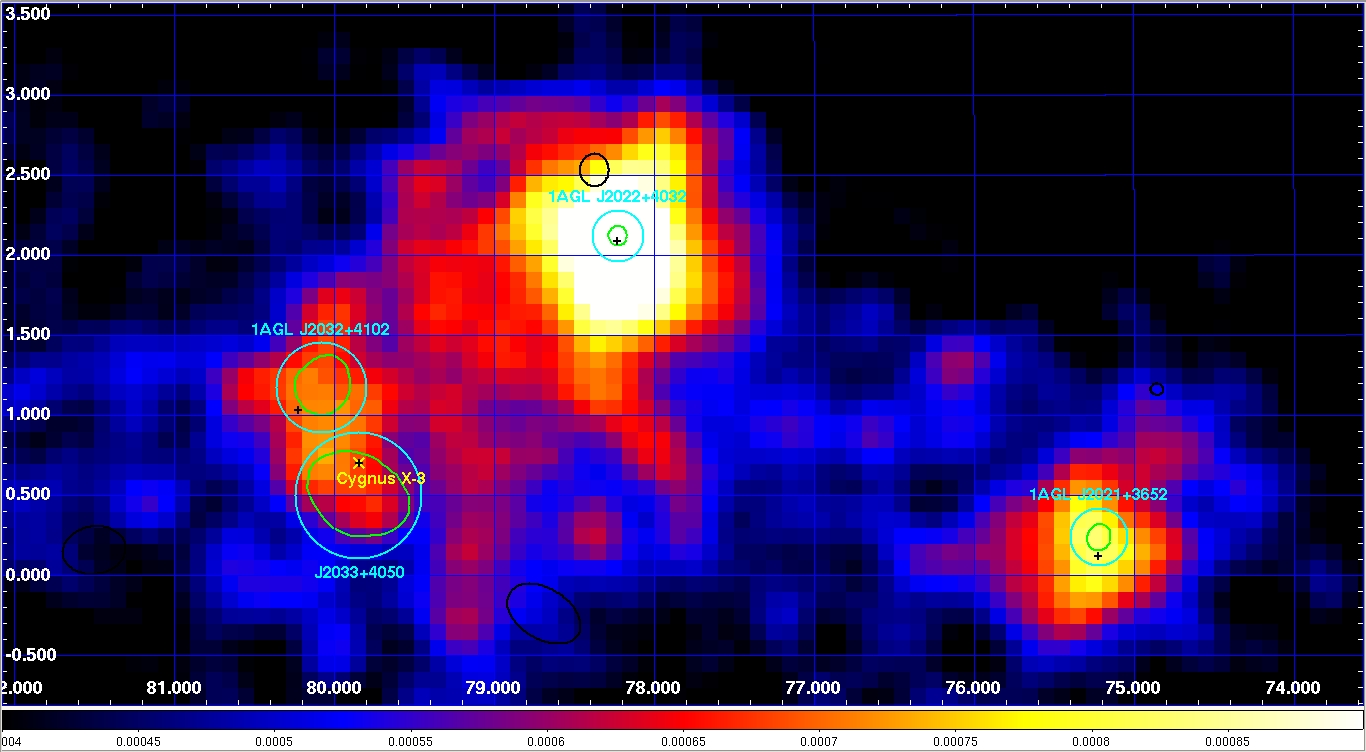
-ray emission from four point sources: 1AGL J2022+4032,
1AGL J2021+3652, 1AGL J2032+4102 and a persistent faint
source consistent with the position of
Cygnus X-3 (Figure 2).
The average fluxes and positions are shown in Table 1.
Fermi source 1FGL J2020.0+4049 was not detected in either energy
range due to the combination of its proximity to 1AGL J2022+4032 and its low
flux.
 |
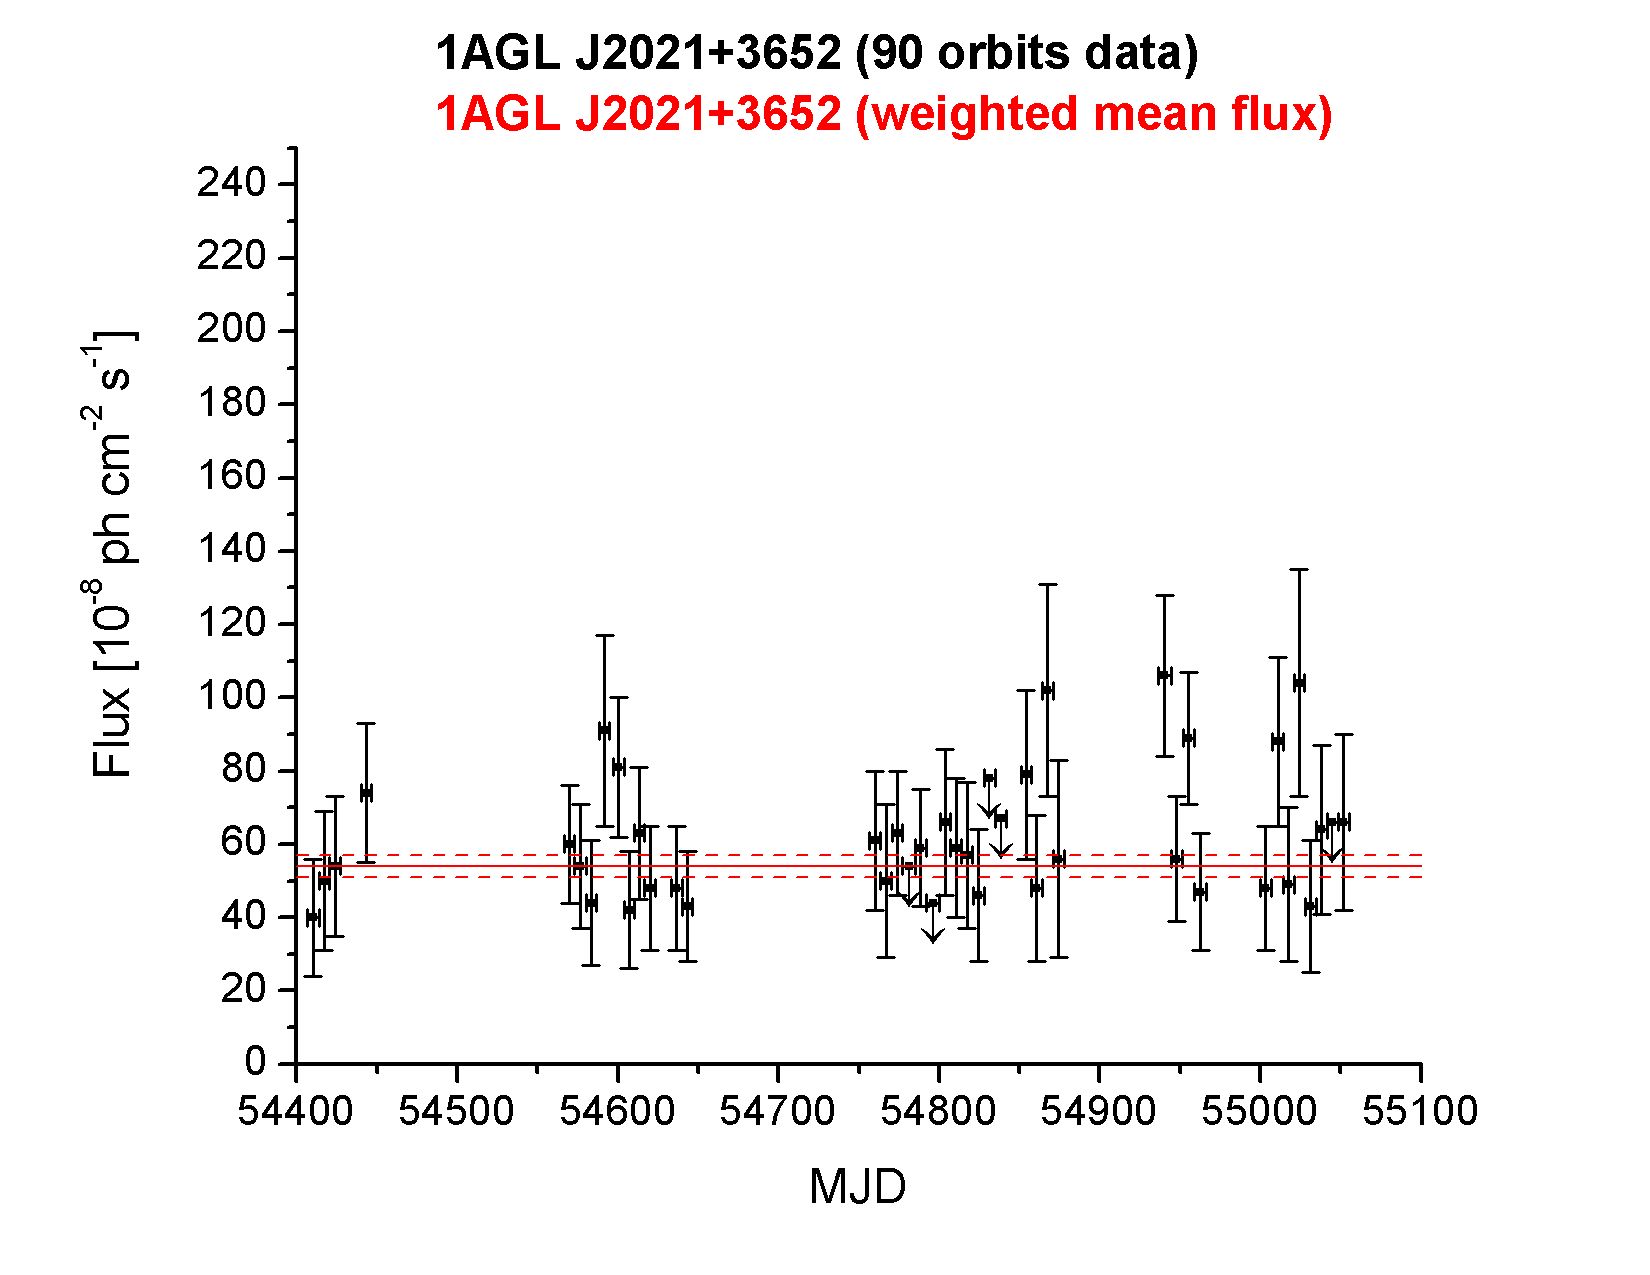 |
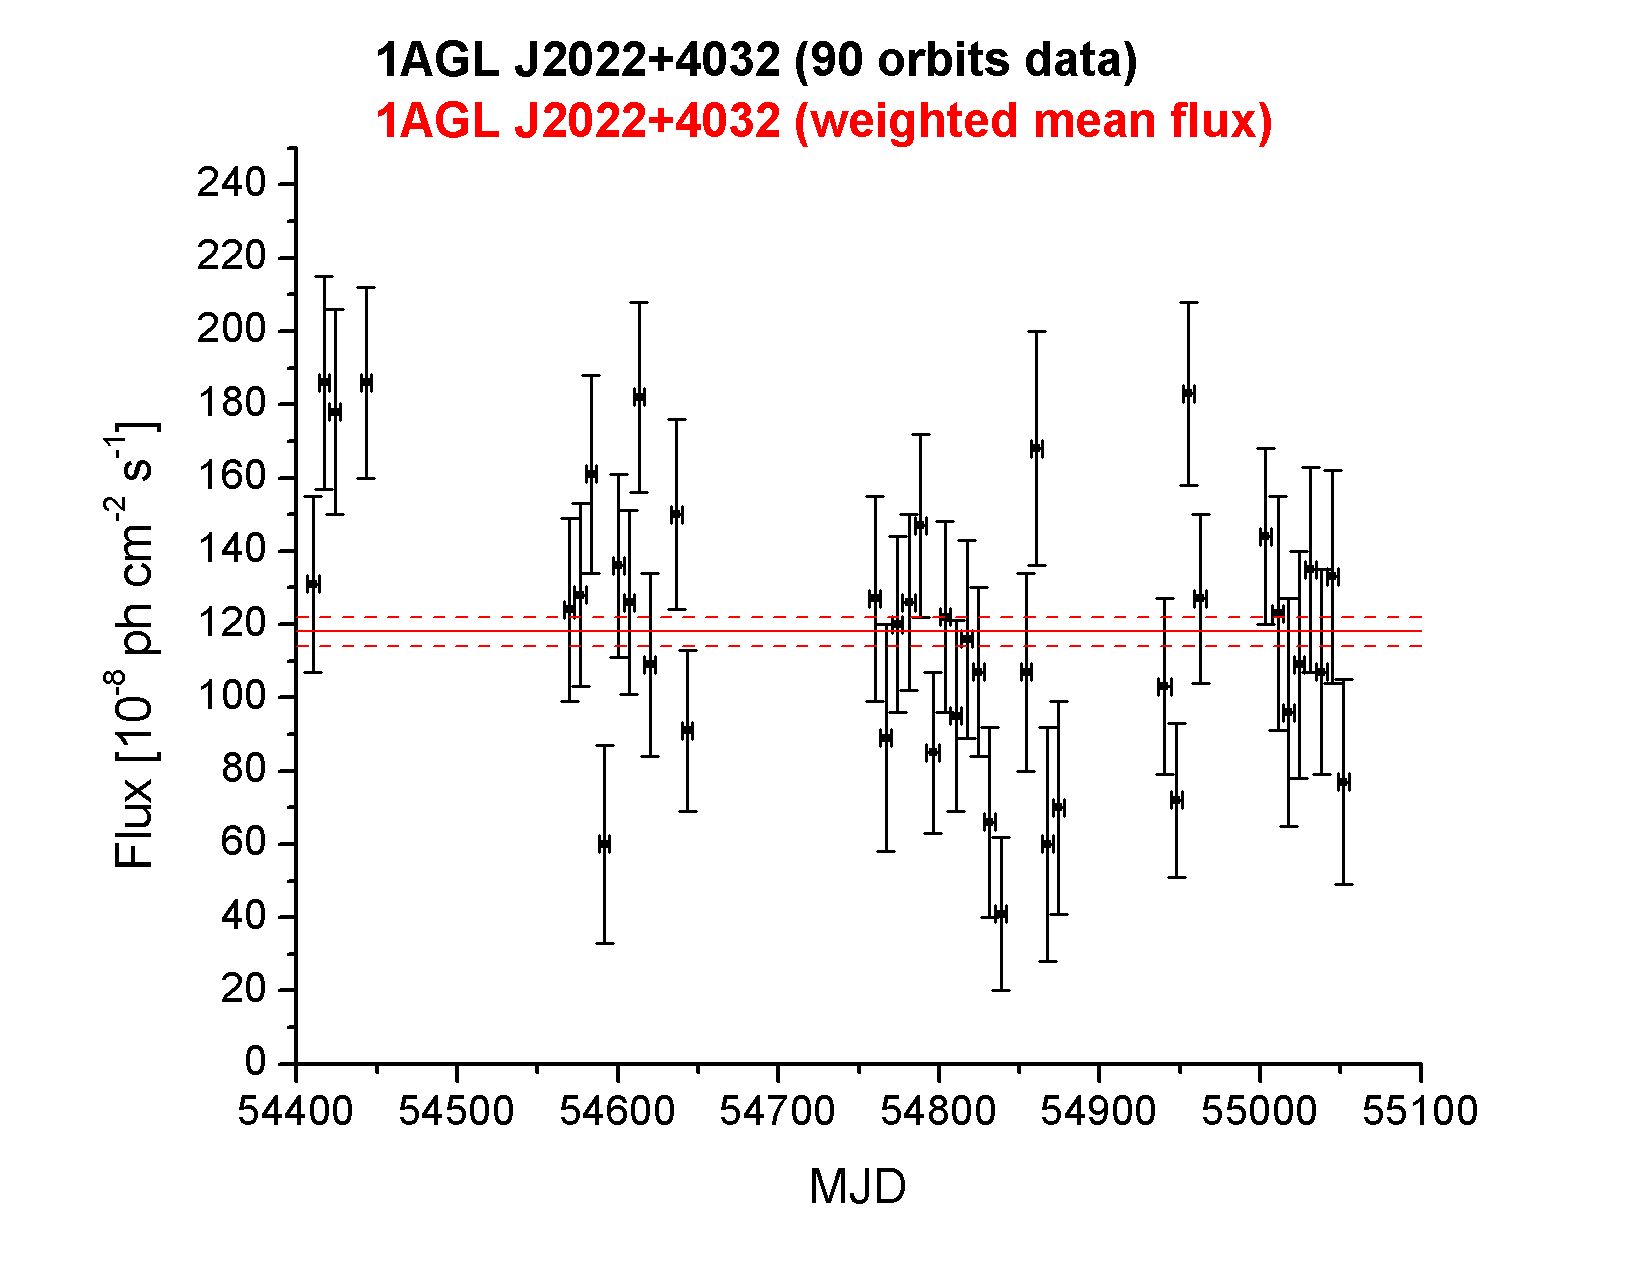
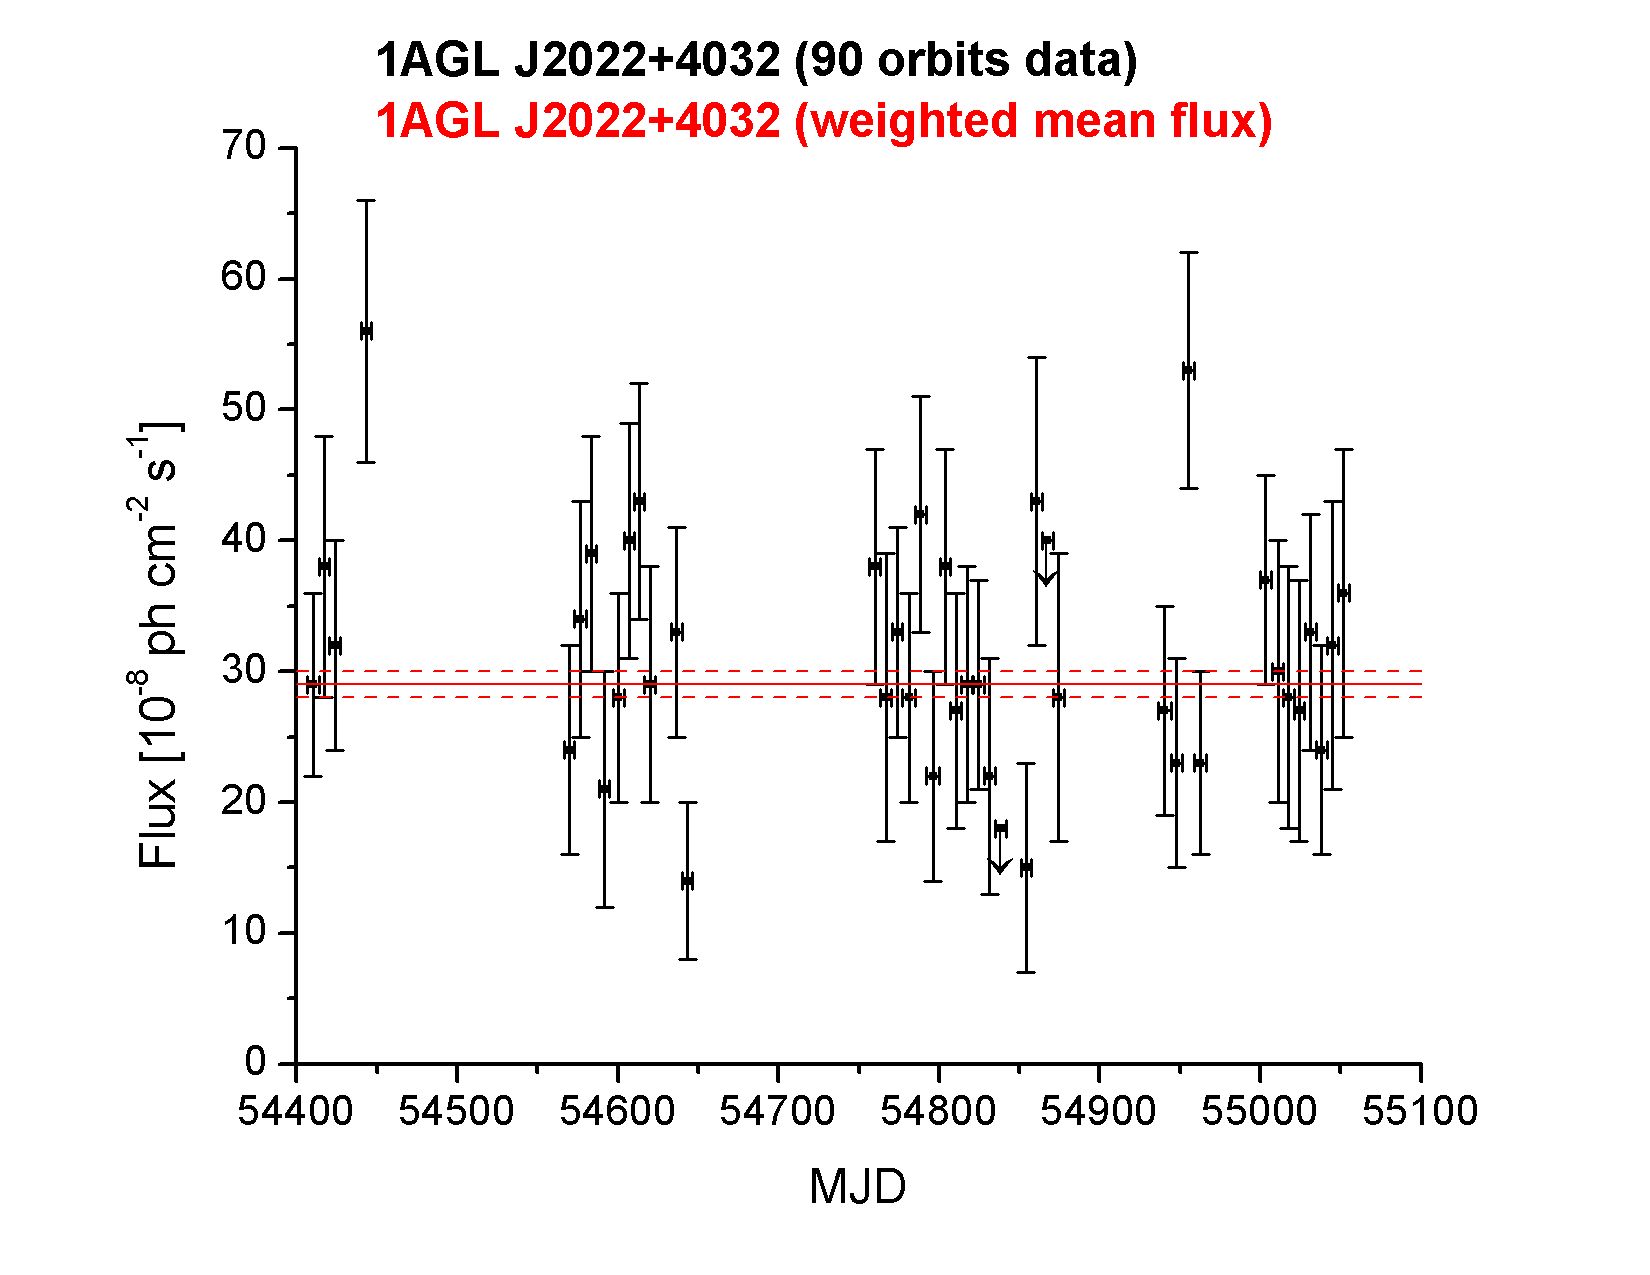
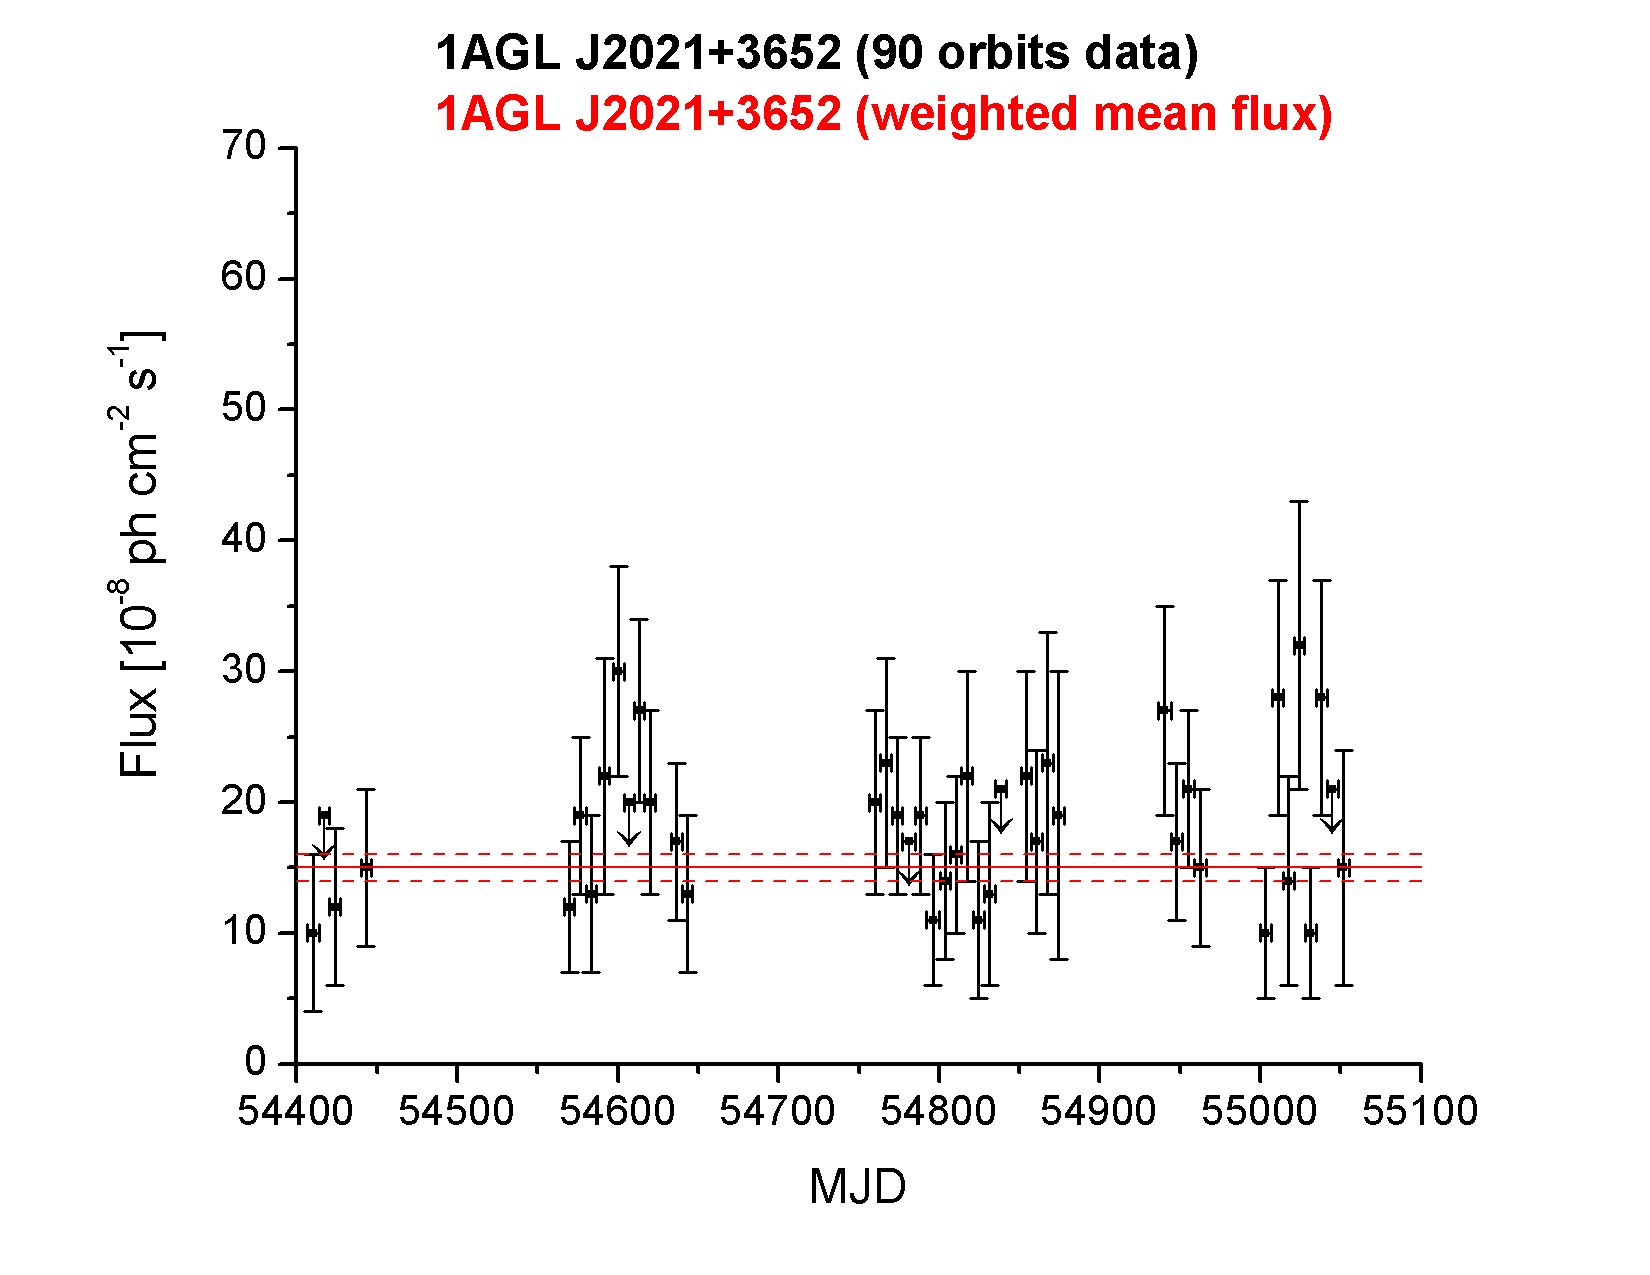
Next, we divided the observations from November 2007 to August 2009 into 42 discrete fixed-length time intervals of days ( orbits) each, analyzing the AGILE -ray flux from the position of 1AGL J2022+4032, , for MeV and MeV, while keeping its position fixed and all nearby sources fixed in flux and position. We performed the same analysis on the nearby -ray source 1AGL J2021+3652, away from 1AGL J2022+4032, which Halpern et al. (2008) identified as PSR J2021+365, in order to account for the effects of systematic errors. Figure 3 shows the light curves of the two sources.
 |
 |
3 Discussion
3.1 Variability
| Name | Syst. errors | ||||||
| 1AGL J2022+4032, MeV | yes | 66.84 | 99.34% | 2.18 | 63.26 | 0.014 | 0.20 |
| no | 82.45 | 99.99% | 3.88 | ||||
| 1AGL J2021+3652, MeV | yes | 40.28 | 49.76% | 0.30 | 40.03 | 0.51 | 0.11 |
| no | 44.47 | 67.24% | 0.48 | ||||
| 1AGL J2022+4032, MeV | yes | 48.10 | 79.27% | 0.68 | 46.07 | 0.27 | 0.10 |
| no | 54.46 | 92.23% | 1.11 | ||||
| 1AGL J2021+3652, MeV | yes | 34.05 | 22.95% | 0.11 | 32.77 | 0.82 | — |
| no | 36.50 | 32.94% | 0.17 | ||||
We used the method developed by McLaughlin et al. (1996) to test the -ray flux variability of 1AGL J2022+4032 with respect to 1AGL J2021+3652. A similar analysis for all the 1AGL sources is in preparation (Verrecchia et al., 2010). The weighted mean flux is calculated from the fluxes in each 6-day time interval and their corresponding errors, from which the is derived. is the probability that an intrinsically non-variable source (i.e. with constant flux) would produce by random chance a measured value of greater than or equal to the observed, and the variability index is defined as . A source can be classified as nonvariable if , uncertain if , or variable if . The value corresponds to a probability of variability of 90%. Table 2 shows the value of for 1AGL J2022+4032 and 1AGL J2021+3652 for MeV and MeV. For 1AGL J2022+4032 we find when systematic effects are included ( for statistical only). For 1AGL J2021+3652 the corresponding values are ().
As a cross-check, we also calculated a complementary variability index, , according to the formula used in the Fermi catalogs (Abdo et al., 2009a, 2010a). This index is a simple where the weights include the systematic error, which in our case is , and the number of degrees of freedom is 41. The values, associated probabilities, and fractional excess variabilities above systematic and statistical fluctuations are found in Table 2.
We find evidence for variability for MeV in the emission from 1AGL J2022+4032 even allowing for systematic errors on the level of 10%. Any systematic effects that would influence the measurement of the flux should also have affected the nearby source 1AGL J2021+3652, for which no corresponding variability is found. However, 1AGL J2021+3652 is only half as bright as 1AGL J2022+4032. Similarly, although we found no evidence for variability in the flux of 1AGL J2022+4032 for MeV when systematic errors are taken into account,the average flux is only a quarter that of MeV. In both cases, the same intrinsic variability might be rendered undetectable because of reduced photon statistics.
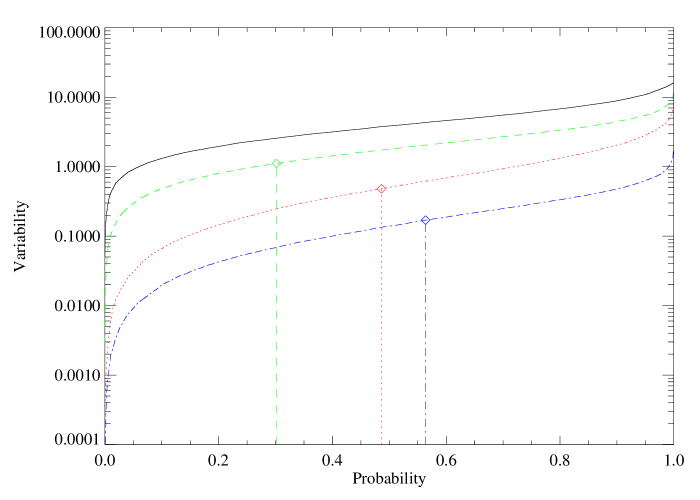
To determine whether the variability of 1AGL J2022+4032 for MeV would have been detectable if the source were half as bright (Case 1) or at higher energies (Case 2), we produced simulated observations of hypothetical sources with the same intrinsic variability, where ”intrinsic” includes the effects of systematic errors. The meaning of ”same” is somewhat ill-defined, since many qualitatively and quantitatively different parent distributions can produce the same variability index, or even the same observed fluxes within errors. In order to simplify the relationship with the calculation of , we assume that the intrinsic flux in each observation is drawn from a Gaussian distribution whose mean is equal to the mean flux of the source in order to find the variance which reproduces the observed value of for 1AGL J2022+4032. We determined that, given the exposures of each of the 42 time intervals, an intrinsic variability of 26% (square root of variance for , the mean flux of 1AGL J2022+4032 for MeV) produces a distribution in with a median equal to the observed value, 3.88 (Figure 5, solid black).
.
For Case 1, we simulated 10000 series of 42 observations for a source with intrinsic fluxes taken from a Gaussian distribution with mean equal to and square root of variance of using the same exposures as 1AGL J2022+4032 for MeV (Figure 5, dotted red). The median value of is 0.50. is produced in of trials, while in of trials. The same level of intrinsic variability would be likely to produce a variability index similar to that of 1AGL J2021+3652, but would not be likely to be classified as variable, if the source were half as bright. For Case 2, we simulated 10000 series of 42 observations for a source with intrinsic fluxes taken from a Gaussian distribution with mean equal to and square root of variance , using the exposures of 1AGL J2022+4032 for MeV (Figure 5, dashed green). The median value of is 1.75. is produced in of trials, while in of trials. The same level of flux variability at high energies would be detected more often than not. Equivalent intrinsic variability at the flux level of 1AGL J2021+3652 for MeV would be completely undetectable (Figure 5, dot-dashed blue).
3.2 Analysis of pulsed and unpulsed components
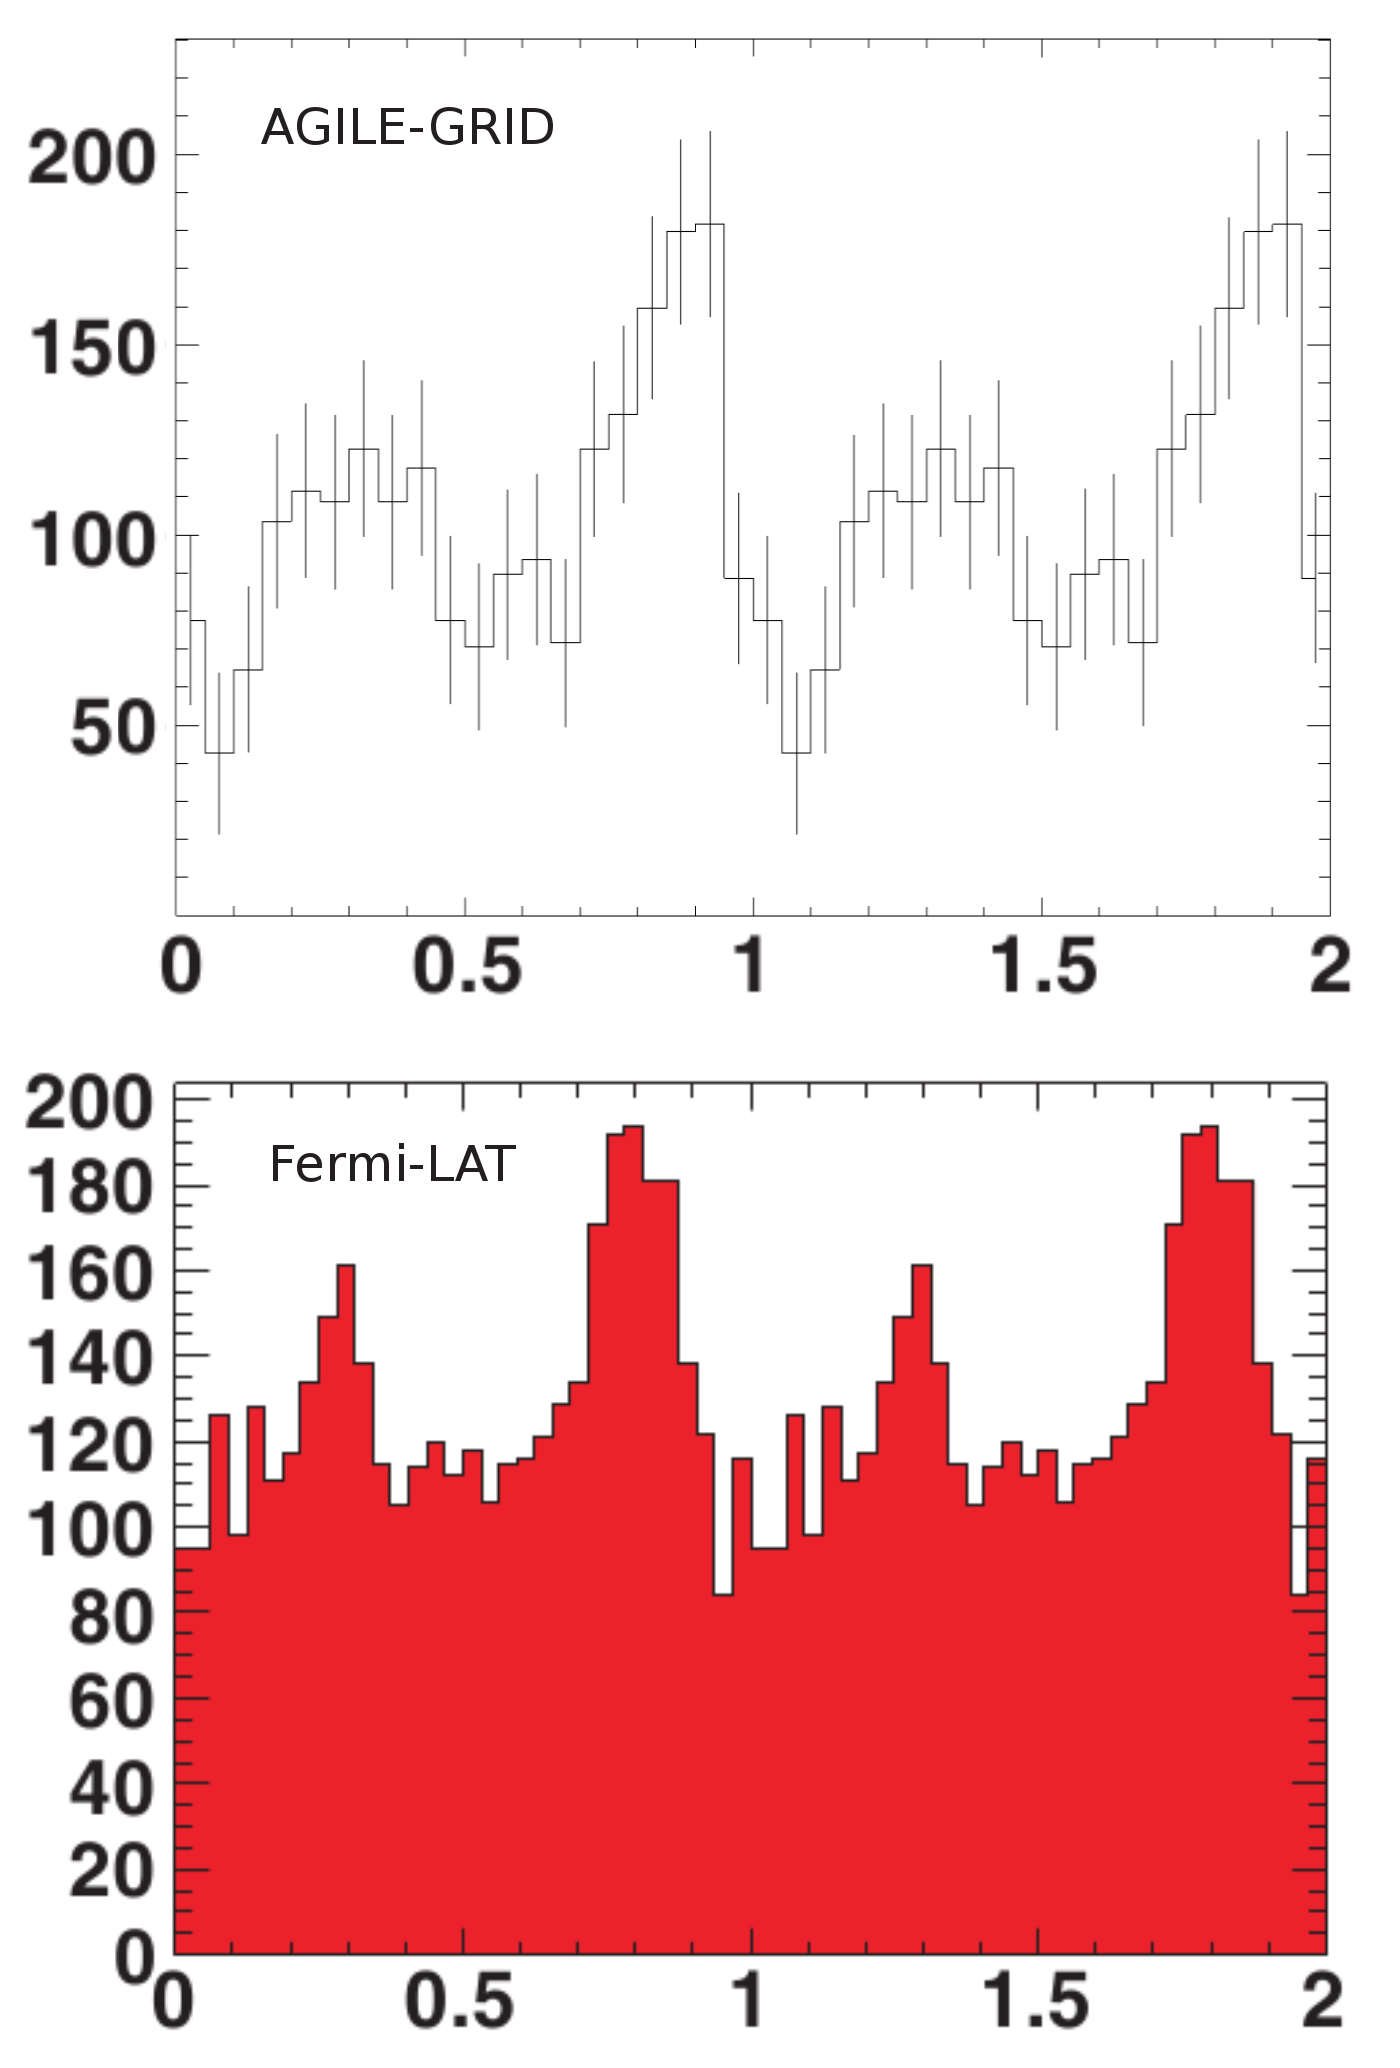
We attempted to perform an analysis of the on- and off-peak components of the 1AGL J2022+4032 AGILE data with respect to the Fermi -ray ephemeris of LAT PSR J2021+4026 in order to test whether the apparent flux variability is due to a source other than the pulsar. However, as shown in Table 3 of the Fermi Pulsar Catalog (Abdo et al., 2010c), LAT PSR J2021+4026 is one of only two Fermi pulsars for which the -ray phase profile is difficult to separate into on-peak and off-peak phases, both because the -ray peaks of the pulsar are very broad and because the -ray emission has a high unpulsed fraction (Figure 6). We attempted a number of cuts on the AGILE data. Varying the off-peak exposure fraction from 10% to 45% yielded a monotonic variation in flux with no obvious plateau. The counts maps show evidence of the pulsar contribution for all but the lowest off-peak exposure fraction, for which the statistical significance over two years of data is insufficient to perform a variability analysis. For these reasons, a credible analysis of the on-peak and off-peak variability based on the AGILE data was not feasible.
4 Discussion of possible counterparts
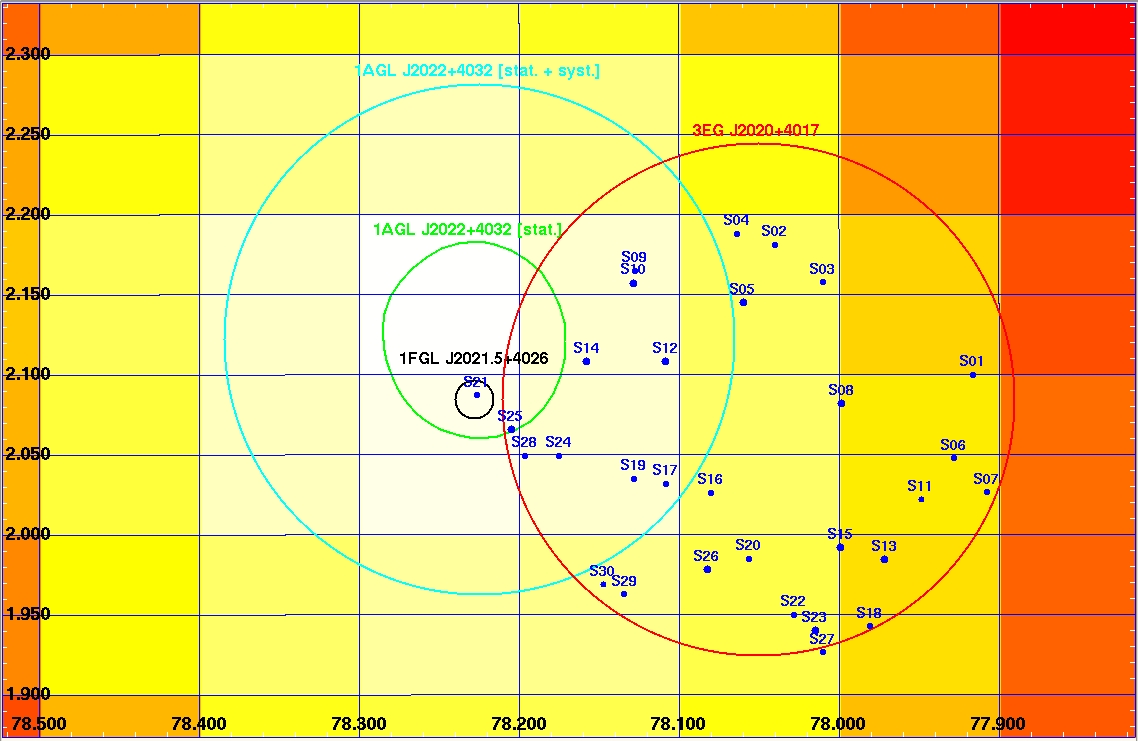
In Figure 7, we show the X-ray sources listed in Weisskopf et al. (2006) as possible counterparts for 3EG J2020+4017. The AGILE contour of the persistent source is consistent with the position of the X-ray source [WSC2006] S21, which has been associated with the LAT PSR J2021+4026 whose pulsations were discovered by Fermi. Trepl et al. (2010) searched the XMM-Newton archival data and found 2XMM J202131.0+402645, a point source coincident with S21. However, re-analyzing the Chandra data, they found that [WSC2006] S25, a strong point source within the Fermi 0FGL error box although outside the Fermi 1FGL error box, showed evidence of variability during the Chandra observation. In addition, S25 is not visible in the XMM data, indicating long-term X-ray variability. If S25 is also a variable -ray source, it would be within the AGILE source location accuracy of for the 1-2 week observation durations, and could be responsible for the variability apparently observed by AGILE below 400 MeV. However, S25 has an infrared counterpart and could be a normal star.
The Fermi 11-month source catalog (Abdo et al., 2010a) detected a nearby source, 1FGL J2020.0+4049, associated with TeV source VER J2019+407, that is within the one-week error circle of AGILE. It was not detected by AGILE, probably because of its hard spectrum with index . Its Fermi light curve is consistent with no variability at a level of 33%; however, its measured flux for MeV decreased from in the first month to below by the seventh month. An intrinsic flux variability of over the longer AGILE observation period would explain the apparent flux variability of 1AGL J2022+4032.
Detection of simultaneous flaring in -ray and, e.g., X-rays would provide a definitive identification. However, soft X-ray instruments have fields of view too narrow to make triggered observations practical. We note that a special class of microquasars may not necessarily produce simultaneous hard X-ray emission (Romero & Vila, 2009, hereafter RV09).
4.1 A variable pulsar
It is possible that the pulsar LAT PSR J2021+4026 itself has variable -ray emission for the energy range below 400 MeV. This scenario, if confirmed, would open a new field of investigation of -ray pulsars. However, in the absence of other information supporting this hypothesis pulsar -ray variability of LAT PSR J2021+4026 is unlikely. This conclusion is based on both previous observational evidence from EGRET and from general theoretical considerations. In particular, the spin period and time derivative (Abdo et al., 2009b) of LAT PSR J2021+4026 ( = 265 ms, = ) assign a unremarkable position to this pulsar in both the diagram and in the pulsar -ray luminosity vs. period (or Goldreich-Julian current diagram). Instabilities in the -ray pulsed emission of LAT PSR J2021+4026 might be associated with radio and/or X-ray signal changes during the period of the detected -ray variability. Future monitoring of LAT PSR J2021+4026 can contribute to test this fascinating hypothesis.
4.2 Background blazar
Another possibility is that a blazar behind the Galactic plane is contributing variable -ray emission to the measured flux of 1AGL J2022+4032. There are a number of known blazars in the Cygnus region, but they are well outside the typical AGILE one-week error circle. Most optical and radio AGN catalogs avoid the Galactic plane because of the high concentration of Galactic sources, heavy extinction, and/or diffuse radio emission (Abdo et al., 2010b). Each of these difficulties is especially acute at the position of 1AGL J2022+4032, which is located within the Gamma-Cygni supernova remnant shell (see Fig. 1). Trepl et al. (2010) found multiple areas of concentrated radio emission within the Fermi error box of 1FGL J2021.5+4026 as well as evidence of variable X-ray emission from nearby source [WSC2006] S25. In addition, the -ray flux could be well below the detection threshold of AGILE (which, in the presence of a known, bright -ray source is quite high) and still contribute to the overall -ray variability within the one-week AGILE error box. Knowing that the intrinsic distribution of blazars should be isotropic, we can use the AGN associations above in the First AGN Catalog (Abdo et al., 2010b, hereafter 1LAC) to estimate the probability of finding at least one blazar within the error box of a one-week observation with AGILE. The probability of finding a blazar similar to the 599 1LAC associations is . A more conservative estimate using only the 281 1LAC associated FSRQs, yielding a probability of of finding at least one FSRQ, would better represent the need for -ray variability and the non-detection by Fermi. In either case, the probability of chance coincidence is quite low.
4.3 An X-ray quiet microquasar
Taking into account both the AGILE-GRID emission above 100 MeV and the Super-AGILE upper limit in the 15-60 keV range ( mCrab), we consider the possibility that the detected -ray variability is caused by transient activity of an X-ray quiet microquasar. RV09 analyzed several Galactic sources with variable emission in the -ray energy range and showing a ratio . They proposed that this kind of emission (shortly variable, X-ray quiet, …) can be produced by proton-dominated jets in a special class of Galactic microquasars. The bulk of the emission at -ray energies is produced by hadronic jets emitted from an accreting source. The model of RV09 predicts a -ray luminosity for this process on the order of . Assuming the presence of a -ray source (an X-ray quiet microquasar) within the error box of LAT PSR J2021+4026, we find that that it is required to be at a distance of pc from the Earth, i.e., closer than the pulsar (1-2 kpc).
The probability of finding this particular type of microquasar within the error box of 1AGL J2022+4032 is difficult to quantify. Nevertheless, because X-ray binaries are concentrated in the star-forming regions in the Galactic plane, and high-mass X-ray binaries particularly along tangents of spiral arms such as the Cygnus region (Liu, van Paradijs, & van den Heuvel, 2007, 2006), the likelihood that there is an appropriate microquasar within the error box is much higher than that of blazars, which are isotropically distributed. Similar reasoning applies to such possible source types such as massive stellar winds (Tavani et al., 2009b) and novae (Abdo et al., 2010d).
5 Conclusions
The apparent -ray flux variability of 1AGL J2022+4032 in the 100-400 MeV range as seen by AGILE leads us to consider two possible explanations. One is that the Fermi pulsar, LAT PSR J2021+4026 itself has a variable -ray flux. This behavior would be highly unusual given the properties of -ray (and radio) pulsars with similar characteristics. Based on the large -ray unpulsed fraction of LAT PSR J2021+4026 as seen by its folded light curve (Abdo et al., 2009b), we believe that it is more likely that another variable -ray source within the error box of LAT PSR J2021+4026 contributes to the total emission of 1AGL J2022+4032. 1AGL J2022+4032 was not detected in the hard X-rays during the AGILE observation periods, with upper limits in Super-AGILE varying from 10 to 50-60 mCrab in the 15-60 keV range. Therefore, if the variable source is a microquasar rather than an unidentified low-frequency blazar, it would be an X-ray-quiet -ray variety, possibly of the type proposed by RV09.
We note that during the period in which 1AGL J2022+4032 was observed by Fermi (starting in August 2008), its flux in AGILE-GRID was slightly more stable. In fact, using only the AGILE fluxes for MeV from the 28 time intervals during the Fermi observations, we find that the variability was without systematic errors and with systematic errors, while in the period before Fermi the variability was without systematic errors and with systematic errors. Future observations of 1AGL J2022+4032 by both AGILE and Fermi will reveal whether this fascinating source continues to show evidence over the long term.
References
- Abdo et al. (2010a) Abdo, A. A., et al. 2010a, ApJS, 188, 405
- Abdo et al. (2010b) Abdo, A. A., et al. 2010b, ApJ, 715, 429 (1LAC)
- Abdo et al. (2010c) Abdo, A. A., et al. 2010c, ApJS, 187, 460
- Abdo et al. (2010d) Abdo, A. A., et al. 2010d, Sci, 329, 817
- Abdo et al. (2009a) Abdo, A. A., et al. 2009a, ApJS, 183, 46
- Abdo et al. (2009b) Abdo, A. A., et al. 2009b, Sci, 325, 840
- Abdo et al. (2009c) Abdo, A. A., et al., 2009c, Sci, 326, 1512
- Abdo et al. (2009d) Abdo, A. A., et al. 2009d, ApJ, 706, L56
- Abdo et al. (2009e) Abdo, A. A., et al. 2009e, ApJ, 701, L123
- Atwood et al. (2009) Atwood, W. B., et al. 2009, ApJ, 697, 1071
- Becker et al. (2004) Becker, W., et al. 2004, ApJ, 615, 897
- Brazier et al. (1996) Brazier, K. T. S., et al. 1996, MNRAS, 268, 1033
- Bykov et al. (2004) Bykov, A. M., et al. 2004, A&A, 427, L21
- Chen et al. (2008) Chen, A. W., et al. 2008, The Astronomer’s Telegram, #1585
- Giuliani et al. (2008) Giuliani, A., et al. 2008, The Astronomer’s Telegram, #1547
- Hartman et al. (1999) Hartman, R. C., et al. 1999, ApJS, 123, 79
- Halpern et al. (2008) Halpern, J. P., et al. 2008, ApJ, 688, 33
- Liu, van Paradijs, & van den Heuvel (2007) Liu, Q. Z., van Paradijs, J., & van den Heuvel, E. P. J. 2007, A&A, 469, 807
- Liu, van Paradijs, & van den Heuvel (2006) Liu, Q. Z., van Paradijs, J., & van den Heuvel, E. P. J. 2006, A&A, 455, 1165
- Longo et al. (2008) Longo, F., et al. 2008, The Astronomer’s Telegram, #1492
- McLaughlin et al. (1996) McLaughlin, M. A., Mattox, J. R., Cordes, J. M., & Thompson, D. J. 1996, ApJ, 473, 763
- Pittori et al. (2009) Pittori, C., et al. 2009, A&A, 506, 1563
- Romero & Vila (2009) Romero, G. E., & Vila, G. S. 2009, A&A, 494, L33 (RV09)
- Sabatini et al. (2010) Sabatini S., et al. 2010, ApJ, 712, 10
- Tavani et al. (2009a) Tavani, M., et al. 2009a, A&A, 502, 995
- Tavani et al. (2009b) Tavani, M., et al. 2009b, ApJ, 698, 142
- Tavani et al. (2009c) Tavani, M., et al. 2009c, Nat, 462, 620
- Trepl et al. (2010) Trepl, L., et al. 2010, MNRAS, 405, 1339
- Uchiyama et al. (2002) Uchiyama, Y., Takahashi, T., Aharonian, F. A., & Mattox, J. R. 2002, ApJ, 571, 866
- Verrecchia et al. (2010) Verrecchia, F., et al. 2010, in preparation
- Weisskopf et al. (2006) Weisskopf, M. C., et al. 2006, ApJ, 652, 387