Multi-wavelength polarimetric study towards the open cluster NGC 1893
Abstract
We present multi-wavelength linear polarimetric observations for 44 stars of the NGC 1893 young open cluster region along with -band polarimetric observations of stars of other four open clusters located between 160 to 175. We found evidence for the presence of two dust layers located at a distance of 170 pc and 360 pc. The dust layers produce a polarization . It is evident from the clusters studied in the present work that, in the Galactic longitude range to and within the Galactic plane (), the polarization angles remain almost constant, with a mean 163 and a dispersion of 6. The small dispersion in polarization angle could be due to the presence of uniform dust layer beyond 1 kpc. Present observations reveal that in case of NGC 1893, the foreground two dust layers, in addition to the intracluster medium, seems to be responsible for the polarization effects. It is also found that towards the direction of NGC 1893, the dust layer that exists between 2-3 kpc has a negligible contribution towards the total observed polarization. The weighted mean for percentage of polarization () and the wavelength at maximum polarization () are found to be and m respectively. The estimated mean value of indicates that the average size of the dust grains within the cluster is similar to that in the general interstellar medium. The spatial variation of the polarization is found to decrease towards the outer region of the cluster. In the present work, we support the notion, as already has been shown in previous studies, that polarimetry, in combination with colour-colour diagram, is a useful tool for identifying non-members in a cluster.
keywords:
polarization - dust, extinction - open clusters and associations: individual: (NGC 2281, NGC 1664, NGC 1960, Stock 8 and NGC 1893).1 INTRODUCTION
Dust properties govern several physical and chemical phenomena in the interstellar medium (ISM) and act as a tracer of local environmental conditions. When starlight passes through various components of interstellar dust grains, which are aligned to the Galactic magnetic field, the radiation becomes partially plane-polarized, typically at the level of a few percent. The nature of this polarization reveals important information regarding the shape, size and composition of interstellar dust. The detailed process(es) by which grains get aligned with the magnetic fields has (have) long been, and is still actively under study (Davis & Greenstein 1951; Dolginov 1990; Cho & Lazarian 2005). In general the dust grains tend to align with their long axis perpendicular to the magnetic field (Purcell 1979). The clue to the interstellar origin of the polarization came from the observed correlation between the degree of polarization () and the colour excess, . The values of (in visual wavelengths) for the stars with large are found to be in the range between zero and a maximum value given by (Aannestad & Purcell 1973). The relation between and the colour excess, and the variation of with wavelength, are interpreted in terms of the grain properties and the efficiency of the grain alignment. Therefore, polarimetry is a useful technique to investigate the properties like maximum polarization , the wavelength corresponding to and the orientation of the magnetic field in various Galactic locations.
The photometric and spectroscopic information already available for stars in open clusters are specifically important to make a meaningful study of the dust grains located in the foreground and in the intracluster regions (e.g., Trumpler 27, Feinstein et al. 2000; NGC 6231, Feinstein et al. 2003; Stock 16, Feinstein et al. 2003; Hogg 22 & NGC 6204, Martínez et al. 2004; NGC 5606, Orsatti et al. 2007; NGC 5749, Vergne et al. 2007; IC 1805, Medhi et al. 2007; NGC 6250, Feinstein et al. 2008; NGC 654, Medhi et al. 2008; NGC 6124, Vergne et al. 2010; NGC 6823, Medhi et al. 2010). In this paper, we present multi-wavelength polarimetry of stars towards NGC 1893. We also present -band polarimetry of stars towards four additional clusters, NGC 2281, NGC 1664, NGC 1960 and Stock 8, to get information about the ISM foreground to the cluster NGC 1893. The main aim of this study is to investigate the dust properties as a function of distance towards the anticenter direction of the Galaxy ( to ) using stars in open clusters.
The basic parameters of the observed clusters are given in Table 1. Using these five open clusters, we have made an attempt to study the dust properties of the ISM distributed between pc (NGC 2281) and kpc (NGC 1893). The paper is organized in the following manner. In section 2, we present a brief discussion on the observations and data reduction. We present our results in section 3, and analysis and discussion in section 4. The dust components responsible for the observed polarization are discussed in section 5. We conclude our results in section 6.
| Cluster Id | l | b | Distance | log(age) | Reference | |
|---|---|---|---|---|---|---|
| (pc) | (mag) | (yr) | ||||
| NGC 2281 | 174.90 | 16.88 | 558 | 0.06, 0.11 | 8.70 | Karchenko et al. (2005), Glaspey (1987) |
| NGC 1664 | 161.68 | 0.45 | 1199 | 0.25 | 8.72 | Karchenko et al. (2005) |
| NGC 1960 | 174.54 | 1.07 | 1330 | 0.22 | 7.40 | Sharma et al. (2006) |
| Stock 8 | 173.37 | 0.18 | 2050 | 0.400.60 | 6.006.70 | Jose et al. (2008) |
| NGC 1893 | 173.59 | 1.68 | 3250 | 0.400.60 | 6.60 | Sharma et al. (2007) |
| Cluster Id | Date of Observation | Passband(s) |
|---|---|---|
| (year, month, date) | ||
| NGC 2281 | 2009, 12, 24 | V |
| NGC 1664 | 2009, 12, 24 | V |
| NGC 1960 | 2009, 11, 23 | V |
| Stock 8 | 2009, 11, 23 | V |
| NGC 1893 | 2008, 11, 8 9 | BV |
2 Observations and Data Reduction
Polarimetric observations were carried out using the ARIES Imaging Polarimeter (AIMPOL: Rautela, Joshi & Pandey, 2004; Medhi et al. 2007, 2010) mounted at the Cassegrain focus of the 104-cm Sampurnanand telescope of the Aryabhatta Research Institute of observational sciencES (ARIES), Nainital, India, coupled with a TK 10241024 pixel2 CCD camera. The AIMPOL consists of a half-wave plate (HWP) modulator and a Wollaston prism beam-splitter. The observations were carried out in , , and (=0.440 m, =0.530 m, =0.670 m and =0.800 m) photometric bands. Details of the observations are given in Table 2. Each pixel of the CCD corresponds to 1.73 arcsec and the field-of-view is 8 arcmin in diameter. The FWHM of the stellar image varied from 2 to 3 pixels. The read out noise and gain of the CCD are 7.0 and 11.98 /ADU, respectively. Due to the absence of a grid in AIMPOL, we manually checked for any overlap of ordinary and extra-ordinary images of the sources.
Fluxes of ordinary () and extra-ordinary () beams for all the observed sources with good signal-to-noise ratio were extracted by standard aperture photometry after bias subtraction using the IRAF111IRAF is distributed by National Optical Astronomical Observatories, USA. package. The ratio is given by:
| (1) |
where is the fraction of the total linearly polarized light and is the polarization angle of the plane of polarization. Here is the position of the fast axis of the HWP at 0, 22.5, 45 and 67.5 corresponding to the four normalized Stokes parameters respectively, [R(0)], [R(22.5)], [R(45)] and [R(67.5)]. The detailed procedures used to estimate the polarization and polarization angles for the programme stars are described by Ramaprakash et al. (1998), Rautela, Pandey, & Joshi (2004) and Medhi et al. (2010). Since polarization accuracy is, in principle, limited by photon statistics, we estimated the errors in normalized Stokes parameters (, , and in ) using the expression (Ramaprakash et al. 1998):
| (2) |
where and are the counts in extra-ordinary and ordinary rays respectively, and is the average background counts around the extra-ordinary and ordinary rays of a source. The individual errors associated with the four values of , estimated using equation (2), are used as weights in calculation of and for the programme stars.
To correct the measurements for null polarization (or instrumental polarization) and the zero-point polarization angle, we observed several polarized and unpolarized standards taken from Schmidt, Elston & Lupie (1992). The results on polarized and unpolarized standards are given in Table 3. The values of are in equatorial coordinate system measured from the North increasing towards the East. Both the observed degree of polarization [] and polarization angle [] for the polarized standards are in good agreement with those given by Schmidt et al. 1992. The observed normalized Stokes parameters and (q%, u%) for standard unpolarized stars are also given in Table 3. The instrumental polarization of AIMPOL on the 104-cm Sampurnanand Telescope has been monitored since 2004 in different projects and found to be less than 0.1 in different bands (Rautela, Pandey, & Joshi, 2004; Medhi et al. 2007, 2008, 2010; Pandey et al. 2009).
3 Results
3.1 NGC 1893
The polarization measurements for stars in the region of NGC 1893 are listed in Table 4. The star identification numbers (column 1) are taken from Cuffey and Shapley (1937). The -band magnitudes are given in column 2. The degree of polarization (in percent) and polarization angles (in degree) measured in , , bands and their corresponding standard errors ( and ) are given in columns 3 to 10.
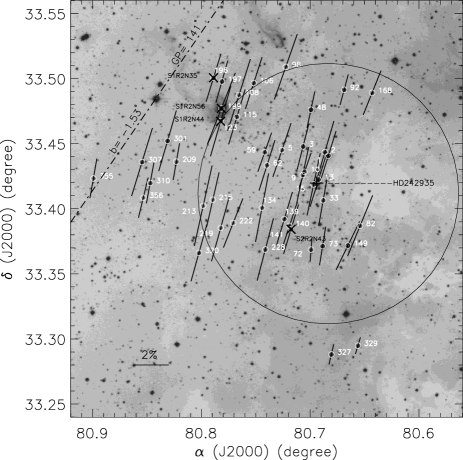
The sky projection of the -band polarization vectors for the 44 stars measured towards the NGC 1893 region is drawn on the -band Digitized Sky Survey II (DSS II) image (Fig. 1). The length of each polarization vector is proportional to the degree of polarization. A vector with a polarization of 2 is drawn for reference. The dash-dotted line superimposed in Fig. 1 is indicating the orientation of the projection of the Galactic plane (GP) which has a polarization angle of . The average polarization () and polarization angle () for 44 stars are found to be , in , , in , , in and , in bands, respectively.
3.2 NGC 2281, NGC 1664, NGC 1960 and Stock 8
Polarimetric measurements in -band for 14 stars towards NGC 2281, 27 stars towards NGC 1664, 15 stars towards NGC 1960 and 21 stars towards Stock 8, have also been carried out. The results are listed in Tables 5, 6, 7 and 8 respectively. The star identification numbers for NGC 2281, NGC 1664, NGC 1960 and Stock 8 are taken from Vasileviskis & Balz (1959), Larsson-Leander (1957), Boden (1951) and Mayer (1964) respectively.
The mean values of and towards NGC 2281, NGC 1664, NGC 1960 and Stock 8 are found to be and ; and ; and and & , respectively.

4 Analysis and Discussion
Fig. 2 presents the distribution of and for stars in the observed cluster regions. Four clusters studied here, namely NGC 1664, NGC 1960, Stock 8 and NGC 1893 are located at Galactic latitude . The nearest open cluster NGC 2281 studied here is located at . A Gaussian fit to the distribution of and yields a mean and a standard deviation as and for NGC 2281; and for NGC 1664; and for NGC 1960; and for Stock 8; and and for NGC 1893. It is evident from Fig. 2 that the mean value of increase with the distance of a cluster.
The polarization angle corresponding to the Galactic plane for each cluster is drawn with a continuous line. Fig. 2 (right panel) indicates that the difference between GP and mean is the largest for the nearby least polarized () cluster (NGC 2281: =174.90 and =16.88). Whereas, in the case of four clusters, namely NGC 1664, NGC 1960, Stock 8 and NGC 1893, the difference between GP and mean (Gaussian) is small and is almost the same. Fig. 2 also reveals that in the Galactic longitude range to and within the Galactic plane (), the polarization angles remain almost constant. The average of the mean values of polarization angles for the four clusters is found to be with a standard deviation of . This implies that at least beyond 1 kpc the magnetic field orientation remains almost unchanged. However, for a smaller distance ( kpc), the polarization angle towards the northern hemisphere (NGC 2281) of the Galactic plane is found to be with a standard deviation of .
The polarization towards the Taurus molecular complex (, ), taken from Heiles (2000), reveals a mean polarization angle of with a standard deviation of . The region selected around the Taurus molecular complex is bound between the Galactic longitude to and latitude . It is interesting to mention that, the mean polarization angles at high Galactic latitude () are significantly different from those in the Galactic plane .


4.1 Member identification
The individual Stokes parameters of the polarization vector of the -band, , given by and are estimated for all the observed stars towards five clusters and presented on a versus plot in Fig. 3. In such a diagram, members of a star cluster are expected to group together, while non-members are expected to show a scattered distribution. The reason is that the measured polarization of a star depends on the column density of aligned dust grains that lie in front of the star and hence the degree of polarization would be similar, lower or higher depending on whether the star is a cluster member, a foreground or a background to the cluster. Likewise, the polarization angles of cluster members would be similar but could be different for foreground or background non-member stars as light from them could have contributions from different or additional dust components. Therefore plot could be a useful tool to segregate the members and non-members of a cluster. Stars with intrinsic polarization, e.g., due to an asymmetric distribution of matter around young stellar objects (YSOs) and/or rotation in their polarization angles (see section 4.2) may also create scattered distribution in the plane.
As shown in Fig. 3, in the case of nearby clusters NGC 2281, NGC 1664 and NGC 1960, a grouping (bound visually by the dotted circle) is apparent, whereas in the case of distant clusters i.e. Stock 8 and NGC 1893, the diagram shows a scattered distribution. A scattered distribution in the case of a distant cluster is expected as the cluster region is contaminated by foreground/ background field stars. Moreover, clusters Stock 8 and NGC 1893 are young and have differential reddening, hence cluster matter may also affect the polarization. The apparent clustering in the case of NGC 2281, NGC 1664 and NGC 1960 further supports the above notion as these are relatively nearby clusters and have less field star contamination. Since these clusters are of intermediate age ( 25 Myr), the effect of variable reddening is absent. The distribution is significantly scattered in the case of NGC 1893, which is the most distant cluster in the present study. It seems difficult to identify probable cluster members of NGC 1893 using the diagram as shown in Fig. 3. To further elucidate the membership in the clusters which do not show any apparent grouping we plot a box with dashed line in plots (Fig. 3) having boundaries of mean and mean (as mentioned in section 3). It can be seen that the majority of stars of apparent grouping lie within the boundaries of the box as mentioned above. Therefore, in the case of clusters, where grouping is absent (Stock 8 and NGC 1893), we presume that the stars lying within the box of mean and values are probable members of the cluster.
The combination of diagram and colour-colour diagram can yield a better identification of probable members in a distant cluster (see e.g. Haikala 1995, Feinstein et al. 2008). Fig. 4 shows the colour-colour diagram for NGC 2281, NGC 1664, NGC 1960, Stock 8 and NGC 1893 cluster regions. For the clusters NGC 2281, NGC 1664, NGC 1960 and Stock 8, the and colours are taken from the Tables 5, 6, 7 and 8 respectively, whereas for the cluster NGC 1893, the colours are taken from Sharma et al. (2007) and Massey et al. (1995). The continuous curve represents the reddened ZAMS for the cluster region as per values mentioned in Table 1. In Fig. 3, the stars lying within the box are shown by open circles, whereas stars outside the box are shown by filled circles. It is apparent from Fig. 3 that stars located within the box follow the general reddening of the cluster region, hence may be probable members of the clusters. On the basis of Figs 3 and 4, we can draw the following conclusions:
NGC 2281: All the stars lying within the box and the boundary of apparent grouping follow the ZAMS reddened for (=0.11 mag) of the cluster region. Although stars #55, 56 and 74 lie on the reddened ZAMS, they have 1.0. These stars could not be MS members of the cluster having log(age) = 8.7 yr. The star #60 is located away from the grouping (Fig. 3). However it follows the reddened ZAMS and its colours are comparable to the probable MS members.
NGC 1664: Stars located within the region bound by a dotted circle (see Fig. 3) have 2% and nicely follow the ZAMS reddened by = 0.25 mag. Hence these could be probable members of the cluster. The stars #1, 22, 27 and 79 are located outside the circle but within the box. These stars show polarization in the range and follow the ZAMS reddened by 0.55 mag. Stars #9, 13, 47 and 87 lie outside the box. These stars show values ranging from 2.5 4.1 . These two groups of stars should be background stars. Star #13 has = 2.59%, but its estimated 0.25 is comparable to the cluster’s value. As the age of the cluster is 500 Myr, the star #13 (=14.36, B-V=1.09) could not be a MS member. Star #164, located significantly away from the grouping, is the lowest polarized star (0.97) and its polarization angle is significantly different (267) from those of the remaining stars of the region. It should be a foreground non-member.
NGC 1960: The stars located within the bound region and the box indicate 0.22 mag. Star #55 is located significantly away from the general distribution, but follows the ZAMS reddened by the average reddening of the region (cf. Fig. 4). This star has relatively a high polarization () and small polarization angle () in comparison to the remaining stars of the region. It should be a background field star. Star #61, the least polarized star () of the region, lies on the reddened ZAMS, but is located away from the general distribution. We conclude that star #61 is probably a foreground field star. Although star #77 is located beyond the 1 box, it follows the reddened ZAMS. This star has polarization and could be a background non-member. Star #91 seems to be associated with the apparent grouping. Its polarization () is comparable to the cluster mean value, hence it could be a member of the cluster.
Stock 8: The diagram does not show any grouping.
The colour-colour diagram indicates that barring
stars #211 and 365, the remaining stars lying within the 1 box
have in the range of mag, hence should be members of the cluster.
Stars #11, 160 and 173 lie outside the 1 box. These three
stars, along with stars #19, 211 and 365, have 0.25 mag.
Hence these should be foreground stars.
Stars #16 and 231 are distributed near
the edge of the box and have and polarization values
comparable to the mean values for the cluster region. These two stars could be
cluster members. The stars #275 and 325 are located out side the box,
however they seem to be reddened B type stars of the region (cf. Fig. 4).
Star #275 has significantly different polarization angle
(1365) from the mean value for the cluster region (),
although the polarization value () is similar to the cluster
mean value (2.400.60).
Star #325 has a relatively higher (4.180.44) value than
the mean value for the cluster region (2.400.60) although the polarization angle
(1653) is similar to the cluster mean value (1607).
Hence the membership determination of these two stars, #275 and 325, is uncertain.
The approximate boundary
to demarcate the foreground stars from the cluster
members is shown by a thin continuous curve (see Fig. 3).
NGC 1893: The colour-colour diagram of the region reveals that barring stars #197 and 356, all the stars lying within the box have 0.40.6 mag, indicating that these stars may be cluster members. Fig. 4 reveals that stars #48, 72, 73, 92, 209, 310, 327, 329 and 355 have 0.2 mag, hence these should be field stars. Five stars #33, 134, 168, 219 and 222 are located near the boundary of the box. These stars have in the range of 0.400.60 mag, hence these could also be members of the cluster. Star #149 is apparently located away from the distribution. This star has relatively higher value of (2.43; cf. Sec. 4.2 and Table 9) and may have a rotation in the polarization angle. Two stars #141 (S2R2N43, Marco and Negueruela 2002) and #196 (S1R2N35, Negueruela et al. 2007) are emission stars. On the basis of polarization, reddening and position in the plot, star #141 should be a cluster member. However, star #196 is a highly reddened MS star (=0.83) and is probably an HAe/Be star (see Fig. 8), but its () and () suggest that it could have undergone depolarization effect. Hence, the membership of star #196 is uncertain. The stars having relatively high polarization and high values as well as having intrinsic component of polarization have been demarcated using a dotted curve as shown in Fig. 3. Fig. 4 indicates that stars #82 and 98 are highly reddened stars, whereas 123 and 199 are emission stars with possible intrinsic component of polarization. Star #108 seems to be a classical Be star (cf. Fig. 8) and may have an intrinsic component of polarization. Star #213 may have rotation in its polarization angle as its (see Table 9).
The probable members of the cluster identified using and colour-colour diagrams, along with the kinematic membership probability () taken from Vasileviskis & Balz (1959) for NGC 2281 and from Dias et al. (2006) for remaining clusters, are mentioned in Tables 5, 6, 7, 8 and 9. Stars with kinematic membership probability 50 are considered as members. The member and non-member stars are represented with M and NM respectively. Stars with uncertainty in their membership determination are indicated with a ’?’ symbol. A comparison indicates that the discrepancy between the membership estimated from kinematic criterion and in the present work is for the nearby clusters (i.e., NGC 2281, NGC 1664 and NGC 1960). The discrepancy is found to increase () for distant clusters (i.e., Stock 8 and NGC 1893). The mean values of and of member stars of the respective clusters as identified above as well as of field stars lying in the cluster regions are given in Table 10. The mean values of for members of the two nearby clusters NGC 2281 and NGC 1960 are the same as those for field stars in these regions, whereas in the case of other nearby cluster (NGC 1664), the non-members show higher value for mean . The higher values of for field stars towards the direction of cluster NGC 1664 are due to the fact that the non-member field stars are located in the background of the cluster and have higher extinction (see Fig. 4). In the case of the distant clusters Stock 8 and NGC 1893, the mean values of for non-members are lower than those for member stars. The mean values of obtained for cluster members further manifest an increasing trend with distance. Table 10 also indicates that the mean values are almost the same for members and non-members lying towards the direction of the clusters studied in the present work.

The plot is also a useful tool to study the interstellar dust distribution as a function of distance from the Sun to the clusters (e.g., Feinstein et al. 2008). The clusters studied in the present work have distances in the range of to kpc. The polarimetric results obtained can be used to study the properties of the dust towards the anticenter direction ( - ) of the Galaxy. Based upon the earlier discussion using and diagrams, in Fig. 5 we show a combined diagram for all the five clusters, namely, NGC 2281 (inverted triangles), NGC 1664 (squares), NGC 1960 (triangles), Stock 8 (circles) and NGC 1893 (star symbols). Open and filled symbols are used to represent members and non-members based upon our analysis. The dust free environment of the solar neighbourhood (shown with rectangular box) is represented by and , while any other point on this plot represents the direction of the polarization vector seen towards that direction from the Sun. Fig. 5 suggests that the degree of polarization of stars is found to increase with the distance to the clusters, as also noticed in Fig. 2. This is consistent with the fact that the degree of polarization increases with the column density of dust grains lying in front of the stars that are relatively well aligned. The close proximity of the points of NGC 1664 and NGC in plane is consistent with the fact that they are located approximately at similar distances (1.2 and 1.3 kpc, respectively).
4.2 The Serkowski law
The wavelength dependence of polarization towards many Galactic directions follows the Serkowski’s law of interstellar polarization (Serkowski 1973; Coyne, Gehrels & Serkowski 1974; Wilking, Lebofsky, & Rieke 1982):
| (3) |
Where is the percentage polarization at wavelength and is the peak polarization, occurring at wavelength . The is a function of optical properties and characteristic particle size distribution of aligned grains (Serkowski, Mathewson & Ford, 1975; McMillan, 1978). The value of is determined by the column density, the chemical composition, size, shape, and alignment efficiency of the dust grains. The parameter , an inverse measure of the width of the polarization curve, was treated as a constant by Serkowski et al. (1975), who adopted a value of 1.15 for all the stars. The Serkowski’s relation with =1.15 provides an adequate representation of the observations of interstellar polarization between wavelengths 0.36 and 1.0 m. If the polarization is produced by aligned interstellar dust grains, the observed data will follow equation (3) and hence we can estimate and for each star. The and are obtained using the weighted least-squares fitting to the measured polarization in bands to equation (3) by adopting =1.15. We have also computed the parameter 222The values of for each star are computed using the expression ; where is the number of colours and . (the unit weight error of the fit) for each star that quantifies the departure of the data points from the standard Serkowski’s law. Because of the weighting scheme, the values of should not exceed 1.5, but if they do, it implies that the stars have intrinsic polarization (e.g., Feinstein et al. 2008, Medhi et al 2007, 2008, 2010). The values can also be used to infer the origin of the polarization. The stars with much lower than the average value of the interstellar medium (0.545 m; Serkowski, Mathewson & Ford 1975) may have an intrinsic component of polarization. Another parameter to infer the presence of intrinsic polarization or polarization angle rotation along the line of sight (Coyne 1974, Martin 1974), is the dispersion of the polarization angle for each star normalized by the average of the polarization angle errors, (Marraco et al. 1993; Orsatti et al. 2007; Feinstein et al. 2008).
The estimated values of , , and for the stars towards NGC 1893 are given in Table 9. The star identifications are same as given in Table 4. The weighted mean values of the and are found to be and m respectively. The estimated is quite similar to the value corresponding to the general interstellar medium (0.545 m, Serkowski et al. 1975). Using the relation (Whittet & Van Breda 1978), the value of , the total-to-selective extinction, comes out to be 3.080.05, which is in agreement with the average value ( = 3.1) for the Milky Way Galaxy, indicating that the size of the dust grains within the cluster NGC 1893 is normal. Similar conclusion was drawn by Sharma et al. (2007) using two colour diagrams.

In Fig. 6 we show versus Pmax (upper panel) and versus (lower panel) plots. The criteria mentioned above indicate that majority of the stars do not show evidence of intrinsic polarization. However a few stars #72, 149, 199, 209 and 215 show deviation from the general distribution.
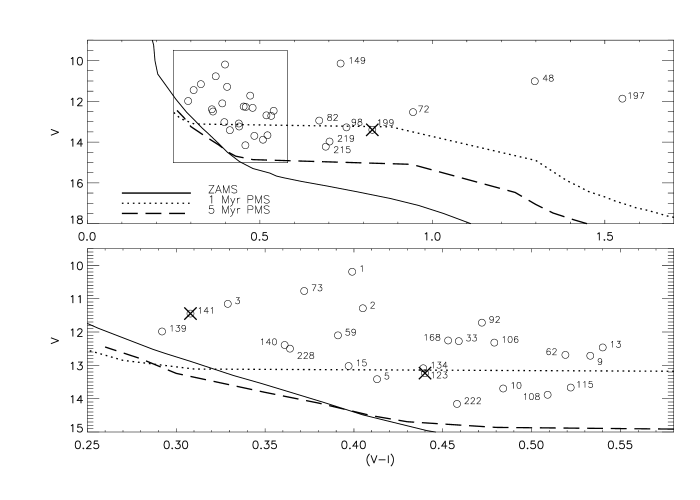
Star #199 is an emission star and its location in the colour-magnitude diagram (CMD) (Fig. 7) reveals that it should be a pre-main sequence (PMS) star. The location of star #209 in the colour-colour diagram (Fig. 4) suggests that it could be a foreground field star. The CMD reveals that star #215 should be a PMS star. Star #123 and 199 are identified as emission stars S1R2N44 and S1R2N56, respectively (Neguerela et al. 2007). Stars #199 and 215 are likely to be PMS stars and accreting matter from their circumstellar material. The accreted material, probably distributed in an asymmetric disk geometry, might be responsible for the observed intrinsic component of polarization. The computed values of show no significant rotation (except for star #149) in polarization angles reiterating the fact that the dust component responsible for the measured polarization is well aligned. Star #149 is a highly reddened MS star (see. Figs 4, 7 and 8) as it is embedded at the eastern edge of the wind blown bubble (cf. Sharma et al. 2007).


4.3 Polarization efficiency
The degree of polarization produced for a given amount of extinction (or reddening) is referred as the polarization efficiency of the intervening dust grains. The polarization efficiency depends mainly on the orientation of the magnetic field along the line of sight, the magnetic field strength and the degree of alignment of the dust grains. Mie calculations place a theoretical upper limit of (Whittet 1992 and references there in) on the polarization efficiency by an infinite cylinder with the diameter comparable to the wavelength of the incident light and with their long axes parallel to each other and perpendicular to the line of sight. The empirical upper limit relation for the polarization efficiency resulting from the studies of reddened Galactic stars, assuming normal interstellar material characterized by (Serkowski, Mathewson & Ford 1975) is found to be . The fact that the maximum observed polarization efficiency is found to be less by a factor of 4.8 than that expected from theory, implies that the alignment of dust grains is not perfect. The reason could be the presence of various components of magnetic fields oriented differently along the line of sight and/or the grains are only moderately elongated rather than infinite cylinder.
The photometric data by Sharma et al. (2007) and Massey et al. (1995) have been used to estimate the reddening . The reddening of individual stars having spectral type earlier than A0, has been derived using the method (Johnson & Morgan 1953) and the values are given in Table 9. The near infrared (NIR) colour-colour diagram (Fig. 8) reveals that stars #48, 72, 197, 310, 355 and 356 have spectral type later than A0. The colour-colour diagram (Fig. 4) indicates that these stars follow reddened by =0.2 mag, hence we assign reddening of =0.20 mag.
In Fig. 9, we present versus for stars towards NGC 1893 region. The continuous line shows the empirical upper limit for the polarization efficiency given by (Serkowski et al. 1975), assuming normal interstellar material characterized by . The recent estimate of the average efficiency by Fosalba et al. (2002), which is valid for 1.0 mag, is represented by the relation and is shown by the dash-dotted line. For comparison, the average polarization efficiency relation, (Serkowski et al. 1975), is also drawn using the dashed line. A majority of the points are found to lie between the continuous line and above the dashed line, indicating that the dust grains towards NGC 1893 have higher polarization efficiency in comparison to the the general ISM.


4.4 Spatial variation of and
The upper panel of Fig. 10 shows for the cluster members and the stars with uncertainty in their membership (# 108, 123, 196, 199 and 213), as a function of the radial distance from the ionization source (see Fig. 1: HD 242935; shown by the plus symbol). Stars located in the northern and southern parts of the cluster are shown by filled and open circles respectively. The distribution of within a radial distance of 5′ from the ionization source shows a decreasing trend with the increase in radial distance. The distribution of shown in Fig. 10 also reveal that in the southern region is relatively higher than that of the northern region. There is a significant increase in the values at . The increase in is mainly due to the YSOs distributed around the nebulae Sim 129 and 130, located towards the North-East direction of HD 242935 at a radial distance of .
The lower panel of Fig. 10 shows radial variation of . The distribution of reveals a clumpy nature of the gas/dust distribution. The polarization efficiency in the northern region of the cluster at a radial distance , assuming a normal value of =3.1, comes out to be , and decreases to at the boundary () of the cluster. The ratio depends mainly on the alignment efficiency, magnetic strength and amount of depolarization due to radiation traversing through more than one medium. The polarization efficiency also depends on the particle shape (Voshchinnikov & Das 2008).
The weighted mean of for stars having 0.40 lying in the northern and southern regions of the cluster is estimated to be as 2.640.04 and 2.770.07. Fig. 11 shows the cumulative distribution of in both regions, for stars having 0.40 mag, which indicates that values in the southern region are systematically higher than those in the northern region. Kolmogorov-Smirnov test indicates that these distributions are different at 80% confidence level.
The weighted mean values of polarization angle () for northern and southern regions are and , which indicate that there is no difference in in the two regions.
5 Dust components responsible for the observed polarization
The degree of polarization of a star increases as a function of distance due to the presence of a column of aligned dust grains along the pencil beam of radiation from the star. The degree of polarization shows a sudden jump if the radiation from the stars encounter a dust layer located at a certain distance between the star and the observer. The number of such sudden jumps is characterized by the number of dust layers encountered by the radiation along its path and the relative magnetic field orientations in the dust layers.
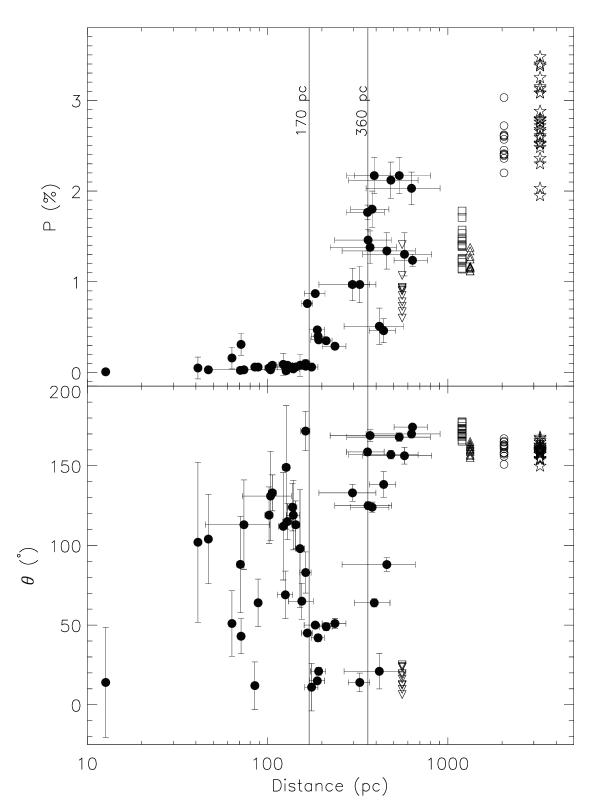
To understand the distribution of dust layers towards the direction of NGC 1893, we selected stars from a region of 10 radius around the cluster with both polarization measurements (Heiles 2000) and Hipparcos parallaxes (van Leeuwen, 2007) available. In Fig. 12 we show the degree of polarization versus distance (upper panel) and polarization angle versus distance (lower panel) plots for the selected stars (filled circles). Stars observed towards the clusters NGC 2281, NGC 1664, NGC 1960, Stock 8 and NGC 1893 are also shown using inverted triangles, squares, triangles, open circles and star symbols respectively. Two significant jumps in the values of , one at pc and another at pc, are clearly evident in the versus distance plot (upper panel).
For distances pc, the values show a scattered distribution between . At pc, the values show a dip to . A sharp rise in values from 20 to 160 is evident at a distance of pc. The stars located beyond pc show an average polarization angle of . On the basis of Fig. 12, we infer that a dust layer at pc contributes to the polarization and the dust grains are aligned towards . Another dust layer with at a distance pc further contributes (i.e., total 1.2 to 2.2 ). The clusters located at distance 1000 pc show in the range of . The 2.2 in these clusters must be due to intracluster medium. The optical properties derived in Sections 4.2 and 4.3 should be a combined effect of dust layers at d pc, pc and intracluster medium.
Neckel and Klare (1980) have studied distribution in the Galactic plane with using extinction and distances computed for individual stars. The map towards the direction of NGC 1893 by Neckel and Klare (1980) reveals that increases with distance up to 2 kpc. Beyond 2 kpc is found to be rather constant, indicating that the dust contribution in the distance range kpc is negligible. Here, it is worthwhile to mention that the mean polarization in the Stock 8 (2.4) and NGC 1893 (2.6) is almost the same, which further confirms that the contribution of dust in the distance range 2-3 kpc is negligible. Further, the observed mean polarization values are consistent with the values mentioned in Table 1.
6 Conclusions
We have made polarimetric observations of the open cluster NGC 1893 in , , and bands. Three additional open clusters towards the direction of NGC 1893, namely, NGC 2281, NGC 1960 and Stock 8 along with NGC 1664 toward anticenter direction of the Galaxy were observed in -band only. The main aim of the study is to investigate the properties of dust grains towards the anticenter direction of the Galaxy between to , using stars of open clusters located in the distance range of 600 pc (NGC 2281) to 3.2 kpc (NGC 1893).
The stars located at distances pc show a large scatter in values with a polarization of . The degree of polarization is found to increase with the distance. The distribution of and as a function of distance reveals two dust layers at pc and pc. The first dust layer is characterized by its polarized components as and . Both dust layers produce a maximum combined polarization up to . Polarization values higher than the should be due to intracluster medium.
The magnetic field orientation remains unchanged within the Galactic plane . The estimated mean value of the polarization angle (assuming a Gaussian distribution) of the four clusters (NGC 1664, NGC 1960, Stock 8 and NGC 1893) comes out to be with a standard deviation of 6. This small dispersion in polarization angle could be due to the presence of a uniform dust layer beyond 1 kpc. Present observations reveal that in case of NGC 1893, the foreground two dust layers, in addition to the intracluster medium, seems to be responsible for the polarization effects.
The estimated mean values of for the two clusters namely, Stock 8 and NGC 1893, imply that the ISM located between 2-3 kpc distance has negligible contribution towards extinction as well as the observed polarization. Present polarimetric results are consistent with the reddening distribution given by Neckel and Klare (1980).
The weighted mean of the and values for NGC 1893 are found to be and m respectively. The estimated is quite similar to that of the general interstellar medium. The value of using the relation (Whittet & Van Breda 1978) is found to be close to the average value of 3.1 for the Milky Way Galaxy, implying that the average size of the dust grains within the cluster NGC 1893 is similar to the general interstellar medium. We also identified four candidate stars with intrinsic polarization in NGC 1893.
The radial distribution of within the cluster shows a decrease of towards the outer region of the cluster. The and the polarization efficiency is found to be higher towards the southern region of the cluster. We have shown that the polarization measurements in combination with colour-colour diagram provide a good tool to determine the membership in a cluster.
Acknowledgments
Authors are thankful to the anonymous referee for useful comments which improved the scientific content and presentation of the paper. This publication makes use of data from the 2MASS (a joint project of the University of Massachusetts and the Infrared Processing and Analysis Center /California Institute of Technology, funded by the National Aeronautics and Space Administration and the National Science Foundation). This research has made use of the WEBDA database, operated at the Institute for Astronomy of the University of Vienna, as well as has used the images from the Digital Sky Survey (DSS), which was produced at the Space Telescope Science Institute under the US Government grant NAG W-2166. We have also used NASA’s Astrophysics Data System and IRAF, distributed by National Optical Astronomy Observatories, USA.
References
- (1) Aannestad P. A., Purcell E, M., 1973, ARA&A, 11, 309
- (2) Bessell M. S., Brett J. M., 1988, PASP, 100, 1134
- (3) Boden E., 1951, UppAn, 3, 1
- (4) Carpenter J. M., 2001, AJ, 121, 2851
- (5) Cho J., Lazarian A., 2005, ApJ, 631, 361
- (6) Cohen J. G., Persson S. E., Elias J. H., Frogel J. A., 1981, ApJ, 249, 481
- (7) Coyne G. V., 1974, AJ, 79, 565
- (8) Coyne G. V., Gehrels T., Serkowski K., 1974, AJ, 79, 581
- (9) Cuffey J., Shapley H., 1937, AnHar, 105, 403
- (10) Cutri R. M., et al. 2003, The IRSA 2MASS All-Sky Point Source Catalog, NASA/IPAC Infrared Science Archive (http://irsa.ipac.caltech.edu/applications/Gator/)
- (11) Davis L. Jr., Greenstein J. L., 1951, ApJ, 114, 206
- (12) Dias W. S., Assafin M., Flório V., Alessi B. S., Líbero V., 2006, A&A, 446, 949
- (13) Dolginov A. Z., 1990, IAUS, 140, 242
- (14) Dougherty S. M., Waters L. B. F. M., Burki G., Cote J., Cramer N., van Kerkwijk M. H., Taylor A. R., 1994, A&A, 290, 609
- (15) Feinstein C., Baume G., Vázquez R., Niemela V., Cerruti M. A., 2000, AJ, 120, 1906
- (16) Feinstein C., Baume G., Vergne M. M., Vázquez R., 2003, A&A, 409, 933
- (17) Feinstein C., Martínez R., Vergne M. M., Baume G., Vázquez R., 2003, ApJ, 598, 349
- (18) Feinstein C., Vergne M. M., Martínez R., Orsatti A. M., 2008, 391, 447
- (19) Fosalba P., Lazarian A., Prunet S., Tauber J. A., 2002, ApJ, 564, 762
- (20) Girardi L., Bertelli G., Bressan A., Chiosi C., Groenewegen M. A. T., Marigo P., Salasnich B., Weiss A., 2002, A&A, 391, 195
- (21) Glaspey J. W., 1987, PASP, 99, 1089
- (22) Haikala L. K., 1995, A&A, 294, 89.
- (23) Heiles C., 2000, AJ, 119, 923
- (24) Hernández J., Calvet N., Hartmann L., Briceo C., Sicilia-Aguilar A., Berlind P., 2005, AJ, 129, 856
- (25) Hoag A. A., Johnson H. L., Iriarte B., Mitchell R. I., Hallam K. L., Sharpless S., 1961, Publ. Us. Nav. Obs. XVII part VII, 347
- (26) Hoag A. A., Johnson H. L., Iriarte B., Mitchell R. I., Hallam K. L., Sharpless S., 1961, PUSNO, 17, 347
- (27) Johnson H. L., Morgan W. W., 1953, ApJ, 117, 313
- (28) Jose J., Pandey A. K., Ojha D. K., Ogura K., Chen W. P., Bhatt B. C., Ghosh S. K., Mito H., Maheswar G., Sharma S., 2008, MNRAS, 384, 1675
- (29) Kharchenko N. V., Piskunov A. E., Rser S., Schilbach E., Scholz R.-D., 2005, A&A, 438, 1163
- (30) Larsson-Leander G., 1957, StoAn, 20, 1
- (31) Marco A., Negueruela I., 2002, A&A, 393, 195
- (32) Marraco H. G., Vega E. I., Vrba F. J., 1993, AJ, 105, 258
- (33) Martin P. G., 1974, ApJ, 187, 461
- (34) Martínez R., Vergne M. M., Feinstein C., 2004, A&A, 419, 965
- (35) Massey P., Johnson K. E., Degioia-Eastwood K., 1995, ApJ, 454, 151
- (36) Mayer P., 1964, AcMPh, 1, 25
- (37) McMillan R. S., 1978, ApJ, 225, 880
- (38) Medhi B. J., Maheswar G., Brijesh K., Pandey J. C., Kumar T. S., Sagar R., 2007, MNRAS, 378, 881
- (39) Medhi B. J., Maheswar G., Pandey J. C., Kumar T. S., Sagar R., 2008, MNRAS, 388, 105
- (40) Medhi B J., Maheswar G., Pandey J. C., Tamura M., Sagar R., 2010, MNRAS, 403, 1577
- (41) Neckel Th., Klare G., 1980, A&AS, 42, 251
- (42) Negueruela I., Marco A., Israel G. L., Bernabeu G., 2007, A&A, 471, 485
- (43) Orsatti A. M., Feinstein C., Vega E. I., Vergne M. M., 2007, A&A, 471, 165O
- (44) Pandey J. C., Medhi B. J., Sagar R., Pandey A. K., 2009, MNRAS, 396, 1004
- (45) Pesch P., 1961, ApJ, 134, 602
- (46) Purcell E. M., 1979, ApJ, 231, 404
- (47) Purgathofer A., 1964, AnWie, 26, 37
- (48) Ramaprakash A. N., Gupta R., Sen A. K., Tandon S. N., 1998, A&AS, 128, 369
- (49) Rautela B. S., Joshi G. C., Pandey J. C., 2004, BASI, 32, 159
- (50) Schmidt G, D., Elston R., Lupie O. L., 1992, AJ, 104, 1563
- (51) Schmidt-Kaler Th., 1982, in Schaifers K., Voigt H. H., Landolt H., eds, Landolt-Bornstein, Vol. 2b. Springer, Berlin, p. 19
- (52) Serkowski K., 1973, IAUS, 52, 145.
- (53) Serkowski K., Mathewson D. S., Ford V. L., 1975, ApJ, 196, 261
- (54) Sharma S., Pandey A. K., Ogura K., Mito H., Tarusawa K., Sagar R., 2006, AJ, 132, 1669
- (55) Sharma S., Pandey A. K., Ojha D. K., Chen W. P., Ghosh S. K., Bhatt B. C., Maheswar G., Sagar R., 2007, MNRAS, 380, 1141
- (56) Siess L., Dufour E., Forestini M., 2000, A&A, 358, 593
- (57) van Leeuwen F., 2007, A&A, 474, 653
- (58) Vasilevskis S., Balz A. G. A., 1959, AJ, 64, 170
- (59) Vergne M. M., Feinstein C., Martínez R., 2007, A&A, 462, 621
- (60) Vergne M. M., Feinstein C., Martínez R., Orsatti A. M., Alvarez M. P., 2010, MNRAS, 403, 2041
- (61) Voshchinnikov N. V., Das H. K., 2008, J. Quant. Spectrosc. Radiative Transfer, 109, 1527
- (62) Wilking B. A., Lebofsky M. J., Rieke G. H., 1982, AJ, 87, 695
- (63) Whittet, D. C. B. 1992, Dust in the Galactic Environment (Philadelphia: Inst. Phys. Publ.)
- (64) Whittet D. C. B., van Breda I. G., 1978, A&A, 66, 57
- (65) Yoshizawa M., 1978, PASJ, 30, 123
| P() | () | P() | () | |
| Our work Schmidt et al. (2002) | ||||
| Polarized standard stars | ||||
| 2008 November 8 9 | ||||
| BD+59389 | ||||
| 6.32 0.22 | 97.91.0 | 6.34 0.04 | 98.14 0.16 | |
| 6.86 0.16 | 97.30.7 | 6.70 0.01 | 98.09 0.07 | |
| 6.43 0.13 | 96.00.6 | 6.43 0.02 | 98.140.10 | |
| 5.86 0.11 | 97.00.5 | 5.80 0.02 | 98.260.11 | |
| BD+64 106 | ||||
| 5.73 0.21 | 97.31.0 | 5.51 0.09 | 97.150.47 | |
| 5.68 0.19 | 96.71.0 | 5.69 0.04 | 96.630.18 | |
| 5.12 0.17 | 97.40.9 | 5.15 0.10 | 96.740.54 | |
| 4.66 0.21 | 97.81.3 | 4.70 0.05 | 96.890.32 | |
| BD+64 106 | ||||
| 5.65 0.22 | 97.41.1 | 5.51 0.09 | 97.150.47 | |
| 5.49 0.20 | 96.91.0 | 5.69 0.04 | 96.630.18 | |
| 5.33 0.18 | 95.80.9 | 5.15 0.10 | 96.740.54 | |
| 4.48 0.22 | 98.71.4 | 4.70 0.05 | 96.890.32 | |
| HD204827 | ||||
| 5.68 0.23 | 58.01.2 | 5.65 0.02 | 58.200.11 | |
| 5.47 0.17 | 59.10.8 | 5.32 0.01 | 58.730.08 | |
| 5.19 0.14 | 61.50.8 | 4.89 0.03 | 59.100.17 | |
| 4.02 0.18 | 58.51.2 | 4.19 0.03 | 59.940.20 | |
| 2009 November 23 | ||||
| HD19820 | ||||
| 4.49 0.11 | 114.9 0.7 | 4.699 0.036 | 115.70 0.22 | |
| 4.89 0.09 | 114.2 0.5 | 4.787 0.028 | 114.93 0.17 | |
| 4.49 0.09 | 115.5 0.6 | 4.526 0.025 | 114.46 0.16 | |
| 4.06 0.16 | 115.3 1.0 | 4.081 0.024 | 114.48 0.17 | |
| HD25443 | ||||
| 5.19 0.09 | 134.6 0.5 | 5.232 0.092 | 134.28 0.51 | |
| 5.04 0.07 | 136.0 0.4 | 5.127 0.061 | 134.23 0.34 | |
| 4.19 0.09 | 134.8 0.6 | 4.249 0.041 | 134.21 0.28 | |
| BD+64106 | ||||
| 5.49 0.17 | 98.0 0.9 | 5.506 0.090 | 97.15 0.47 | |
| 5.41 0.11 | 96.1 0.6 | 5.150 0.098 | 96.74 0.54 | |
| 4.50 0.14 | 96.6 0.9 | 4.696 0.052 | 96.89 0.32 | |
| 2009 December 24 | ||||
| HD19820 | ||||
| 4.72 0.11 | 115.6 0.7 | 4.699 0.036 | 115.70 0.22 | |
| 4.79 0.08 | 115.1 0.5 | 4.787 0.028 | 114.93 0.17 | |
| 4.51 0.07 | 114.6 0.4 | 4.526 0.025 | 114.46 0.16 | |
| 3.97 0.09 | 115.7 0.6 | 4.081 0.024 | 114.48 0.17 | |
| HD25443 | ||||
| 5.12 0.09 | 134.0 0.5 | 5.232 0.092 | 134.28 0.51 | |
| 5.27 0.09 | 134.8 0.5 | 5.127 0.061 | 134.23 0.34 | |
| 5.00 0.08 | 134.5 0.4 | 4.734 0.045 | 133.65 0.28 | |
| 4.19 0.07 | 136.0 0.5 | 4.249 0.041 | 134.21 0.28 | |
| Unpolarized standard stars | ||||
| BD+323739 HD212311 | ||||
| q (%) | u (%) | q (%) | u (%) | |
| This wrok | ||||
| 0.089 | -0.093 | 0.138 | 0.001 | |
| 0.171 | -0.058 | -0.184 | -0.043 | |
| -0.072 | -0.078 | 0.042 | 0.016 | |
| 0.058 | -0.010 | -0.162 | -0.139 | |
| Id† | V (mag)‡ | () | () | () | () | ||||
|---|---|---|---|---|---|---|---|---|---|
| (1) | (2) | (3) | (4) | (5) | (6) | (7) | (8) | (9) | (10) |
| 1 | 10.19 | 2.35 0.14 | 160.3 1.6 | 2.52 0.14 | 159.5 1.5 | 2.44 0.14 | 154.9 1.5 | 1.93 0.18 | 155.6 2.5 |
| 2 | 11.29 | 2.90 0.23 | 157.0 2.1 | 3.15 0.24 | 160.8 1.9 | 3.06 0.22 | 156.6 2.0 | 2.38 0.29 | 164.4 3.4 |
| 3 | 11.16 | 2.31 0.16 | 157.3 1.9 | 2.30 0.15 | 163.1 1.8 | 2.27 0.15 | 162.1 1.9 | 2.28 0.18 | 159.1 2.2 |
| 5 | 13.41 | 2.22 0.46 | 156.8 5.6 | 2.79 0.42 | 158.0 4.1 | 2.30 0.41 | 155.5 5.0 | 1.95 0.47 | 151.7 6.6 |
| 9 | 12.71 | 2.54 0.34 | 160.8 3.7 | 2.76 0.31 | 165.7 3.0 | 2.87 0.29 | 162.9 2.8 | 2.03 0.32 | 156.2 4.3 |
| 10 | 13.69 | 2.15 0.24 | 161.9 3.1 | 2.03 0.23 | 157.2 3.0 | 2.28 0.23 | 162.9 2.7 | 2.10 0.26 | 158.6 3.3 |
| 13 | 12.46 | 2.28 0.52 | 153.3 6.3 | 1.95 0.46 | 157.4 6.3 | 3.01 0.44 | 157.9 4.0 | 2.38 0.45 | 161.8 5.3 |
| 15 | 13.02 | 2.66 0.42 | 156.4 4.2 | 3.08 0.48 | 165.8 3.7 | 2.43 0.44 | 161.9 4.9 | 2.90 0.54 | 162.6 5.2 |
| 33 | 12.27 | 2.11 0.35 | 161.9 4.3 | 2.52 0.38 | 168.0 3.5 | 2.04 0.34 | 159.2 4.5 | 2.15 0.44 | 160.2 5.6 |
| 48 | 11.01 | 1.83 0.27 | 166.0 4.0 | 1.81 0.19 | 165.6 2.7 | 1.32 0.18 | 164.2 3.7 | 1.59 0.17 | 165.2 2.9 |
| 59 | 12.10 | 2.32 0.38 | 156.8 4.4 | 2.79 0.40 | 159.6 3.6 | 2.95 0.36 | 155.4 3.4 | 2.38 0.46 | 161.6 5.3 |
| 62 | 12.69 | 2.06 0.31 | 162.8 4.2 | 2.59 0.29 | 159.3 3.0 | 2.44 0.27 | 158.0 3.1 | 1.91 0.29 | 163.9 4.2 |
| 72 | 12.53 | 1.40 0.43 | 172.4 8.2 | 1.16 0.31 | 174.7 7.2 | 1.87 0.34 | 162.0 5.0 | 1.81 0.39 | 162.2 5.8 |
| 73 | 10.77 | 1.66 0.18 | 169.2 2.7 | 1.89 0.19 | 169.2 2.3 | 1.72 0.17 | 167.8 2.7 | 1.36 0.23 | 173.9 4.5 |
| 82 | 12.94 | 2.67 0.52 | 154.5 5.2 | 3.25 0.48 | 153.8 4.1 | 3.56 0.44 | 150.4 3.4 | 2.82 0.53 | 165.3 5.2 |
| 92 | 11.72 | 1.27 0.26 | 169.5 5.5 | 1.54 0.25 | 162.3 4.2 | 1.47 0.30 | 160.5 5.5 | 1.28 0.34 | 158.4 7.1 |
| 98 | 13.28 | 3.67 0.56 | 158.9 4.3 | 3.40 0.51 | 157.3 4.1 | 2.96 0.58 | 157.3 5.4 | 3.05 0.60 | 165.1 5.4 |
| 106 | 12.32 | 2.97 0.29 | 160.3 2.7 | 2.66 0.26 | 159.0 2.7 | 2.64 0.25 | 159.4 2.6 | 2.54 0.28 | 162.7 3.0 |
| 108 | 13.88 | 2.55 0.59 | 154.8 6.4 | 3.67 0.54 | 159.3 4.0 | 2.94 0.52 | 165.9 4.9 | 2.26 0.58 | 157.9 7.0 |
| 115 | 13.66 | 2.72 0.48 | 162.4 4.9 | 2.80 0.43 | 160.3 4.1 | 2.98 0.40 | 163.0 3.8 | 2.36 0.43 | 158.3 4.9 |
| 123 | 13.23a | 3.65 0.42 | 163.6 3.2 | 3.57 0.40 | 160.9 3.0 | 4.04 0.39 | 157.3 2.7 | 2.31 0.42 | 158.1 5.0 |
| 134 | 13.09 | 2.91 0.40 | 160.4 3.8 | 3.38 0.38 | 167.1 3.0 | 2.74 0.37 | 155.2 3.7 | 3.07 0.41 | 164.6 3.7 |
| 139 | 11.98 | 2.20 0.27 | 161.4 3.3 | 2.76 0.25 | 160.4 2.5 | 2.82 0.31 | 160.5 3.1 | 2.46 0.42 | 160.6 4.7 |
| 140 | 12.39 | 2.65 0.33 | 165.1 3.4 | 2.48 0.30 | 158.5 3.3 | 2.87 0.37 | 157.9 3.6 | 2.30 0.49 | 154.9 5.8 |
| 141 | 11.45 | 2.49 0.23 | 164.3 2.4 | 2.53 0.25 | 160.1 2.5 | 2.40 0.23 | 157.9 2.7 | 2.48 0.31 | 162.6 3.5 |
| 149 | 10.14 | 2.69 0.13 | 157.2 1.3 | 2.68 0.11 | 149.8 1.1 | 2.87 0.12 | 149.9 1.2 | 2.33 0.15 | 144.4 1.7 |
| 168 | 12.25 | 2.12 0.33 | 160.1 4.3 | 2.36 0.32 | 154.3 3.7 | 2.01 0.40 | 146.8 5.4 | 2.36 0.44 | 152.6 5.1 |
| 196 | 12.33a | 1.82 0.33 | 164.4 4.9 | 2.45 0.29 | 159.7 3.1 | 2.17 0.25 | 164.5 3.1 | 2.07 0.26 | 167.8 3.4 |
| 197 | 11.87 | 2.33 0.35 | 162.4 4.1 | 2.13 0.22 | 161.3 2.7 | 1.99 0.16 | 163.3 2.2 | 2.00 0.14 | 164.7 1.9 |
| 199 | 13.40 | 1.82 0.46 | 157.3 6.8 | 3.77 0.40 | 154.9 2.9 | 2.59 0.37 | 146.2 3.9 | 2.16 0.36 | 148.2 4.6 |
| 209 | 12.63a | 2.72 0.29 | 165.7 3.0 | 1.80 0.29 | 168.2 4.2 | 1.84 0.29 | 167.9 4.3 | 1.79 0.34 | 163.4 5.2 |
| 213 | 14.52 | 2.98 0.78 | 143.6 7.2 | 3.99 0.69 | 165.2 4.7 | 2.72 0.62 | 159.7 6.3 | 2.84 0.64 | 173.6 6.2 |
| 215 | 14.23 | 3.42 0.69 | 156.8 5.6 | 2.72 0.63 | 164.8 6.1 | 2.55 0.58 | 157.7 6.3 | 2.02 0.62 | 154.4 8.4 |
| 219 | 13.97 | 3.82 0.63 | 156.7 4.6 | 3.38 0.56 | 161.8 4.4 | 4.12 0.51 | 155.0 3.5 | 2.67 0.55 | 159.5 5.6 |
| 222 | 14.16 | 2.32 0.65 | 169.0 7.6 | 2.61 0.60 | 154.7 6.3 | 2.33 0.59 | 164.4 6.9 | 2.31 0.66 | 164.0 7.9 |
| 228 | 12.50 | 2.12 0.35 | 162.0 4.5 | 3.13 0.32 | 162.6 2.8 | 2.71 0.39 | 155.7 4.0 | 2.37 0.50 | 158.8 5.9 |
| 301 | 10.94a | 3.16 0.13 | 160.0 1.2 | 3.08 0.13 | 160.9 1.2 | 2.92 0.13 | 161.9 1.3 | 2.96 0.16 | 162.5 1.4 |
| 307 | 11.68a | 3.14 0.19 | 159.7 1.7 | 3.48 0.19 | 159.9 1.5 | 3.33 0.19 | 159.3 1.6 | 3.02 0.22 | 158.8 2.0 |
| 310 | 12.59a | 2.33 0.42 | 160.4 4.9 | 2.00 0.29 | 167.6 3.8 | 1.71 0.23 | 166.9 3.6 | 1.53 0.21 | 163.6 3.7 |
| 320 | 12.43a | 2.59 0.29 | 164.7 3.1 | 2.88 0.29 | 161.6 2.8 | 2.65 0.36 | 165.8 3.7 | 2.38 0.46 | 160.6 5.3 |
| 327 | 11.62a | 1.25 0.22 | 161.7 4.7 | 1.01 0.21 | 164.3 5.3 | 1.06 0.26 | 156.0 6.5 | 1.05 0.34 | 168.4 8.5 |
| 329 | 11.95a | 1.20 0.26 | 152.7 5.7 | 0.84 0.24 | 160.5 7.4 | 1.03 0.32 | 148.4 8.0 | 1.49 0.42 | 164.5 7.6 |
| 355 | 13.46a | 1.61 0.53 | 154.8 8.8 | 1.94 0.47 | 168.2 6.6 | 2.01 0.53 | 168.7 7.2 | 2.01 0.64 | 170.8 8.6 |
| 356 | 14.35a | 2.57 0.80 | 160.7 8.6 | 2.01 0.67 | 164.0 8.7 | 3.23 0.58 | 157.3 5.0 | 1.85 0.60 | 150.6 8.7 |
†: Cuffey and Shapley (1937)
‡: Sharma et al. (2007)
a: Massey et al. (1995)
| Id.† | ∗ | ∗ | M | ||||||
|---|---|---|---|---|---|---|---|---|---|
| (J2000) | (J2000) | (mag)∗ | |||||||
| (1) | (2) | (3) | (4) | (5) | (6) | (7) | (8) | (9) | (10) |
| 49 | 102.03038 | 41.077494 | 10.56 | 0.24 | 0.16 | 1.07 0.17 | 16.16 4.28 | M | M (99) |
| 53 | 102.06064 | 41.112788 | 11.02 | 0.33 | 0.13 | 0.91 0.22 | 19.52 6.14 | M | M (99) |
| 55 | 102.06337 | 41.073019 | 8.89 | 0.98 | 0.69 | 1.00 0.08 | 13.77 2.10 | NM | M (99) |
| 56 | 102.06596 | 41.095871 | 11.43 | 1.24 | 1.19 | 1.04 0.25 | 6.23 6.39 | NM | NM (00) |
| 57 | 102.07032 | 41.130267 | 10.61 | 0.23 | 0.15 | 0.90 0.18 | 6.39 5.05 | M | M (99) |
| 58 | 102.07208 | 41.083118 | 9.45 | 0.12 | 0.06 | 0.73 0.10 | 9.65 3.53 | M | M (99) |
| 60 | 102.08048 | 41.041193 | 12.71 | 0.56 | 0.07 | 1.41 0.45 | 12.29 8.47 | M | M (99) |
| 71 | 102.11072 | 41.024925 | 11.16 | 0.53 | 0.05 | 0.78 0.23 | 24.01 7.43 | M | NM (00) |
| 74 | 102.1166 | 41.081101 | 9.54 | 1.10 | 1.03 | 0.56 0.11 | 22.08 4.62 | NM | NM (00) |
| 78 | 102.13344 | 41.108674 | 10.63 | 0.22 | 0.15 | 0.60 0.18 | 23.54 7.22 | M | M (99) |
| 79 | 102.14759 | 41.090775 | 10.30 | 0.17 | 0.11 | 0.67 0.15 | 12.83 5.60 | M | M (99) |
| 82 | 102.15634 | 41.10563 | 10.08 | 0.14 | 0.10 | 0.85 0.14 | 18.06 4.11 | M | M (99) |
| 86 | 102.17038 | 41.066299 | 8.62 | 0.22 | 0.15 | 0.93 0.07 | 19.43 1.92 | M | M (99) |
| 91 | 102.18262 | 41.086379 | 11.41 | 0.35 | 0.12 | 0.94 0.25 | 25.04 6.97 | M | M (99) |
†: Vasilevskis & Balz (1959)
∗: Pesch (1961) except star no # 60 for which magnitude, and
colours are taken from Yoshizawa (1978)
††: Present Work
†††: Vasilevskis & Balz (1959)
| Id.† | Mp †† | Mp ††† | |||||||
|---|---|---|---|---|---|---|---|---|---|
| (J2000) | (J2000) | (mag) | |||||||
| (1) | (2) | (3) | (4) | (5) | (6) | (7) | (8) | (9) | (10) |
| 1 | 72.783342 | 43.665161 | 13.50a | 1.61a | 1.68a | 2.44 0.35 | 165 4 | NM | - |
| 4 | 72.769500 | 43.671624 | 11.75b | 0.32b | 0.25b | 1.41 0.15 | 178 3 | M | M (65) |
| 7 | 72.824534 | 43.671985 | 12.25a | 0.30a | 0.24a | 1.14 0.18 | 165 4 | M | M (89) |
| 9 | 72.814747 | 43.680135 | - | - | - | 2.75 0.14 | 164 1 | NM | - |
| 12 | 72.749866 | 43.684928 | 13.01a | 0.24a | 0.31a | 1.25 0.27 | 170 6 | M | M (92) |
| 13 | 72.760895 | 43.676324 | 14.36b | 1.09b | 0.71b | 2.59 0.49 | 163 5 | NM | - |
| 14 | 72.750261 | 43.676335 | 12.79a | 0.51a | 0.28a | 1.25 0.26 | 170 5 | M | M (91) |
| 21 | 72.771228 | 43.648455 | 11.81b | 0.29b | 0.26b | 1.39 0.15 | 173 3 | M | M (82) |
| 22 | 72.779262 | 43.640397 | 14.00a | 0.54a | 0.38a | 2.33 0.42 | 171 5 | NM | M (86) |
| 27 | 72.816757 | 43.656291 | 13.87b | 0.51b | 0.21b | 2.10 0.39 | 175 5 | NM | NM (35) |
| 35 | 72.804006 | 43.700468 | 12.50c | 0.37c | 0.25c | 1.15 0.21 | 170 5 | M | M (91) |
| 37 | 72.790902 | 43.708346 | 10.93b | 0.34b | 0.34b | 1.24 0.10 | 174 2 | M | M (90) |
| 47 | 72.754574 | 43.703638 | - | - | - | 3.18 0.54 | 160 5 | NM | - |
| 55 | 72.724155 | 43.662572 | 11.06b | 1.23b | 1.00b | 1.71 0.11 | 169 2 | M | M (71) |
| 56 | 72.737611 | 43.657761 | 12.66b | 0.35b | 0.26b | 1.40 0.23 | 177 4 | M | M (91) |
| 67 | 72.857380 | 43.672892 | - | - | - | 1.21 0.38 | 171 8 | M | M (92) |
| 68 | 72.849878 | 43.675125 | - | - | - | 1.57 0.27 | 168 5 | M | M (87) |
| 75 | 72.832061 | 43.704486 | 11.25a | 1.06a | 0.83a | 1.47 0.13 | 173 2 | M | M (92) |
| 76 | 72.823740 | 43.720916 | - | - | - | 1.53 0.36 | 177 6 | M | M (87) |
| 77 | 72.814271 | 43.709793 | 12.84c | 0.49c | 0.25c | 1.40 0.25 | 174 5 | M | M (65) |
| 79 | 72.765348 | 43.727229 | 13.75a | 0.54a | 0.50a | 2.06 0.38 | 165 5 | NM | - |
| 87 | 72.700196 | 43.654016 | - | - | - | 4.09 0.80 | 171 5 | NM | - |
| 90 | 72.712849 | 43.643313 | 13.03a | 0.51a | 0.30a | 1.47 0.29 | 170 5 | M | NM (17) |
| 113 | 72.735822 | 43.721862 | 12.97a | 0.53a | 0.27a | 1.45 0.29 | 175 5 | M | M (84) |
| 154 | 72.780622 | 43.746898 | - | - | - | 1.26 0.31 | 172 6 | M | - |
| 158 | 72.719637 | 43.739690 | 14.79a | 0.73a | 0.13a | 1.78 0.50 | 166 7 | M | - |
| 164 | 72.691065 | 43.720635 | - | - | - | 0.97 0.27 | 26 7 | NM | NM (00) |
†: Larsson-Leander (1957)
a: Hoag et al. (1961) Publ. Us. Nav. Obs. XVII part VII, 347
b: Purgathofer (1964)
c: Hoag et al. (1961)
††: Present Work
†††: Dias et al. (2006)
| Id.† | ∗ | ∗ | Mp †† | Mp ††† | ||||||
| (J2000) | (J2000) | (mag)∗ | ||||||||
| (1) | (2) | (3) | (4) | (5) | (6) | (7) | (8) | (9) | (10) | |
| 13 | 84.063492 | 34.120250 | 10.78 | 0.12 | -0.26 | 1.12 0.17 | 160 4 | M | M (94) | |
| 16 | 84.065508 | 34.143746 | 8.86a | -0.00a | -0.66 a | 1.17 0.07 | 159 2 | M | M (94) | |
| 17 | 84.060257 | 34.139917 | 12.40 | 0.25 | 0.18 | 1.16 0.35 | 162 8 | M | M (94) | |
| 23 | 84.095740 | 34.175955 | 8.96a | 0.01a | -0.68 a | 1.12 0.07 | 162 2 | M | M (94) | |
| 33 | 84.118160 | 34.122944 | 11.85 | 0.12 | -0.07 | 1.15 0.27 | 155 6 | M | M (94) | |
| 38 | 84.099176 | 34.099402 | 9.92a | 0.05a | -0.49a | 1.17 0.11 | 156 2 | M | M (94) | |
| 41 | 84.083418 | 34.103419 | 12.37 | 0.19 | 0.14 | 1.28 0.35 | 160 7 | M | M (94) | |
| 44 | 84.047893 | 34.118557 | 11.35 | 0.09 | -0.36 | 1.38 0.22 | 163 4 | M | M (94) | |
| 55 | 84.081130 | 34.204218 | 11.61 | 0.10 | -0.31 | 1.44 0.24 | 147 5 | NM | M (94) | |
| 56 | 84.087224 | 34.211974 | 12.39 | 0.46 | 0.35 | 1.15 0.26 | 157 6 | M | M (93) | |
| 61 | 84.132976 | 34.179480 | 9.14a | 0.01a | -0.66a | 0.81 0.08 | 155 2 | NM | M (94) | |
| 77 | 84.069337 | 34.083562 | 12.10 | 0.17 | 0.06 | 1.50 0.31 | 162 6 | NM | M (94) | |
| 87 | 83.996719 | 34.174535 | 10.62 | 0.07 | 0.95 | 1.34 0.16 | 161 3 | M | M (94) | |
| 91 | 84.040637 | 34.193293 | 10.34 | 0.01 | -0.50 | 1.25 0.14 | 165 3 | M | M (94) | |
| 92 | 84.024453 | 34.201113 | 10.93 | 0.03 | -0.49 | 1.16 0.18 | 164 4 | M | M (94) |
†: Boden (1951)
∗: Sharma et al. (2006)
a: Johnson H.L., Morgan W.W. (1953)
††: Present Work
†††: Dias et al. (2006)
| Id.† | (∗) | (∗) | Mp†† | Mp††† | |||||
| (J2000) | (J2000) | (mag)∗ | |||||||
| (1) | (2) | (3) | (4) | (5) | (6) | (7) | (8) | (9) | (10) |
| 11 | 82.004547 | 34.450581 | 11.50 | 0.13 | 0.17 | 1.57 0.14 | 163 2 | NM | M (66) |
| 12 | 82.009061 | 34.404500 | 11.76 | -0.36 | 0.28 | 2.41 0.15 | 165 2 | M | M (66) |
| 13 | 82.018190 | 34.489546 | 11.71 | -0.47 | 0.30 | 2.45 0.15 | 167 2 | M | M (64) |
| 16 | 82.038176 | 34.473935 | 11.89 | -0.40 | 0.29 | 2.41 0.16 | 151 2 | M | M (65) |
| 19 | 82.058027 | 34.438897 | 13.01 | 1.22 | 1.40 | 2.17 0.28 | 157 4 | NM | M (77) |
| 141 | 82.082569 | 34.420441 | 12.19 | -0.24 | 0.51 | 2.60 0.19 | 165 2 | M | M (57) |
| 160 | 82.002940 | 34.493490 | 12.63 | 0.15 | 0.60 | 1.62 0.23 | 163 4 | NM | NM (02) |
| 173 | 82.082563 | 34.455984 | 12.81 | 0.37 | 0.31 | 1.60 0.25 | 159 4 | NM | NM (47) |
| 181 | 82.064303 | 34.423842 | 12.87 | -0.32 | 0.33 | 2.39 0.25 | 158 3 | M | M (68) |
| 208 | 82.040118 | 34.446178 | 13.18 | -0.14 | 0.30 | 2.62 0.28 | 162 3 | M | M (74) |
| 211 | 81.996346 | 34.444053 | 13.21 | 0.17 | 0.28 | 1.93 0.30 | 159 4 | NM | NM (19) |
| 218 | 82.004829 | 34.385705 | 13.29 | -0.02 | 0.34 | 2.61 0.31 | 162 3 | M | NM (43) |
| 231 | 82.028692 | 34.394823 | 13.36 | -0.14 | 0.31 | 3.03 0.33 | 157 3 | M | M (72) |
| 258 | 81.969263 | 34.389477 | 13.53 | 0.24 | 0.68 | 2.57 0.35 | 161 4 | M | NM (00) |
| 275 | 82.090470 | 34.409075 | 13.69 | -0.17 | 0.62 | 2.37 0.39 | 136 5 | ? | - |
| 294 | 82.003915 | 34.403745 | 13.81 | 0.38 | 0.46 | 2.72 0.40 | 163 4 | M | M (52) |
| 320 | 81.993454 | 34.470836 | 13.93 | 0.27 | 0.62 | 2.20 0.45 | 156 6 | M | NM (01) |
| 325 | 81.962444 | 34.428255 | 13.96 | -0.08 | 0.82 | 4.18 0.44 | 165 3 | ? | M (71) |
| 333 | 82.066055 | 34.399693 | 14.00 | 0.32 | 0.59 | 2.40 0.45 | 163 5 | M | - |
| 365 | 82.001149 | 34.457243 | 14.18 | 0.37 | 0.41 | 2.17 0.46 | 165 6 | NM | - |
| 425 | 81.991192 | 34.498474 | 14.39 | 0.19 | 0.55 | 2.36 0.61 | 158 7 | M | NM (04) |
†: Mayer (1964)
∗: Jose et al. (2008)
††: Present Work
†††: Dias et al. (2006)
| Id.† | ‡ | () | () | †† | ††† | ||||
|---|---|---|---|---|---|---|---|---|---|
| (mag) | (J2000) | (J2000) | |||||||
| (1) | (2) | (3) | (4) | (5) | (6) | (7) | (8) | (9) | (10) |
| 1 | 0.53 | 80.683340 | 33.440739 | 2.50 0.08 | 0.53 0.04 | 0.74 | 1.31 | M | M (78) |
| 2 | 0.54 | 80.686558 | 33.443501 | 3.11 0.13 | 0.54 0.05 | 0.69 | 1.23 | M | M (79) |
| 3 | 0.45 | 80.706563 | 33.447926 | 2.41 0.08 | 0.58 0.04 | 0.91 | 1.38 | M | M (78) |
| 5 | 0.46 | 80.725969 | 33.445042 | 2.52 0.26 | 0.52 0.10 | 0.59 | 0.47 | M | NM (9) |
| 9 | 0.52 | 80.706864 | 33.425991 | 2.76 0.18 | 0.53 0.07 | 0.89 | 1.25 | M | M (75) |
| 10 | 0.46 | 80.705199 | 33.428371 | 2.61 0.28 | 0.70 0.14 | 1.03 | 0.41 | M | NM (0) |
| 13 | 0.52 | 80.692334 | 33.422447 | 2.80 0.22 | 0.62 0.10 | 0.54 | 0.54 | M | M (79) |
| 15 | 0.48 | 80.696872 | 33.418720 | 2.89 0.25 | 0.57 0.10 | 0.83 | 0.92 | M | M (61) |
| 33 | 0.50 | 80.688066 | 33.406540 | 2.32 0.20 | 0.56 0.10 | 0.62 | 1.27 | M | M (71) |
| 48 | 0.20a | 80.699353 | 33.476135 | 1.76 0.14 | 0.51 0.06 | 1.46 | 0.17 | NM | M (60) |
| 59 | 0.47 | 80.741815 | 33.443459 | 2.26 0.13 | 0.60 0.07 | 0.72 | 0.98 | M | M (79) |
| 62 | 0.47 | 80.739711 | 33.433380 | 2.41 0.16 | 0.56 0.07 | 0.82 | 0.65 | M | M (74) |
| 72 | 0.20a | 80.699203 | 33.368629 | 1.86 0.40 | 0.87 0.23 | 0.82 | 1.05 | NM | NM (27) |
| 73 | 0.27 | 80.688608 | 33.371365 | 1.80 0.11 | 0.53 0.06 | 0.58 | 0.50 | NM | M (79) |
| 82 | 0.70 | 80.654111 | 33.386971 | 3.32 0.26 | 0.63 0.10 | 0.62 | 0.87 | M | M (77) |
| 92 | 0.44 | 80.668795 | 33.491486 | 1.48 0.15 | 0.59 0.12 | 0.31 | 0.58 | NM | M (74) |
| 98 | 0.68 | 80.722431 | 33.509064 | 3.55 0.35 | 0.50 0.09 | 0.56 | 0.49 | M | NM (3) |
| 106 | 0.52 | 80.751932 | 33.496628 | 2.87 0.16 | 0.53 0.06 | 0.90 | 0.49 | M | M (74) |
| 108 | 0.46 | 80.765402 | 33.487503 | 3.13 0.34 | 0.52 0.10 | 0.97 | 0.56 | ? | NM (45) |
| 115 | 0.44 | 80.767404 | 33.470600 | 2.90 0.24 | 0.56 0.09 | 0.43 | 0.38 | M | - |
| 123 | 0.45 | 80.782318 | 33.467247 | 3.77 0.27 | 0.49 0.06 | 1.56 | 0.65 | ? | - |
| 134 | 0.48 | 80.744271 | 33.400803 | 3.19 0.21 | 0.57 0.08 | 0.92 | 1.49 | M | M (79) |
| 139 | 0.40 | 80.723816 | 33.392075 | 2.77 0.19 | 0.65 0.08 | 0.57 | 0.10 | M | M (78) |
| 140 | 0.41 | 80.719063 | 33.386875 | 2.72 0.19 | 0.57 0.09 | 0.75 | 0.67 | M | M (72) |
| 141 | 0.42 | 80.717616 | 33.384277 | 2.60 0.13 | 0.57 0.06 | 0.67 | 0.80 | M | M (78) |
| 149 | 0.77 | 80.665351 | 33.371723 | 2.81 0.07 | 0.56 0.03 | 1.35 | 2.43 | M | M (80) |
| 168 | 0.53 | 80.643091 | 33.489128 | 2.34 0.20 | 0.60 0.10 | 0.66 | 0.81 | M | M (76) |
| 196 | 0.83∗ | 80.788871 | 33.500652 | 2.26 0.15 | 0.61 0.08 | 0.73 | 1.21 | ? | M (79) |
| 197 | 0.20a | 80.781174 | 33.497807 | 2.19 0.13 | 0.57 0.06 | 0.96 | 0.60 | NM | NM (0) |
| 199 | 0.73 | 80.781643 | 33.477089 | 2.82 0.24 | 0.54 0.08 | 2.19 | 0.98 | ? | - |
| 209 | 0.25∗ | 80.823050 | 33.436195 | 2.43 0.30 | 0.41 0.06 | 1.50 | 0.46 | NM | M (80) |
| 213 | 0.53∗ | 80.798357 | 33.402302 | 3.41 0.46 | 0.51 0.11 | 0.84 | 1.45 | ? | NM (22) |
| 215 | 0.47 | 80.789509 | 33.406975 | 3.23 0.67 | 0.41 0.10 | 0.40 | 0.97 | M | M (81) |
| 219 | 0.48 | 80.782304 | 33.385307 | 3.81 0.36 | 0.52 0.08 | 1.11 | 0.78 | M | M (77) |
| 222 | 0.39 | 80.770831 | 33.389034 | 2.54 0.33 | 0.57 0.15 | 0.21 | 1.16 | M | M (78) |
| 228 | 0.40 | 80.741278 | 33.368721 | 2.81 0.21 | 0.62 0.09 | 1.17 | 0.66 | M | M (77) |
| 301 | 0.39∗ | 80.831142 | 33.452225 | 3.21 0.07 | 0.55 0.03 | 1.62 | 0.69 | M | M (78) |
| 307 | 0.42∗ | 80.854608 | 33.435932 | 3.44 0.10 | 0.57 0.04 | 0.28 | 0.28 | M | M (79) |
| 310 | 0.20a | 80.847118 | 33.419819 | 2.15 0.30 | 0.45 0.07 | 0.49 | 0.74 | NM | M (84) |
| 320 | 0.46∗ | 80.802256 | 33.366192 | 2.81 0.17 | 0.55 0.08 | 0.25 | 0.56 | M | M (65) |
| 327 | 0.20∗ | 80.680573 | 33.288097 | 1.16 0.14 | 0.50 0.13 | 0.68 | 0.60 | NM | M (75) |
| 329 | 0.19∗ | 80.656141 | 33.294849 | 1.15 0.20 | 0.67 0.20 | 1.22 | 0.83 | NM | M (76) |
| 355 | 0.20a | 80.899315 | 33.423325 | 2.05 0.35 | 0.68 0.20 | 0.09 | 0.53 | NM | NM (48) |
| 356 | 0.20a | 80.853457 | 33.408504 | 2.59 0.36 | 0.57 0.16 | 1.18 | 0.75 | NM | - |
†: Cuffey and Shapley (1937)
‡: To estimate values, UBV photometric data has been taken from Sharma et al. (2007)
∗: To estimate values, UBV photometric data has been taken from Massey et al. (1995)
a: The foreground stars with =0.20 mag from ZAMS fitting
††: Present Work
†††: Dias et al. (2006)
| Cluster Id | No of stars | ||
|---|---|---|---|
| Members | |||
| NGC 2281 | 0.90.2 | 176 | 11 |
| NGC 1664 | 1.40.2 | 1724 | 18 |
| NGC 1960 | 1.20.1 | 1603 | 12 |
| Stock 8 | 2.50.2 | 1614 | 13 |
| NGC 1893 | 2.80.4 | 1604 | 28 |
| Non-Members | |||
| NGC 2281 | 0.90.3 | 148 | 3 |
| NGC 1664 | 2.50.9 | 17114 | 9 |
| NGC 1960 | 1.20.4 | 1557 | 3 |
| Stock 8 | 1.80.3 | 1613 | 6 |
| NGC 1893 | 1.60.4 | 1664 | 11 |