Extreme AGN Feedback and Cool Core Destruction in the X-ray Luminous Galaxy Cluster MACS J1931.8-2634
Abstract
We report on a deep, multiwavelength study of the galaxy cluster MACS J1931.8-2634 using Chandra X-ray, Subaru optical, and VLA 1.4 GHz radio data. This cluster () harbors one of the most X-ray luminous cool cores yet discovered, with an equivalent mass cooling rate within the central is 700 . Unique features observed in the central core of MACS J1931.8-2634 hint to a wealth of past activity that has greatly disrupted the original cool core. The X-ray and optical data suggest oscillatory motion of the cool core along a roughly north-south direction. We also observe a spiral of relatively cool, dense, X-ray emitting gas connected to the cool core, as well as highly elongated intracluster light (ICL) surrounding the cD galaxy. For a cluster with such a high nominal cooling rate, this cluster is missing the central metallicity peak almost always seen in cool core clusters, which suggests bulk transport of cool gas out to large distances from the center. Extended radio emission is observed surrounding the central AGN, elongated in the east-west direction, spatially coincident with X-ray cavities. The power input required to inflate these ‘bubbles’ is estimated from both the X-ray and radio emission to reside between 4 – 14 , putting it among the most powerful jets ever observed. This combination of a powerful AGN outburst and bulk motion of the cool core have resulted in two X-ray bright ridges to form to the north and south of the central AGN at a distance of approximately 25 kpc. The northern ridge has spectral characteristics typical of cool cores: it contains low temperature, high density, metal rich gas and is consistent with being a remnant of the cool core after it was disrupted by the AGN and bulk motions. It is also the site of H filaments and young stars. The X-ray spectroscopic cooling rate associated with this ridge is 165 , which agrees with the estimate of the star formation rate from broad-band optical imaging (170 ). MACS J1931.8-2634 appears to harbor one of most profoundly disrupted low entropy cores observed in a cluster, and offers new insights into the survivability of cool cores in the context of hierarchical structure formation.
keywords:
X-rays: galaxies: clusters – galaxies: clusters: individual: MACS J1931.8-2634 – galaxies: clusters: general – galaxies: active – galaxies: cooling flows1 Introduction
The relatively cool and dense gas at the centers of many galaxy clusters emits copious X-ray radiation by thermal bremsstrahlung and line emission. In the absence of external sources of heating, this high emission should lead to very rapid cooling () and very high rates of mass deposition onto the central cluster galaxy (up to 1000 ), in turn causing very high star formation rates and strong line emission around 0.5-1.0 keV (e.g. Fabian & Nulsen, 1977; Cowie & Binney, 1977; Peterson & Fabian, 2006; McNamara & Nulsen, 2007). The lack of such obvious observational signatures (e.g. Peterson et al., 2001, 2003) provides compelling evidence that some central source of heating must be present. The most plausible source of heating is feedback from the central Active Galactic Nucleus (AGN). Large X-ray cavities filled with radio plasma are clearly seen in many systems, which provide an expected source of heating and turbulence (e.g. Brüggen & Kaiser, 2002). In systems such as the Perseus, Virgo, Centaurus, and Hydra A Clusters (e.g. Fabian et al., 2003; Forman et al., 2005; Nulsen et al., 2005; Fabian et al., 2006; Forman et al., 2007; Sanders & Fabian, 2007, 2008; Simionescu et al., 2009, Million et al. submitted), heating of the ICM has been argued to involve sound waves and weak shocks. Many questions remain as to the precise processes by which central AGN activity suppresses cooling flows, and the extent to which these feedback processes require finely tuned parameters. More ambiguous still are the nature and energetics of feedback mechanisms at higher redshifts, as only a few systems with such high classical cooling rates have been studied in detail (Schindler et al., 1997; Allen, 2000; Kitayama et al., 2004; Böhringer et al., 2005; Ogrean et al., 2010).
The galaxy cluster MACS J1931.8-2634 is an extreme example of a cluster with a rapidly cooling core, making it an ideal system to test the limits of feedback mechanisms in galaxy clusters. In a short 12 ks Chandra observation of MACS J1931.8-2634 taken in October of 2002 (Allen et al., 2004, 2008), X-ray cavities were detected surrounding a bright central AGN. The physical size of these cavities (25 ) is similar to those observed in the nearby Perseus Cluster (Fabian et al., 2003, 2006). Indeed, with its luminous cool core, visible central point source, and very large apparent cooling rate, MACS J1931.8-2634 is in many ways a higher redshift analog to the Perseus Cluster. Deeper observations of MACS J1931.8-2634 were taken with Chandra in August of 2008, increasing the total clean exposure to 100 . The combined X-ray data are presented for the first time here, and are complimented with optical (Subaru) and radio (VLA) observations. Our goals are to acquire a better understanding of the thermodynamic structure around the central AGN and the extent to which feedback from the central AGN counteracts this extreme cooling flow.
The structure of this paper is as follows: Section 2 discusses the reduction of the Chandra data. Section 3 discusses the imaging analysis of the X-ray data, while Section 4 presents results on the mass profile and cooling flow of MACS J1931.8-2634. Section 5 discusses the spectral analysis. Sections 6 and 7 present the optical and radio data, respectively. Calculations of the energetics associated with the central AGN are discussed in Section 8, and the results are discussed and summarized in Section 9. Throughout this paper, a CDM cosmology is assumed with , , and . At the redshift of MACS J1931.8-2634 (), 1 arcsec corresponds to 4.926 kpc.
2 Chandra Data Reduction and Processing
Two Chandra observations of MACS J1931.8-2634 were performed using the Advanced CCD Imaging Spectrometer (ACIS) in October 2002 and August 2008. The standard level-1 event lists produced by the Chandra pipeline processing were reprocessed using the CIAO (version 4.1.2) software package, including the appropriate gain maps and calibration products (CALDB version 4.1.2). Bad pixels were removed and standard grade selections were applied to the event lists. Both observations were taken in VFAINT mode, and the additional information available in this mode was used to improve the rejection of cosmic ray events. The data were cleaned to remove periods of anomalously high background using the standard energy ranges and binning methods recommended by the Chandra X-ray Center. The net exposure times after processing are summarized in Table 1.
| Obs # | Observation Date | Detector | Exposure Time (ks) |
|---|---|---|---|
| 3282 | October 20 2002 | ACIS-I | 10.0 |
| 9382 | August 21 2008 | ACIS-I | 89.5 |
3 X-ray Imaging Analysis
3.1 Surface Brightness Profiles
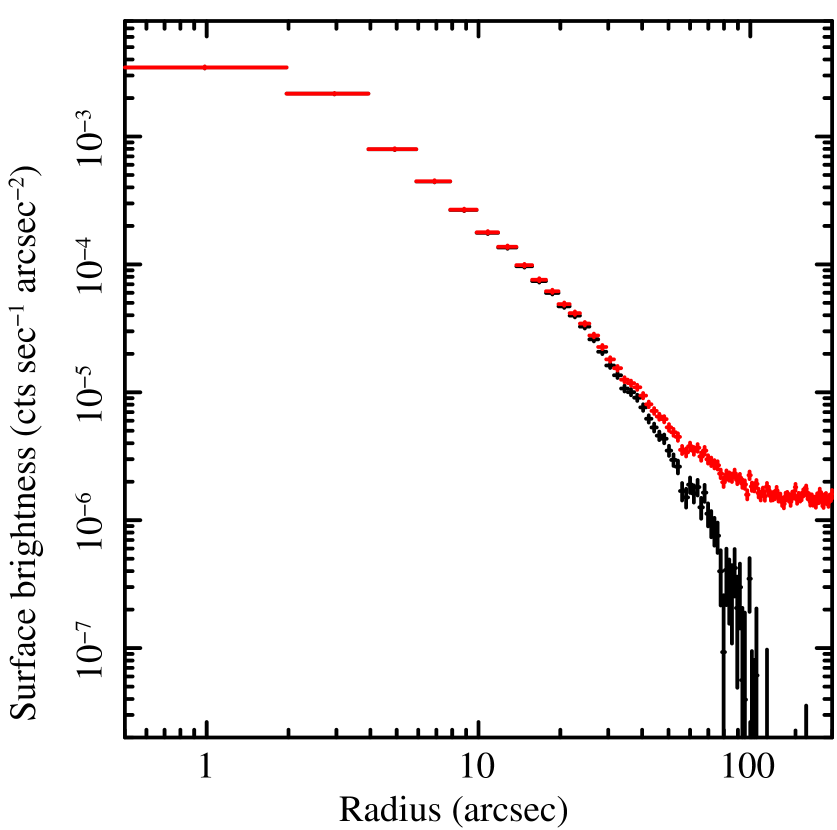
Flat-fielded images were first created in the energy range from 0.7-2.0 keV for each of the Chandra observations. This energy range was chosen to minimize the impact of astrophysical and instrumental background components. All subsequent imaging analysis was performed in this energy range. Surface brightness profiles were produced from these flat-fielded images centered on the central AGN (). Each surface brightness profile was fit with a King plus constant model in the range of 50 to 400 arcsec from the central AGN. The King plus constant model is explicitly given by the form
| (1) |
The best-fit constant for each observation was subtracted from each surface brightness profile, and Fig. 1 shows the exposure-time weighted average of the two surface brightness profiles. Over the radial range of 10-250 arcsec, the profile can be approximately described by a King model with and .
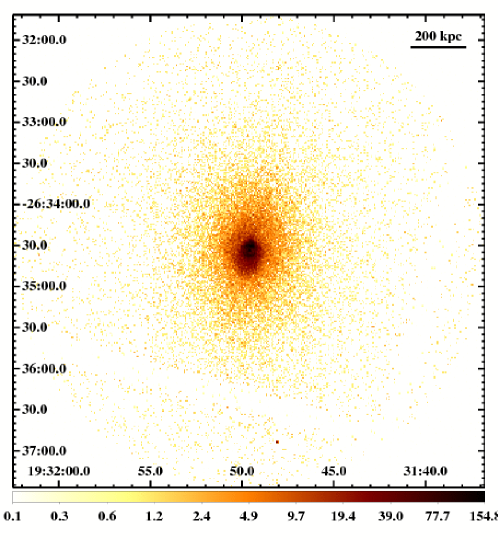
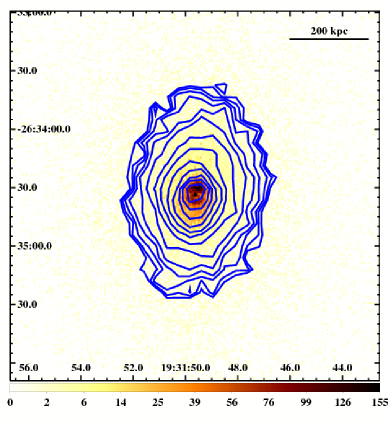
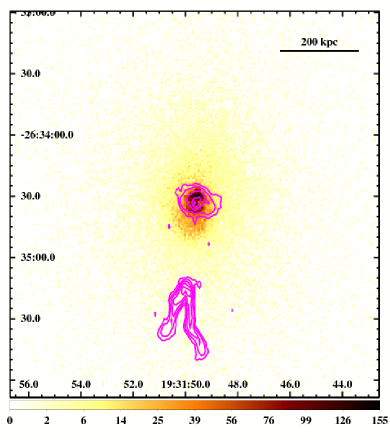
The background level determined from the surface brightness analysis described above was subtracted from each flat-fielded image on a pixel-by-pixel basis. These two images were reprojected into a common aspect solution and combined. This combined image, which is used in all subsequent imaging analysis, is shown in Fig. 2.
3.2 Background Subtracted, Flat-Fielded Image
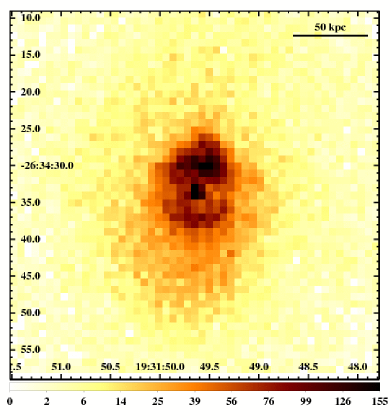
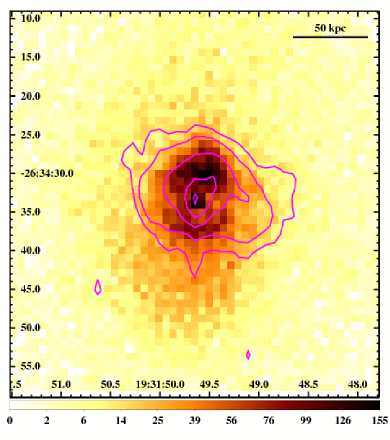
On scales larger than 100 , MACS J1931.8-2634 exhibits a general elliptical symmetry, with the major axis aligned along the approximately north-south direction. There are asymmetries at these scales, however, that can be more readily observed by overlaying the X-ray surface brightness contours, seen in Fig. 2. The isophotes are clearly not concentric, and the centroid appears to shift north and south of the central AGN with an amplitude as large as 20-30 . Inside the central 100 kpc, seen in Fig. 2, the morphology becomes considerably more complex. The bright central point source is surrounded by two bright ridges to the north and south. The northern ridge is brighter and has a relatively sharp boundary to the north, while the southern ridge is trailed by diffuse emission extending further to the south. These features, as well as the varying isophote centroids on large scales are indicative of past oscillations of the core, which currently appears to be moving to the north.
3.3 Substructure Analysis
3.3.1 Bandpass Filtering
In order to better resolve small scale structures around the center of the cluster, a high-frequency bandpass filter was applied to the image shown in Fig. 2. The functional form of the filter is given as
| (2) |
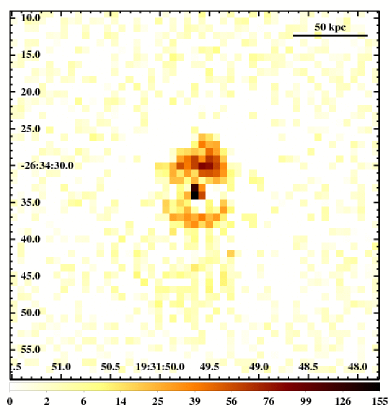
We have set the scale length arcsec. The transformed image is shown in Fig. 3, and shows the central AGN as well as the ridges to the north and south more clearly. Other features more apparent in this image are depressions in the X-ray brightness immediately to the east and west of the central AGN. Nearby systems show clear cavities in the X-ray brightness near the central AGN, similar in shape to these (e.g. Fabian et al., 2003; Bîrzan et al., 2004). Unlike the cavities in those systems, however, there is no evidence in Fig. 3 as to where the outer boundary of these cavities might lie.
3.3.2 Two-Dimensional Surface Brightness Modeling
The X-ray image of Fig. 2 was also fit with a two-dimensional elliptical beta model of the form
| (3) |
where is the central normalization, is the core radius, and is the power index. The term is given as
which gives the distance of any point in the image from a fixed center with an ellipticity . The position angle, , was also a free parameter in the fit. Since the image has already been background subtracted, no further considerations for the background were included in the fit. The best fit parameters for this model are , , degrees and .
The fit was then subtracted from the image, and the residuals adaptively smoothed. The smoothed residuals image is shown in Fig. 3. With the elliptical model subtracted, a spiral pattern beginning just east of the central AGN emerges. Such a pattern is expected to arise in off-axis mergers (e.g. Ascasibar & Markevitch, 2006, see also Section 9).
4 Image Deprojection Analysis
An image deprojection analysis of MACS J1931.8-2634 was undertaken following the manner described in Allen et al. (2008) (see also Schmidt & Allen, 2007). In brief, the azimuthally averaged X-ray surface brightness profile (centered on the central AGN) and the deprojected temperature profile are combined to simultaneously determine the X-ray emitting gas mass and total mass profiles of the cluster. We assume that the dark+luminous mass distribution follows the model of Navarro et al. (1995, 1997) (hereafter NFW profile)
| (4) |
where is the mass density, is the critical density for closure at redshift , is the scale radius, is the concentration parameter (with ) and . The length scale is defined such that the enclosed mean mass density is times the critical density of the Universe at the redshift of the cluster. For a given scale radius and concentration parameter, a model temperature profile can be calculated and compared with the observed deprojected temperature profile. The observed deprojected temperature profile was azimuthally averaged and binned into annular regions with roughly 5,000 counts in each (see Section 5). The mass profile parameters were stepped over a range of values to determine best-fit values and uncertainties using a minimization technique. This analysis assumed hydrostatic equilibrium and spherical symmetry, both of which are obviously not true in the vicinity of the central AGN. To account for these assumptions, the data for the central 50 kpc have been statistically down-weighted by adding 30% systematic uncertainties to the measured temperatures.
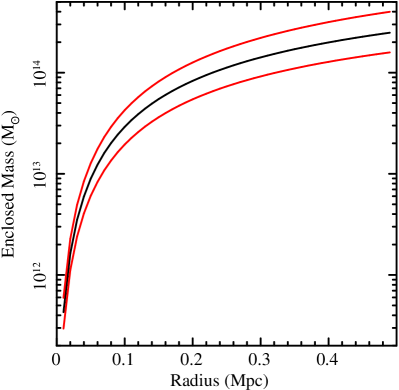
Our best fit NFW profile has a scale radius of , a concentration parameter of , and an equivalent velocity dispersion (Allen et al., 2002) . The integrated mass profile is shown in Fig. 4. The enclosed mass within is .
The bolometric luminosity, cooling time, and equivalent mass deposition rate profiles have also been determined using the calculations described in detail in White et al. (1997). These are shown in Figs. 4, 4, and 4 respectively. These profiles show that there is rapid cooling within the central 50 kpc. Within this region and in the absence of of balancing heat sources, a cooling flow with an equivalent mass deposition rate of 700 would be expected. The bolometric luminosity within this region is 1 , and the cooling time is less than 1 Gyr.


5 Spectral Analysis
5.1 Methods
The Chandra observations of MACS J1931.8-2634 are sufficiently deep for high signal-to-noise spectra to be extracted from relatively small regions. This enables us to carry out detailed, spatially resolved measurements of the thermodynamic quantities of the ICM. All spectral analysis was carried out using XSPEC (Arnaud, 2004, version 12.5). The backgrounds for all spectral analysis were extracted directly from the science observations, specifically from a region roughly the same distance from the center of the detector as the cluster, but on the diagonally opposite chip. The background regions are devoid of point sources and cluster emission.
5.1.1 Regions of Interest
The spectral structure of MACS J1931.8-2634 was measured in both one-dimensional radial profiles and two-dimensional maps. In addition, the spectra of several regions of interest identified from the imaging analysis (specifically the central AGN and bright central northern and southern ridges) were also investigated in detail. To account for contamination by the central AGN, the 2.5 arcsec radius region surrounding the central AGN was excluded from the spectral profiles and maps. Region specific response matrices and ancillary response files were created for all spectra.
Spatially resolved spectral maps for the cluster were extracted in regions determined by the contour binning algorithm of Sanders (2006), which creates bins of equivalent signal-to-noise, following contours in surface brightness. Regions were selected to have a signal-to-noise of 30, resulting in approximately counts per bin.
Azimuthally averaged spectral profiles were measured in annular regions with nearly equal numbers of counts. Initially radial profiles were made using annular bins that each contain roughly 3,000 counts. Measuring the metallicity requires data with a higher signal-to-noise, so we also carried out a similar analysis using annular bins with roughly 10,000 counts each. The chosen center for all annuli was the location of the central AGN. The spectral properties of each annular region were measured both in projection and deprojection. Deprojection was implemented using the PROJCT mixing model in XSPEC.
5.1.2 Modeling the Emission
All spectral regions were initially modeled as a single temperature optically thin plasma using the MEKAL code of Kaastra & Mewe (1993) incorporating the Fe-L calculations of Liedahl et al. (1995) and the photoelectric absorption models of Balucinska-Church & McCammon (1992). We used the determinations of solar element abundances given by Anders & Grevesse (1989). The abundances of metals () were assumed to vary with a common ratio with respect to the Solar values. The single-temperature plasma model has three free parameters: the temperature (), the metallicity (), and normalization ().
In each region, the spectral analysis assumed a fixed Galactic absorption column of (Kalberla et al., 2005), consistent with the value measured directly from the X-ray spectra. The modified Cash statistic in XSPEC (Cash, 1979; Arnaud, 2004) was minimized to determine the best fit model parameters and uncertainties. All uncertainties given are 68% () confidence intervals, unless otherwise noted. In the analysis of the bright ridges to the north and south of the AGN, the spectroscopic model included an additional MKCFLOW component, appropriate for a scenario where gas is assumed to cool at constant pressure from an upper temperature down to a lower temperature. The upper temperature and metallicity of the MKCFLOW component were tied to their corresponding MEKAL components, and the low temperature was fixed to .
5.1.3 Thermodynamic Quantities
Several thermodynamic quantities can be calculated directly from the best fit MEKAL model parameters. The electron density (), pressure (), and entropy () of the ICM are derived from the MEKAL temperature () and normalization () as
| (5) |
| (6) |
| (7) |
where the cosmological value of the angular diameter distance is 1016 Mpc at the cluster redshift. The volume of the region, , is given in units of . If the region had not been deprojected (in the case of the thermodynamic maps), the volume of the region was estimated as
| (8) |
where are the maximum and minimum angular distances of any point in the region to the center of the cluster, respectively, and is the solid-angle extent of the region in the sky (Henry et al., 2004; Mahdavi et al., 2005). If the spectrum had been fully deprojected (true for the annular profiles), the volume was calculated as
| (9) |
Since the uncertainties on the temperature are considerably larger than those on the density ( for the temperature as compared to 2-5% for the densities), the fractional uncertainties on the pressure and entropy given are similar to the corresponding temperature measurement.
5.2 Spectral Results
5.2.1 Thermodynamic Mapping
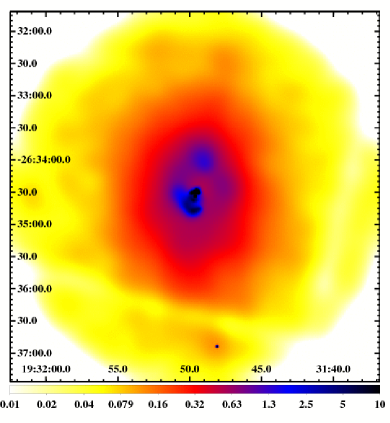
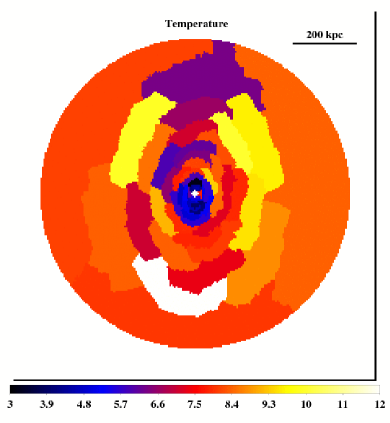
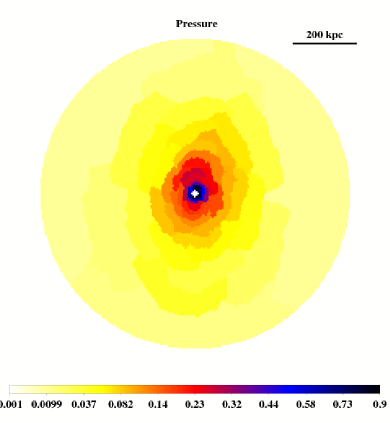
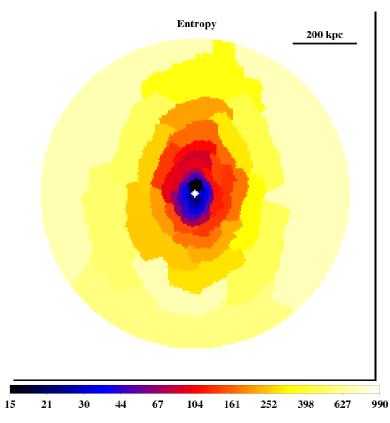
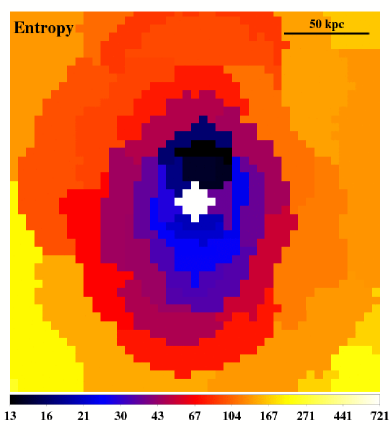
The maps of temperature, density, pressure, and entropy in MACS J1931.8-2634 are shown in Fig. 5. One of the most notable features is the spiral of low temperature gas wrapping to the east and north of the central AGN seen in the large scale temperature map. This is spatially coincident with the surface brightness excess seen in Fig. 3. Such spirals can be due to either ram pressure stripping of an infalling subcluster core, or merger induced oscillatory motion of the cluster core. Both scenarios are seen in many nearby systems and hydrodynamic simulations (e.g. Churazov et al., 2003; Ascasibar & Markevitch, 2006; Dupke et al., 2007; Laganá et al., 2010; Owers et al., 2009; ZuHone et al., 2010; Million et al., 2010).
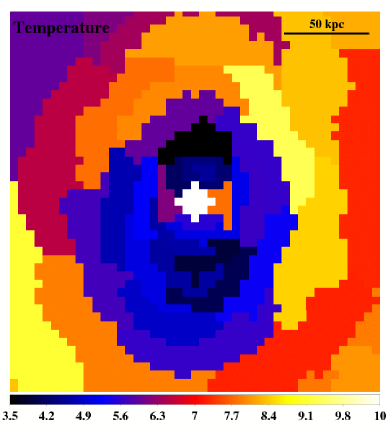
Zooming in on the temperature and entropy structure surrounding the AGN, Figs. 6 and 6 show that there are also two small regions of higher temperature to the east and west of the central AGN spatially coincident with the depressions in X-ray emission noted in Fig. 3. Although the temperature of these regions is up to 2 keV higher than their surroundings, the statistical significance is modest. The lowest temperature and entropy gas is located 25-30 kpc to the north of the AGN and spatially coincident with the X-ray bright northern ridge. There is a similar ridge to the south which also has lower temperature and entropy gas, but at lower significance.
5.2.2 Spectroscopic Cooling in the Bright Northern and Southern Ridges
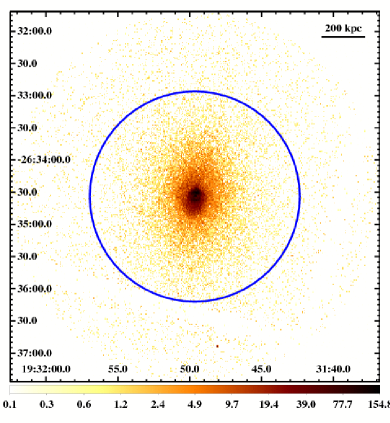
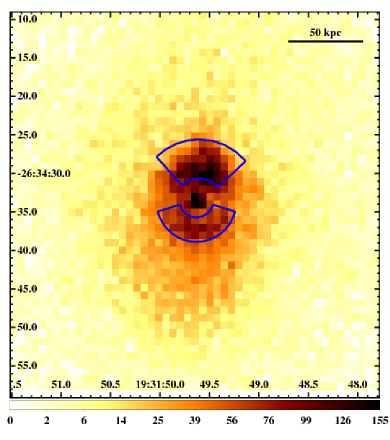
Since cooling flows are only expected in the inner, densest regions of the ICM, we have searched for the presence of spectroscopic cooling in the bright ridges to the north and south of the central AGN. The regions defined as the northern and southern ridges are shown in Fig. 7. These regions were constructed to surround the brightest emission in the image shown in Fig. 2.
The two ridges are approximately equal distances from the central AGN, but have different spectral properties. The northern ridge has an emission weighted temperature of and a metallicity . This metallicity is higher than the average of this cluster of , discussed in more detail in Section 5.2.4. Adding a cooling flow component to the spectral model of the northern ridge, we measure a spectroscopic mass deposition rate of . Comparing the luminosity of the composite MEKAL+MKCFLOW model with the MKCFLOW component alone, the spectroscopic cooling of gas down to 0.1 contributes 30% of the emission from the northern ridge region. The southern bright ridge has a similar overall temperature (emission weighted ), but a lower metallicity () and a 90% confidence upper limit on the spectral cooling rate of . These results are summarized in Table 2.
We note that the MEKAL+MKCFLOW model offered a significant improvement to the spectral fit of the northern ridge (10 with one additional fit parameter, a significant improvement at the 99.9% confidence level), almost identical to the improvement obtained with a two temperature (MEKAL+MEKAL ) fit, which introduces two additional fit parameters to the default MEKAL model. We also attempted to further resolve the spectroscopic cooling flow by using 2 or more MKCFLOW components with different temperature ranges, but none of these more complicated models provided a further statistically significant improvement to the fit. For the southern ridge, the fit was not improved by the addition of either a cooling flow or a second MEKAL component.
| Measurement | North | South |
|---|---|---|
5.2.3 Azimuthally Averaged Thermodynamic Profiles
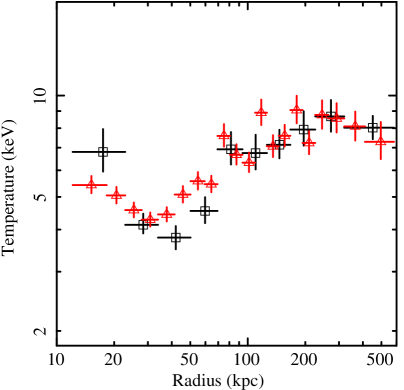
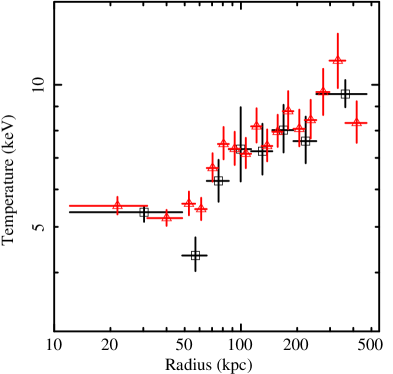
The azimuthally averaged temperature profile for MACS J1931.8-2634 is shown in Figure 8. It is clear in this profile that the temperature does not decrease monotonically towards the center as is expected in a cool core cluster (e.g. Allen et al., 2001; Vikhlinin et al., 2005), but instead appears to increase in the central-most regions. This central jump in temperature is most clear in deprojection, where the innermost temperature is several keV higher than the measured temperature in the adjacent region. Such a sharp discontinuity in the temperature is often associated with shock heating, but the presence of the cooler ridges separated from the central AGN makes presence of shock heating ambiguous. To account for these cool ridge substructures, thermodynamic profiles were taken with the ridge regions excluded. These thermodynamic profiles are shown in Fig. 9. These profiles more accurately describe the average thermodynamic structure of the ICM. After excluding the ridges, the deprojected temperature in the central-most region still does not decrease towards the center. The sharp temperature jump seen in the center of the deprojected temperature profile is less pronounced, but still present, and there are weak indications of discontinuities in the central bin of the density profile as well. All of the thermodynamic profiles of Figure 9 are consistent with shock heating occurring in the central 20 kpc, but the small number of regions and relatively low signal-to-noise do not allow for us to claim an unambiguous detection. Such a jump in the central temperature could also be due to the presence of cavities devoid of ICM gas. In that case, the measured central temperature would be due to ICM gas in front of and behind the central AGN. This should lead to a flatter deprojected density profile in the central regions, a feature that is not observed. The innermost annular region of the thermodynamic profiles is also considerably larger than any apparent cavities in the X-ray emission, so it is unlikely that this temperature jump is due to projection effects involving cavities.
Both the temperature and density profiles show other discontinuities within the central 100 kpc. The density profile decreases discontinuously at several locations while the temperature profile increases sharply at 70 . These profiles lead to clear discontinuities in the entropy and an unusually flat pressure profile. Such discontinuities arise from the presence of either cold fronts or weak () shocks. Since the lower temperature gas on the inner edges of these fronts has a higher density, this profile is more consistent with the presence of cold fronts than shock heating. Heating from weak shocks cannot be ruled out, however, since the state of the ICM at earlier times before any bulk motion or shock heating is unknown. Deeper data are required to distinguish between these possibilities.
5.2.4 Metallicity Profiles
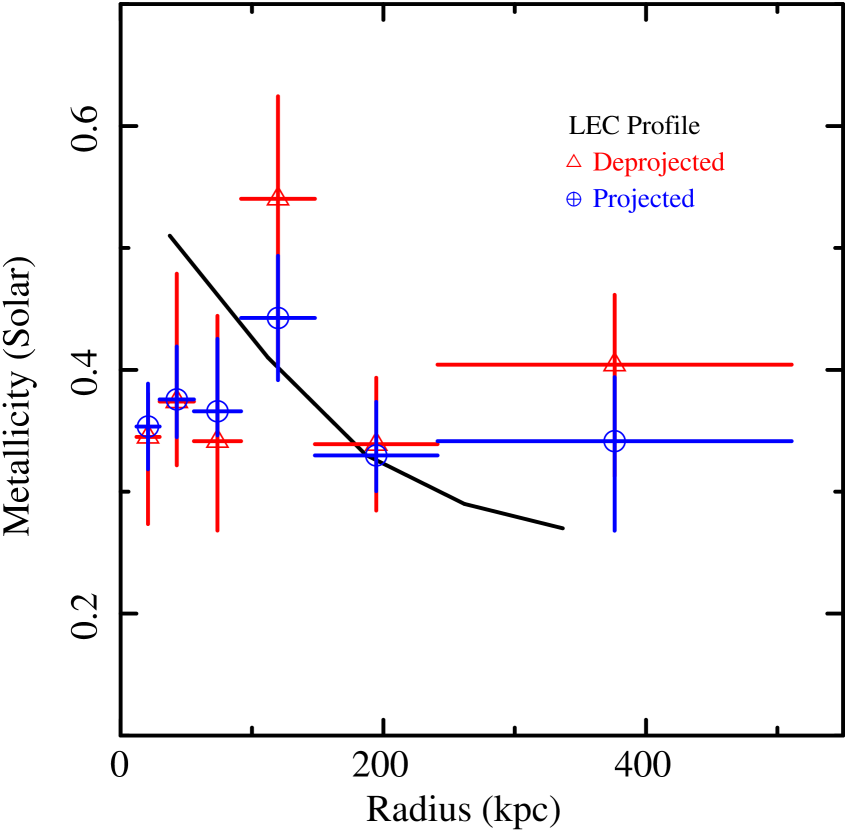
Surprisingly, the metallicity profile of MACS J1931.8-2634 shown in Fig. 10 exhibits no deviations from a constant metallicity of out to distances as large as 400 kpc. All attempts to fit the data to a multi-temperature MEKAL model did not lead to any significant increases in the central metallicity. A central metallicity peak is almost always observed in the profiles for cool core clusters (Allen & Fabian, 1998; De Grandi & Molendi, 2001; Leccardi & Molendi, 2008; Leccardi et al., 2010; Ehlert & Ulmer, 2009). The only region in the cluster that has a significant metallicity enhancement is the bright ridge of X-ray gas to the north of the central AGN, where the metallicity is closer to . The unusual metallicity profile of MACS J1931.8-2634 argues that the cool core may have undergone substantial stripping, likely associated with its bulk motion. A dramatic example of stripping of a cool core due to bulk motion has been recently reported in the nearby Ophiuchus Cluster (Million et al., 2010).
6 Optical structure of the cluster core
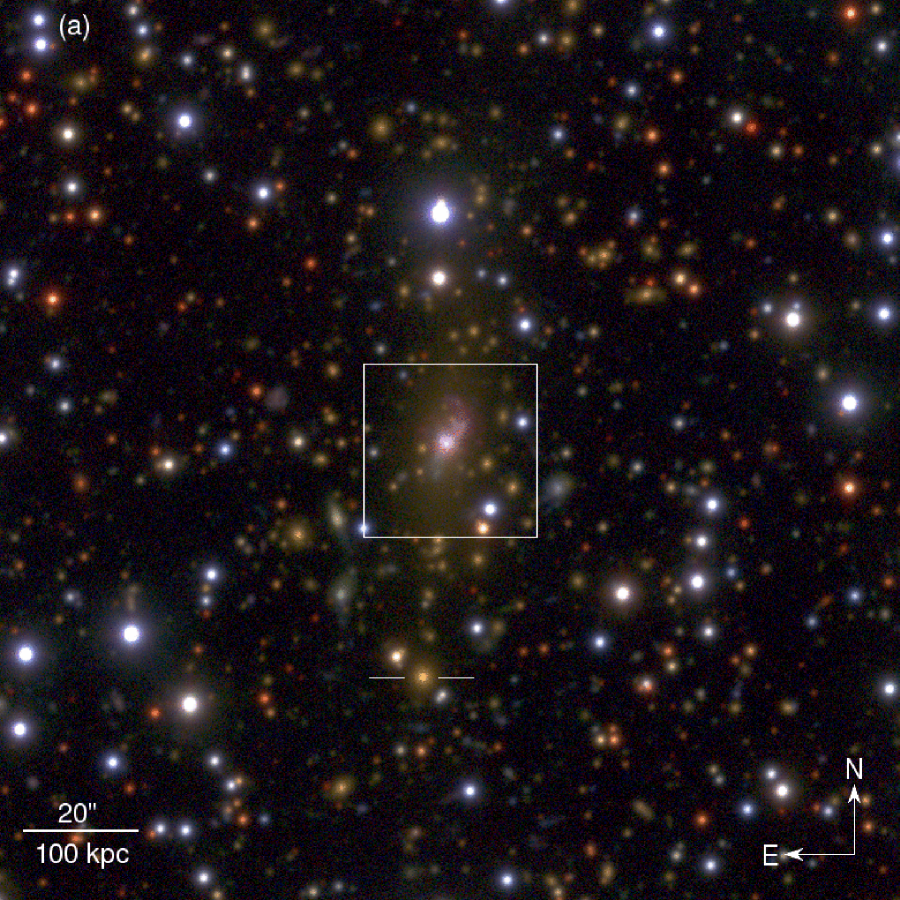
We observed MACS J1931.8-2634 in broad-band BVRIz filters with SuprimeCam on Subaru (Table 3). The data were reduced with a dedicated weak lensing and photometry pipeline based on the GABODS pipeline of Erben et al. (2005) as part of a larger cluster sample (von der Linden et al., in preparation). Figure 11(a) shows a BRz three-color image of the central of the cluster.
| Filter | Exposure time [s] | Observation date | Seeing |
|---|---|---|---|
| B | 1680 | 2006-06-25 | |
| V | 1636 | 2006-05-30 | |
| R | 3360 | 2006-06-25 | |
| I | 2400 | 2006-05-30 | |
| z | 1620 | 2007-07-18 |
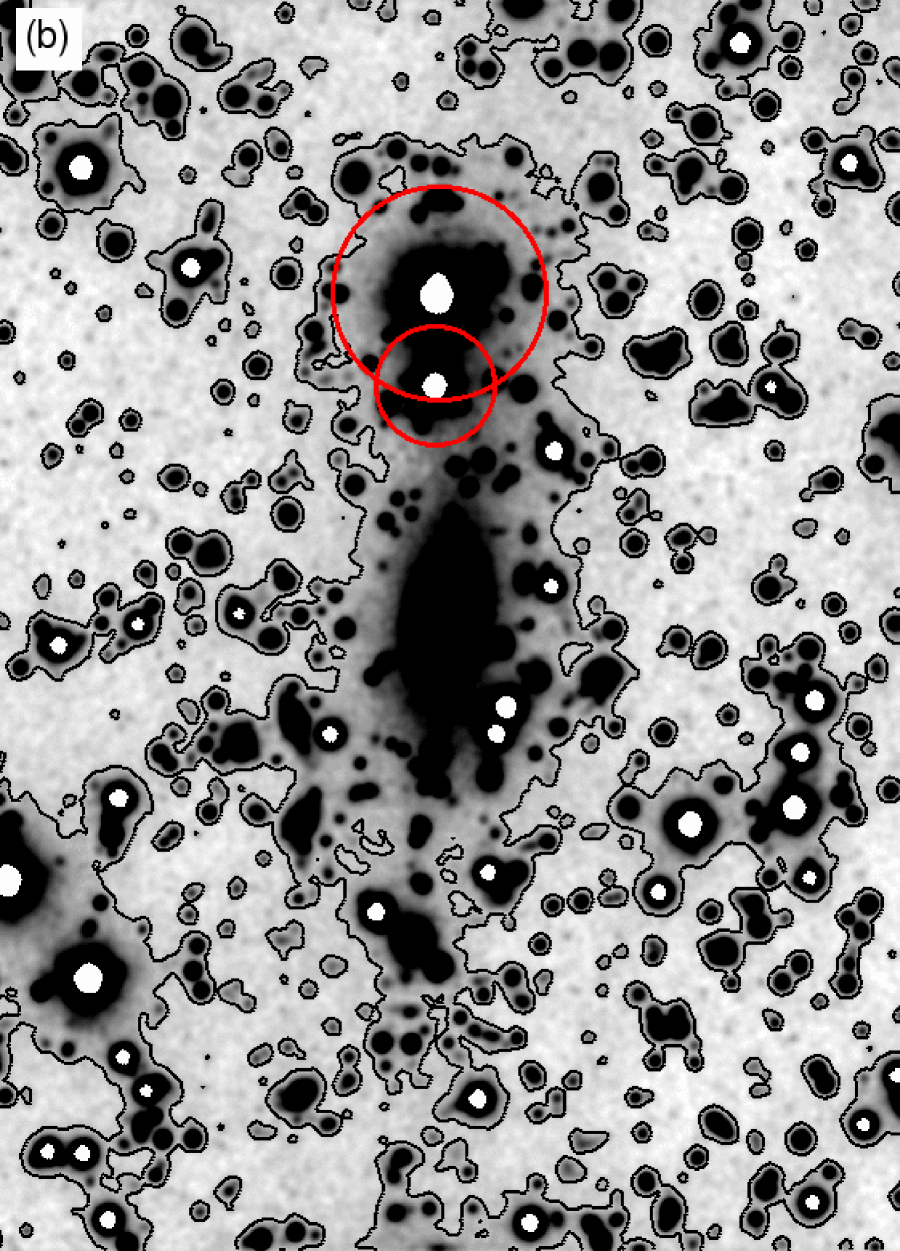
Similar to the X-ray structure, the optical morphology of the cluster core exhibits clear structure in the North-South direction: the Brightest Cluster Galaxy (BCG) and the intracluster light (ICL) are highly elongated in this direction. In Fig. 11(b) we highlight the extent of the ICL. The SuprimeCam images are very deep, and we have taken significant care in flat-fielding the images (von der Linden et al., in preparation). This allows us to trace the ICL to 28.3 mag arcsec-2. Correcting for cosmological surface brightness dimming, this would correspond to 27 mag arcsec-2 at . North of the BCG, two stars mask the ICL, but there is evidence that the ICL extends slightly northwest of the stellar halos. To the south, the ICL appears to encompass the second brightest galaxy, located kpc south of the BCG. At these extremes, the detected ICL extends to kpc north and south of the BCG, but only to kpc east and west. The ICL of MACS J1931.8-2634 is thus highly elongated, with an axis ratio of . At radii kpc, the ICL traces the overall gravitational potential and is tied to the evolution history of the cluster (e.g. Kelson et al., 2002; Napolitano et al., 2003; Gonzalez et al., 2005). The stars in the ICL are collisionless, like the dark matter, and thus the shape of the ICL should presumably reflect the shape of the core of the cluster dark matter halo. The elongation of the dark matter distribution indicates the direction of the last merger (e.g. Roettiger et al., 1997), and thus MACS J1931.8-2634 likely experienced a merger within the N-S direction. The timescale of this event is not clear, since the elongation persists for several Gyr (Roettiger et al., 1997; Moore et al., 2004). A confirmation of this elongation of the dark matter halo by gravitational lensing is currently not possible - the ground-based data do not reveal any strong lensing features. Furthermore, the sightline to MACS J1931.8-2634 is close to the galactic center (, ), and the field is crowded with stars, which prohibit weak lensing shape measurements for an appreciable number of background galaxies.
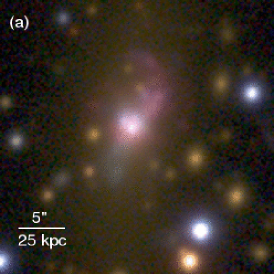
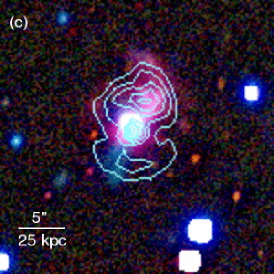
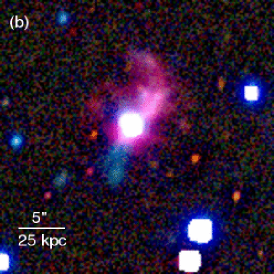
Of particular interest is also the structure of the BCG. Fig. 12(a) shows the central of the SuprimeCam BRz image. We see ‘pink’ and ‘blue’ filaments extending to the northwest and southeast, respectively. The ‘pink’ nebulosity to the northwest of the BCG signals emission in the blue (B) and red (z) bands. At the redshift of the cluster, the emission lines H, [Nii], and [Sii] are redshifted into the z band. The response of the CCD is not uniform across the filter due to the decreasing quantum efficiency at longer wavelengths, and H falls onto the most sensitive wavelength interval of the filter throughput. In order to single out the line emission, we subtract the adjacent band (I) from the z-band, scaling the I-band image such as to remove the large-scale light distribution from the dominant stellar population of the BCG. We identify the resulting emission as predominantly H line emission, although this needs to be confirmed spectroscopically. We also subtract the I-band from the B and R-bands, in order to better visualize emission not stemming from the underlying, old stellar population visible in the I-band. The resulting image is shown in Fig. 12(b). The dominant feature here is a bright filament to the northwest, of both H emission and blue emission. At the cluster redshift, the [Oii] doublet is shifted redward of the B filter, and thus the most likely interpretation of blue light is continuum emission from young stars. To the southeast, a filament of bright blue emission is visible, which lacks strong H emission. Faint loops of H and blue light are also visible to the east and west. Overall, the structure is reminiscent of NGC 1275, the central galaxy of the Perseus cluster, which exhibits a rich system of H filaments, as well as filaments of young stars (Conselice et al., 2001; Fabian et al., 2008). From the data at hand, however, it appears that in MACS J1931.8-2634, H filaments are accompanied by blue filaments (H alone would be visible as deep red, not as pink, in our images). The reverse is not always true, however: we do not detect H emission coincident with the blue filament to the southeast. For comparison, this is significantly different from NGC 1275, where most H emission is not accompanied by star formation (Canning et al., 2010).


In Fig. 12(c) we overplot contours from the X-ray emission from Fig. 2(b). We see that the brightest knots of the northwestern filament (which are bright both in H and blue light) coincide with the northern ridge identified in the X-ray imaging and thermodynamic mapping (Sect. 5.2.1). The southwestern filament also could be associated with the southern ridge. The X-ray cavities, on the other hand, are at almost angles to the bright filaments.
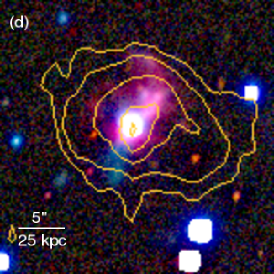
In Fig. 12(d) we overplot contours from the radio emission (Sect. 7). The brighter radio emission seems to coincide with the brightest H emission, whereas the fainter radio emission is elongated in an East-West direction, following the X-ray cavities.
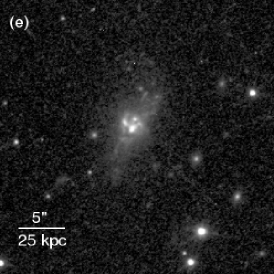
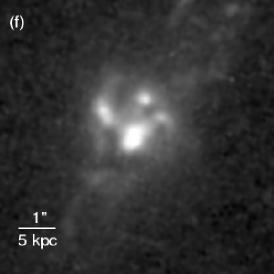
Finally, in Fig. 12(e) and (f) we show the HST WFPC2 snapshot exposure of MACS J1931.8-2634 (1200s, F606W filter). This allows us to see details at the very core of the BCG, which are unresolved in the deeper SuprimeCam images. Apart from the central AGN point source, we see three bright knots to the north, along spiral-shaped filaments.
Giant H filaments and on-going star formation, as evident by the presence of young, blue stars, are a common occurrence in the BCGs of cool-core clusters (Allen, 1995; Crawford et al., 1999; Hatch et al., 2007; Rafferty et al., 2008a). In the most H luminous systems, the H luminosity scales well with the star formation rate (Allen, 1995; Crawford et al., 1999; O’Dea et al., 2008). However, in general, star formation is not the only source of photo-ionizing radiation in BCGs, as is evidenced by H emission present even in the absence of young stars, the spatial offset of H filaments and young star clusters observed in some near-by systems (Crawford et al., 2005; Canning et al., 2010), and the higher [Nii]/H line ratios when young stars are not present (Hatch et al., 2007). In the BCG of MACS J1931.8-2634, young stars are clearly associated with the H emission. The H emission is furthermore coincident with the “northern ridge” defined in Fig. 7. Assuming ratios of [Nii]/H=0.7 and [Sii]/H=0.3 (typical of H-luminous BCGs, Crawford et al., 1999), the H luminosity in this region is erg s-1. This would make it the most H-luminous BCG known. Crawford et al. furthermore find that the typical color excess in H luminous BCGs is , albeit with large scatter. Assuming Milky-Way type extinction, the standard Kennicutt (1998) conversion between and star formation rate (which fits H luminous BCGs well, again with large scatter, Crawford et al., 1999; O’Dea et al., 2008) thus suggests . This is in remarkable agreement with the X-ray mass deposition rate of the northern ridge (). However, one needs to keep in mind that the SFR value is only a rough estimate, using only broad-band imaging, and assuming average values of quantities with large observed scatter.
7 Radio Observations with VLA
1.4 GHz radio observations were made with the Very Large Array (VLA) of the National Radio Astronomy Observatory on 2006 April 14. The data were obtained in A configuration, and the time on source was 54 minutes. A central radio source with flux density 70 mJy is clearly associated with the central AGN and the core of the elliptical galaxy. Approximately 45” to the south is a Narrow Angle Tail (NAT) radio galaxy with flux density 135 mJy. As shown in Fig. 13, the tails of the NAT are swept back to the south, in the same north-south orientation as the major axis of the central elliptical. The radio morphology of the central AGN (seen in Fig. 13) is amorphous without the clearly defined jets or lobes that are found in many radio galaxies. Such amorphous radio structures have been seen associated with cD galaxies in cooling core clusters such as PKS0745-191 (Baum & O’Dea, 1991; Taylor et al., 1994), 3C317 in A2052 (Zhao et al., 1993), and PKS 1246-410 in the Centaurus cluster (Taylor et al., 2002). Most likely the radio jets have been disrupted on small scales by dense gas.
8 The Central AGN: Power and Accretion
The energy of the outburst occurring at the central AGN manifests itself as both radiative emission and as a jet that inflates cavities filled with radio plasma. The energy being input into both of these channels can be estimated from the observations.
8.1 Estimating the Radiative Power
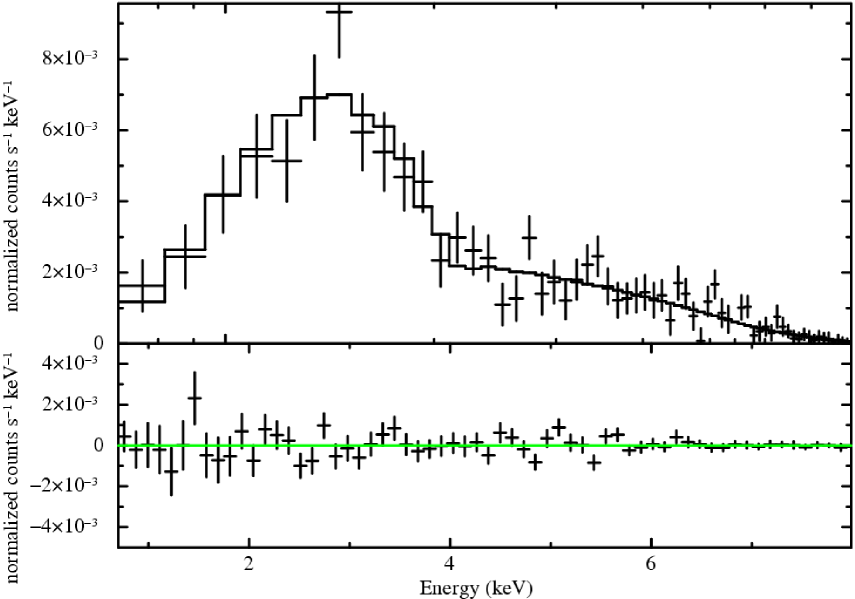
The central AGN is sufficiently bright in X-rays to directly measure its spectrum and luminosity. Since its spectrum is presumed to be non-thermal in origin, we have modeled it with a variety of power law models.
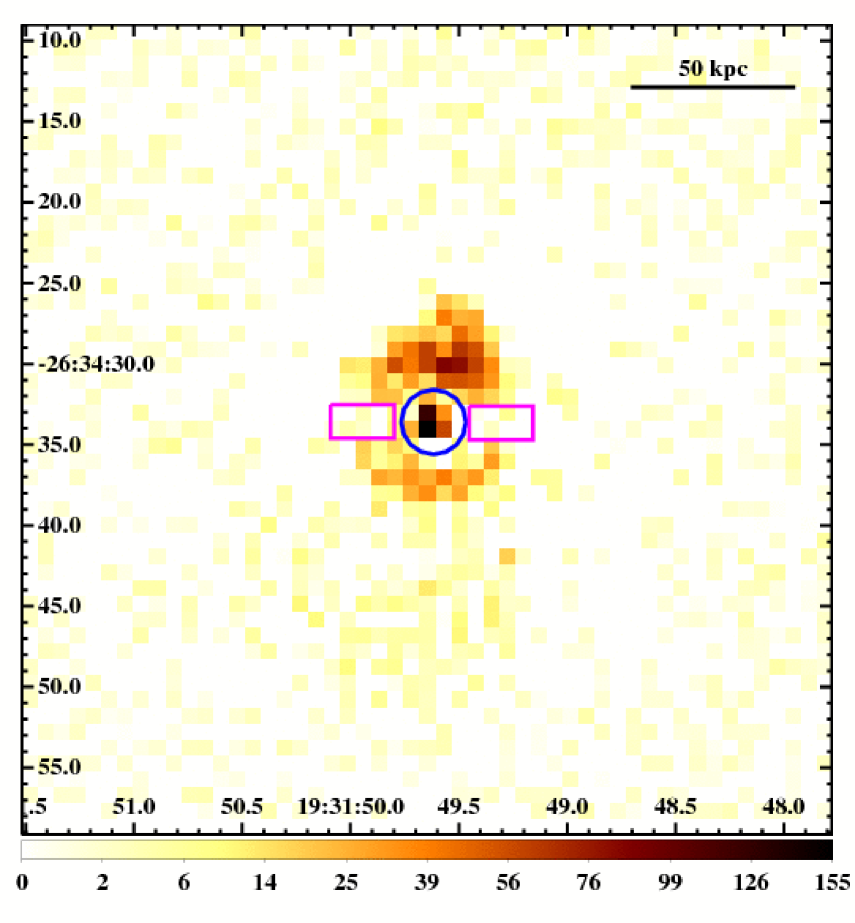
Source counts are extracted from a 2 arcsec region centered on the AGN. The spectral background is extracted from regions that are chosen to be near the AGN and avoid the bright ridges to the north and south, which are likely poor representations of the true background surrounding the AGN. The source and background regions are shown in Fig. 14(a). The net spectrum for the AGN using these regions is shown in Fig 14(b). Three different assumptions about the absorption have been examined: 1) that the absorption is due only to Galactic contributions, and is fixed at the value of Kalberla et al. (2005); 2) that the absorption is only due to Galactic contributions, but the column density is a free parameter in the fit; and 3) that the absorption includes both a fixed Galactic component and an intrinsic component at the redshift of the cluster with the intrinsic column density a free parameter. The results of these fits including the model fluxes and luminosities between 0.7 and 8.0 keV are given in Table 4. It is clear from the fit statistics that a larger absorption column density is favored (, a significant improvement at a confidence level well above 99.9%). We conclude that the central AGN has a luminosity in the energy range of 0.7-8.0 keV of 8 . Systematic uncertainties arising from the choice of the background region are estimated at 30%.
8.2 Estimating the Jet Power
The radio and X-ray emission both suggest that X-ray cavities filled with radio plasma reside to the east and west of the central AGN. The energy and power required to inflate and fill these cavities () can be estimated using the methods described by Allen et al. (2006), (see also Dunn & Fabian, 2004; Dunn et al., 2005; Churazov et al., 2002).
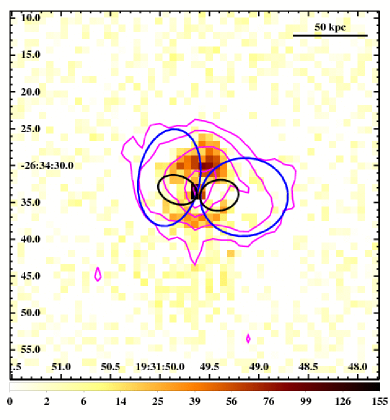
Neither the X-ray nor radio image provide an well-defined, unambiguous choice for cavity regions. The X-ray image shows two regions to the east and west of the central AGN that look like cavities, although the outer boundaries are difficult to determine, particularly given the presence of the bright ridges to the north and south. In nearby systems, depressions in the X-ray emission associated with the full extent of the radio plasma-filled cavities are typically visible only in very deep X-ray observations (Bîrzan et al., 2008). The radio emission, on the other hand, has a much more naturally defined outer boundary, but our 1.4 GHz radio data for this cluster do not show clear lobe or jet structure to the radio source. The boundaries of this radio emission suggest that it is confined by the surrounding X-ray gas, but we caution that if the radio plasma were ‘leaking out beyond’ the boundary of the cavities then estimating cavity volumes based on the radio emission would lead to overestimating the energy in the cavities (Finoguenov et al., 2008). With these uncertainties in mind, identical calculations were performed with two different sets of cavities: one set based on the structure of the radio emission (hereafter the radio cavities) and another set based on the apparent cavities in the X-ray images (hereafter the minimal X-ray cavities). The true cavity volumes, enthalpy, and jet power are expected to lie somewhere between the values calculated from these two sets of cavities, both shown in Fig. 15.
Both the radio and minimal X-ray cavities were modeled as tri-axial ellipsoids with volume . The measured lengths and are the lengths of the axes in the image plane along and perpendicular to the jet axis, respectively. The final length, , is the axis of the cavity along the line of sight. The initial length of the axis along the line of sight was estimated as the smaller of the two planar axis lengths, but allowed to vary independently from them. Calculating the sound speed for the X-ray emitting gas with mean molecular weight and adiabatic index , we estimated the time scale for bubble formation as . From this, we calculated the power required to inflate the cavities as roughly . A Monte Carlo analysis was performed that drew the temperature, density, and all three spatial axes from independent Gaussian distributions. The assumed uncertainties on , , and were 20%, 30%, and 30%, respectively, leading to a systematic uncertainty of 50% in the volume. Both the temperature and density were calculated from the major axis using a power-law parametrization of the profiles shown in Fig. 9 between 8 and 80 kpc (). From these variables the pressure, enthalpy, and jet power were then calculated. The prior assumptions and subsequent calculations of the cavity energetics are listed in Table 5. Although each calculation includes systematic uncertainties of the particular cavity volume, the dominant uncertainty is identifying a particular set of cavities, which leads to an uncertainty in the enthalpy of approximately a factor of 8 and jet power uncertian within a factor of roughly 4.
We find that the total enthalpy between the two bubbles, after accounting for all uncertainties, is approximately . This corresponds to a power input into the ICM from the jet of approximately 4 – 14 . The mechanical energy going into inflating these cavities is nearly two orders of magnitude larger than the radiative emission of the AGN, and larger than the bolometric luminosity within the central 50 kpc of the cluster. Based on the scaling relation of Cavagnolo et al. (2010) and the radio luminosity, the inferred jet power is , consistent with the lower range of jet powers measured here after accounting for the scatter. The temperature profile shows evidence for heating that goes out to roughly the same distance as the radio emission, so it is possible that the bubbles are in fact as large as the radio emission even though the X-ray depressions are much smaller in scale. The jet power derived from the radio cavities is comparable to the power input measured in the 200 kpc cavities of MS0735.6+7421 (McNamara et al., 2005), which was previously the system with the most powerful jets measured.
9 Discussion
As a larger, more luminous, higher redshift analog to nearby systems like the Perseus Cluster (Fabian et al., 2003, 2006), MACS J1931.8-2634 provides an extreme example of a cluster with a rapidly cooling core and powerful AGN feedback. This powerful AGN outburst combined with merger-induced motion has led to a cool core undergoing destruction to an extent previously unobserved in galaxy clusters.
There is clear evidence that MACS J1931.8-2634 has undergone a merger event that induced large oscillatory motions of the core. On scales of 200 , a spiral of cooler, denser gas seen in both the X-ray image and temperature map is observed to wrap around the core. Such spiral structures arise naturally from mergers and subsequent sloshing and are observable for several Gyr after the merger event (Ascasibar & Markevitch, 2006). Clear deviations from elliptical symmetry are seen in the isophotes, whose centroids shift with distance along the major axis to the north and south. On smaller scales near the core (50 ), the X-ray data show that the core has a history of motion in the north-south direction. There are two bright ridges to the north and south of the central AGN. The northern ridge has a sharp northern edge (possibly a cold front), while the southern ridge has a diffuse tail of emission trailing its southern edge. Both of these features are consistent with the densest gas currently undergoing motion to the north.
| Model | Galactic | Intrinsic | Photon Index | Normalization | Flux | Luminosity | |
|---|---|---|---|---|---|---|---|
| Fixed Galactic Absorption | 0.083 | 0.0 | 519.81/497 | ||||
| Free Galactic Absorption | 0.0 | 505.68/496 | |||||
| Free Intrinsic Absorption | 0.083 | 506.42/496 |
| Parameter | East (Radio) | West (Radio) | East (X-Ray) | West (X-Ray) |
|---|---|---|---|---|
| ( kpc) | ||||
| ( kpc) | ||||
| ( kpc) | ||||
| ( keV) | ||||
| 0 | 0 | 0 | 0 | |
| () | ||||
| () | ||||
| () | ||||
| () | ||||
| () | ||||
| ( yr) | ||||
| () |
Our optical data independently suggest such a merger: the ICL around the cD galaxy is highly elongated in the north-south direction. B-band emission originating from a young stellar population is observed both to the north and south of the cD galaxy, while H emission originating from ongoing star formation is observed predominantly at positions coincident with the northern ridge. The presence of a young stellar population to the south without any H emission suggests that the primary region of star formation is moving northward.
In the midst of the motions of the cluster core, a powerful AGN outburst has taken place. The central AGN is bright in X-ray emission, with a luminosity in the energy band of 0.7-8.0 keV of 8 . This AGN is surrounded by extended, amorphous 1.4 GHz radio emission. The major axis of this radio emission is spatially coincident with depressions in the X-ray emission. The physical extent of the cavities based on the observations is unclear, but estimating cavities based on the X-ray and radio emission gives a robust range for the enthalpy of the cavities and their corresponding jet power. The enthalpy of these cavities is sufficient to counteract the radiative losses from the central 50 kpc for 30-250 Myr. The jet power (4 – 14 ) identifies MACS J1931.8-2634 among the most powerful cavity sources yet observed. The power input into inflating these cavities is approximately 100 times larger than the measured radiative power of the central AGN, and four to ten times larger than the bolometric luminosity of the cool core.
Unlike other more typical cool core clusters (Allen & Fabian, 1998; De Grandi & Molendi, 2001; Vikhlinin et al., 2005; Pratt et al., 2007; Werner et al., 2008), the azimuthally-averaged metallicity profile for MACS J1931.8-2634 shows no significant deviations from a constant value. Assuming that there once was a central metallicity peak in MACS J1931.8-2634, this suggests that large masses of metal-rich gas has been stripped from the center of the cluster and displaced to the surrounding regions. The extent of transport required to account for the flat metallicity profile is strong evidence that the original cool core has undergone destructive stripping as it traversed from one side of the cD galaxy to the other. The only region with an exceptional metallicity is the northern central ridge. The central metallicity peak in cool core clusters is usually expected to be robust, even in clusters with powerful central AGN activity (Böhringer et al., 2004; Rasera et al., 2008).
Merger and central AGN activity have resulted in the formation of two X-ray bright ridges roughly equal distances north and south of the central AGN. The X-ray bright ridge to the north of the central AGN has characteristics usually associated with a cool core. It is the location of the lowest temperature, highest density gas in the cluster. It is also the location of the most metal rich gas. The X-ray spectrum of this northern ridge has a spectroscopic cooling rate of 165 down to , in good agreement with the observed star formation rate estimated from the H emission, 170 . This H emission is expected to be almost entirely from star formation, as it is roughly 3 orders of magnitude larger than what expected from Case B Recombination (Johnstone et al., 1987). The spectroscopic cooling contributes a large fraction of the emission from this region, estimated at 30% based on the spectral modeling. The northern ridge might therefore be in the early stages of ’catastrophic cooling’ (e.g. Fabian & Nulsen, 1977; Peterson & Fabian, 2006). The cooler ICM gas to the south of the cD galaxy has a lower metallicity and a current spectroscopic cooling rate consistent with zero, but is also the location of a young stellar population. This appears consistent with sloshing-induced stripping of the cool core throughout its oscillations along the north-south axis. The asymmetric thermodynamic structure and different stellar populations of these ridges clearly indicate that there is no longer a single core of low entropy gas surrounding the cD galaxy. The extent to which AGN feedback contributed to the present-day thermodynamic structure of MACS J1931.8-2634, apart from core sloshing, is beyond the scope of the current observations. The majority of the stripping and disruption of metal rich, low entropy gas from the original cool core could have been caused by the bulk motions, but it seems likely that the AGN outburst may have contributed to the separation of the preexisting core into two X-ray bright ridges roughly equal distances from the central AGN (Guo & Mathews, 2010). This cluster’s star formation is exceptional, especially as it does not satisfy all of the empirical conditions for central star formation discussed in Rafferty et al. (2008b). Although the cooling time and entropy are below the thresholds put forward by Rafferty et al. (2008b), all of the systems with clear evidence for high star formation rates also have AGN jet powers smaller than the cooling luminosity, which is not the case in MACS J1931.8-2634.
Although the extent of stripping and cool core disruption in MACS J1931.8-2634 is substantial, similar phenomena have also been observed in the nearby Ophiuchus Cluster (Million et al., 2010). Many of the morphological structures seen in MACS J1931.8-2634 are also seen in the Ophiuchus Cluster. Both clusters have clearly shifting isophotes, inner cold fronts, and comet-like diffuse emission trailing to one side of the inner cool core. The Ophiuchus Cluster also shows strong evidence for stripped core gas in the form of a metal rich ridge to the north of the cool core. These processes also appear to be occurring in MACS J1931.8-2634, but with the added complications and energy of central AGN feedback.
The extent to which a cool core can be disrupted or even destroyed by AGN feedback and merger induced oscillations has important implications for cosmological studies with clusters (e.g. Burns et al., 2008; Mantz et al., 2010a, b). Further observations with X-ray, optical, and radio instruments could provide many new insights into the extent that this cool core has been disrupted. Radio observations at higher resolutions and lower frequencies could allow for a better understanding of the amorphous central radio source, in particular discerning the origin of the emission by measuring the radio spectrum. Higher resolution, deeper observations may also be able to resolve the jet and lobe structure of the central AGN source, which is critical for further constraining the magnitude and origin of the AGN outburst. Optical spectroscopy would enable more precise measurements of the star formation rate in the different regions surrounding the central AGN, and perhaps allow for measurements of the black hole mass. Optical spectroscopy would also allow for measurements of the emission line velocities within the cool core remnant, providing more details as to the extent of the disruption of the cool core. Deeper observations with Chandra would provide better measurements of the unusual metallicity structure and the extent that gas has been stripped from the cool core remnant. The distribution of regions that undergo cooling and the extent of that cooling could also be measured in more detail. Finally, a deeper X-ray exposure could shed new light on the thermodynamic structure of the cluster, in particular provide more compelling evidence for cold fronts and/or shock heating within the central 100 kpc. Simulations designed to reconstruct the thermodynamic structure of MACS J1931.8-2634 may elucidate the nature of extreme sloshing and feedback, and perhaps also the future evolution of such a profoundly disrupted core.
Acknowledgments
This work was carried out with Chandra Observation Awards Number GO8-9119X & GO0-11139X. Support for this work was provided by the National Aeronautics and Space Administration through Chandra/Einstein Postdoctoral Fellowship Award Number PF8-90056 (N.W.) and PF9-00070 (A.S.) issued by the Chandra X-ray Observatory Center, which is operated for and on behalf of the National Aeronautics and Space Administration under contract NAS8-03060. G.G. is a postdoctoral researcher of the FWO-Vlaanderen (Belgium). RJHD acknowledges support from the Alexander von Humboldt Foundation. This research was supported by the DFG cluster of excellence ‘Origin and Structure of the Universe’ www.universe-cluster.de.
Further support for this work was provided by the Department of Energy Grant Number DE-AC02-76SF00515. The National Radio Astronomy Observatory is operated by Associated Universities, Inc., under cooperative agreement with the National Science Foundation. We also thank Silvano Molendi for providing the mean metallicity profile data from Leccardi et al. (2010). We finally thank the anonymous referee for their suggestions and comments that improved this work.
References
- Allen (1995) Allen S. W., 1995, MNRAS, 276, 947
- Allen (2000) Allen S. W., 2000, MNRAS, 315, 269
- Allen et al. (2006) Allen S. W., Dunn R. J. H., Fabian A. C., Taylor G. B., Reynolds C. S., 2006, MNRAS, 372, 21
- Allen & Fabian (1998) Allen S. W., Fabian A. C., 1998, MNRAS, 297, L63
- Allen et al. (2001) Allen S. W., Fabian A. C., Johnstone R. M., Arnaud K. A., Nulsen P. E. J., 2001, MNRAS, 322, 589
- Allen et al. (2008) Allen S. W., Rapetti D. A., Schmidt R. W., Ebeling H., Morris R. G., Fabian A. C., 2008, MNRAS, 383, 879
- Allen et al. (2004) Allen S. W., Schmidt R. W., Ebeling H., Fabian A. C., van Speybroeck L., 2004, MNRAS, 353, 457
- Allen et al. (2002) Allen S. W., Schmidt R. W., Fabian A. C., 2002, MNRAS, 334, L11
- Anders & Grevesse (1989) Anders E., Grevesse N., 1989, Geochim. Cosmochim. Acta, 53, 197
- Arnaud (2004) Arnaud K., 2004, in Bulletin of the American Astronomical Society, Vol. 36, Bulletin of the American Astronomical Society, p. 934
- Ascasibar & Markevitch (2006) Ascasibar Y., Markevitch M., 2006, ApJ, 650, 102
- Balucinska-Church & McCammon (1992) Balucinska-Church M., McCammon D., 1992, ApJ, 400, 699
- Baum & O’Dea (1991) Baum S. A., O’Dea C. P., 1991, MNRAS, 250, 737
- Bîrzan et al. (2008) Bîrzan L., McNamara B. R., Nulsen P. E. J., Carilli C. L., Wise M. W., 2008, ApJ, 686, 859
- Bîrzan et al. (2004) Bîrzan L., Rafferty D. A., McNamara B. R., Wise M. W., Nulsen P. E. J., 2004, ApJ, 607, 800
- Böhringer et al. (2005) Böhringer H., Burwitz V., Zhang Y., Schuecker P., Nowak N., 2005, ApJ, 633, 148
- Böhringer et al. (2004) Böhringer H., Matsushita K., Churazov E., Finoguenov A., Ikebe Y., 2004, A&A, 416, L21
- Brüggen & Kaiser (2002) Brüggen M., Kaiser C. R., 2002, Nat, 418, 301
- Burns et al. (2008) Burns J. O., Hallman E. J., Gantner B., Motl P. M., Norman M. L., 2008, ApJ, 675, 1125
- Canning et al. (2010) Canning R. E. A., Fabian A. C., Johnstone R. M., Sanders J. S., Conselice C. J., Crawford C. S., Gallagher J. S., III, Zweibel E., 2010, ArXiv e-prints
- Cash (1979) Cash W., 1979, ApJ, 228, 939
- Cavagnolo et al. (2010) Cavagnolo K. W., McNamara B. R., Nulsen P. E. J., Carilli C. L., Jones C., Bîrzan L., 2010, ApJ, 720, 1066
- Churazov et al. (2003) Churazov E., Forman W., Jones C., Böhringer H., 2003, ApJ, 590, 225
- Churazov et al. (2002) Churazov E., Sunyaev R., Forman W., Böhringer H., 2002, MNRAS, 332, 729
- Conselice et al. (2001) Conselice C. J., Gallagher J. S., III, Wyse R. F. G., 2001, AJ, 122, 2281
- Cowie & Binney (1977) Cowie L. L., Binney J., 1977, ApJ, 215, 723
- Crawford et al. (1999) Crawford C. S., Allen S. W., Ebeling H., Edge A. C., Fabian A. C., 1999, MNRAS, 306, 857
- Crawford et al. (2005) Crawford C. S., Sanders J. S., Fabian A. C., 2005, MNRAS, 361, 17
- De Grandi & Molendi (2001) De Grandi S., Molendi S., 2001, ApJ, 551, 153
- Dunn & Fabian (2004) Dunn R. J. H., Fabian A. C., 2004, MNRAS, 355, 862
- Dunn et al. (2005) Dunn R. J. H., Fabian A. C., Taylor G. B., 2005, MNRAS, 364, 1343
- Dupke et al. (2007) Dupke R., White R. E., III, Bregman J. N., 2007, ApJ, 671, 181
- Ehlert & Ulmer (2009) Ehlert S., Ulmer M. P., 2009, A&A, 503, 35
- Erben et al. (2005) Erben T. et al., 2005, Astronomische Nachrichten, 326, 432
- Fabian et al. (2002) Fabian A. C., Allen S. W., Crawford C. S., Johnstone R. M., Morris R. G., Sanders J. S., Schmidt R. W., 2002, MNRAS, 332, L50
- Fabian et al. (2008) Fabian A. C., Johnstone R. M., Sanders J. S., Conselice C. J., Crawford C. S., Gallagher J. S., III, Zweibel E., 2008, Nat, 454, 968
- Fabian & Nulsen (1977) Fabian A. C., Nulsen P. E. J., 1977, MNRAS, 180, 479
- Fabian et al. (2003) Fabian A. C., Sanders J. S., Allen S. W., Crawford C. S., Iwasawa K., Johnstone R. M., Schmidt R. W., Taylor G. B., 2003, MNRAS, 344, L43
- Fabian et al. (2006) Fabian A. C., Sanders J. S., Taylor G. B., Allen S. W., Crawford C. S., Johnstone R. M., Iwasawa K., 2006, MNRAS, 366, 417
- Finoguenov et al. (2008) Finoguenov A., Ruszkowski M., Jones C., Brüggen M., Vikhlinin A., Mandel E., 2008, ApJ, 686, 911
- Forman et al. (2007) Forman W. et al., 2007, ApJ, 665, 1057
- Forman et al. (2005) Forman W. et al., 2005, ApJ, 635, 894
- Gonzalez et al. (2005) Gonzalez A. H., Zabludoff A. I., Zaritsky D., 2005, ApJ, 618, 195
- Guo & Mathews (2010) Guo F., Mathews W. G., 2010, ApJ, 717, 937
- Hatch et al. (2007) Hatch N. A., Crawford C. S., Fabian A. C., 2007, MNRAS, 380, 33
- Henry et al. (2004) Henry J. P., Finoguenov A., Briel U. G., 2004, ApJ, 615, 181
- Johnstone et al. (1987) Johnstone R. M., Fabian A. C., Nulsen P. E. J., 1987, MNRAS, 224, 75
- Kaastra & Mewe (1993) Kaastra J. S., Mewe R., 1993, A&AS, 97, 443
- Kalberla et al. (2005) Kalberla P. M. W., Burton W. B., Hartmann D., Arnal E. M., Bajaja E., Morras R., Pöppel W. G. L., 2005, A&A, 440, 775
- Kelson et al. (2002) Kelson D. D., Zabludoff A. I., Williams K. A., Trager S. C., Mulchaey J. S., Bolte M., 2002, ApJ, 576, 720
- Kennicutt (1998) Kennicutt R. C., Jr., 1998, ARA&A, 36, 189
- Kitayama et al. (2004) Kitayama T., Komatsu E., Ota N., Kuwabara T., Suto Y., Yoshikawa K., Hattori M., Matsuo H., 2004, PASJ, 56, 17
- Laganá et al. (2010) Laganá T. F., Andrade-Santos F., Lima Neto G. B., 2010, A&A, 511, A15
- Leccardi & Molendi (2008) Leccardi A., Molendi S., 2008, A&A, 487, 461
- Leccardi et al. (2010) Leccardi A., Rossetti M., Molendi S., 2010, A&A, 510, A82
- Liedahl et al. (1995) Liedahl D. A., Osterheld A. L., Goldstein W. H., 1995, ApJL, 438, L115
- Mahdavi et al. (2005) Mahdavi A., Finoguenov A., Böhringer H., Geller M. J., Henry J. P., 2005, ApJ, 622, 187
- Mantz et al. (2010a) Mantz A., Allen S. W., Ebeling H., Rapetti D., Drlica-Wagner A., 2010a, MNRAS, 406, 1773
- Mantz et al. (2010b) Mantz A., Allen S. W., Rapetti D., Ebeling H., 2010b, MNRAS, 406, 1759
- McNamara & Nulsen (2007) McNamara B. R., Nulsen P. E. J., 2007, ARA&A, 45, 117
- McNamara et al. (2005) McNamara B. R., Nulsen P. E. J., Wise M. W., Rafferty D. A., Carilli C., Sarazin C. L., Blanton E. L., 2005, Nat, 433, 45
- Million et al. (2010) Million E. T., Allen S. W., Werner N., Taylor G. B., 2010, MNRAS, 582
- Moore et al. (2004) Moore B., Kazantzidis S., Diemand J., Stadel J., 2004, MNRAS, 354, 522
- Napolitano et al. (2003) Napolitano N. R. et al., 2003, ApJ, 594, 172
- Navarro et al. (1995) Navarro J. F., Frenk C. S., White S. D. M., 1995, MNRAS, 275, 720
- Navarro et al. (1997) Navarro J. F., Frenk C. S., White S. D. M., 1997, ApJ, 490, 493
- Nulsen et al. (2005) Nulsen P. E. J., McNamara B. R., Wise M. W., David L. P., 2005, ApJ, 628, 629
- O’Dea et al. (2008) O’Dea C. P. et al., 2008, ApJ, 681, 1035
- Ogrean et al. (2010) Ogrean G. A., Hatch N. A., Simionescu A., Böhringer H., Brüggen M., Fabian A. C., Werner N., 2010, MNRAS, 406, 354
- Owers et al. (2009) Owers M. S., Nulsen P. E. J., Couch W. J., Markevitch M., 2009, ApJ, 704, 1349
- Peterson & Fabian (2006) Peterson J. R., Fabian A. C., 2006, Phys. Rep., 427, 1
- Peterson et al. (2003) Peterson J. R., Kahn S. M., Paerels F. B. S., Kaastra J. S., Tamura T., Bleeker J. A. M., Ferrigno C., Jernigan J. G., 2003, ApJ, 590, 207
- Peterson et al. (2001) Peterson J. R. et al., 2001, A&A, 365, L104
- Pratt et al. (2007) Pratt G. W., Böhringer H., Croston J. H., Arnaud M., Borgani S., Finoguenov A., Temple R. F., 2007, A&A, 461, 71
- Rafferty et al. (2008a) Rafferty D. A., McNamara B. R., Nulsen P. E. J., 2008a, ApJ, 687, 899
- Rafferty et al. (2008b) Rafferty D. A., McNamara B. R., Nulsen P. E. J., 2008b, ApJ, 687, 899
- Rasera et al. (2008) Rasera Y., Lynch B., Srivastava K., Chandran B., 2008, ApJ, 689, 825
- Roettiger et al. (1997) Roettiger K., Loken C., Burns J. O., 1997, ApJS, 109, 307
- Sanders (2006) Sanders J. S., 2006, MNRAS, 371, 829
- Sanders & Fabian (2007) Sanders J. S., Fabian A. C., 2007, MNRAS, 381, 1381
- Sanders & Fabian (2008) Sanders J. S., Fabian A. C., 2008, MNRAS, 390, L93
- Schindler et al. (1997) Schindler S., Hattori M., Neumann D. M., Boehringer H., 1997, A&A, 317, 646
- Schmidt & Allen (2007) Schmidt R. W., Allen S. W., 2007, MNRAS, 379, 209
- Simionescu et al. (2009) Simionescu A., Roediger E., Nulsen P. E. J., Brüggen M., Forman W. R., Böhringer H., Werner N., Finoguenov A., 2009, A&A, 495, 721
- Taylor et al. (1994) Taylor G. B., Barton E. J., Ge J., 1994, AJ, 107, 1942
- Taylor et al. (2002) Taylor G. B., Fabian A. C., Allen S. W., 2002, MNRAS, 334, 769
- Vikhlinin et al. (2005) Vikhlinin A., Markevitch M., Murray S. S., Jones C., Forman W., Van Speybroeck L., 2005, ApJ, 628, 655
- Werner et al. (2008) Werner N., Durret F., Ohashi T., Schindler S., Wiersma R. P. C., 2008, Space Science Reviews, 134, 337
- White et al. (1997) White D. A., Jones C., Forman W., 1997, MNRAS, 292, 419
- Zhao et al. (1993) Zhao J., Sumi D. M., Burns J. O., Duric N., 1993, ApJ, 416, 51
- ZuHone et al. (2010) ZuHone J. A., Markevitch M., Johnson R. E., 2010, ApJ, 717, 908