Observations of the Blazar 3C 66A with the MAGIC Telescopes in Stereoscopic Mode
Abstract
We report new observations of the intermediate-frequency peaked BL Lacertae object 3C 66A with the MAGIC telescopes. The data sample we use were taken in 2009 December and 2010 January, and comprises 2.3 hr of good quality data in stereoscopic mode. In this period, we find a significant signal from the direction of the blazar 3C 66A. The new MAGIC stereoscopic system is shown to play an essential role for the separation between 3C 66A and the nearby radio galaxy 3C 66B, which is at a distance of only . The derived integral flux above is 8.3 of Crab Nebula flux and the energy spectrum is reproduced by a power law of photon index . Within errors, this is compatible with the one derived by VERITAS in 2009. From the spectra corrected for absorption by the extragalactic background light, we only find small differences between the four models that we applied, and constrain the redshift of the blazar to .
Subject headings:
BL Lacertae objects: individual (3C 66A) – galaxies: active – gamma rays: galaxies1. Introduction
Blazars make up the majority of extragalactic sources of very high energy (VHE; ) gamma rays. They are a subset of active galactic nuclei (AGNs), and consist of BL Lacertae (BL Lac) objects and flat-spectrum radio-loud quasars. The general framework to explain the gamma ray emission is that they are produced by charged particles which are accelerated in a relativistic jet. These jets are powered by gas accretion into a central supermassive black hole and are perpendicular to the accretion disc. When the jet is directed to us, the energy and flux of gamma-rays are boosted by the relativistic beaming effect (e.g., Blandford & Rees, 1978; Urry & Padovani, 1995).
Generally, the spectral energy distribution of AGNs can be described by two broad bumps. The lower energetic bump, at frequencies from radio to X-rays, is attributed to synchrotron emission from nonthermal relativistic electrons in the jet. The other bump, covering the X-ray to gamma-ray bands, could either be due to inverse Compton scattering of seed photons by the electrons (leptonic model, e.g., Maraschi et al., 1992; Dermer & Schlickeiser, 1993; Bloom & Marscher, 1996; Krawczynski, 2004) or due to hadronic interactions (see, e.g., Mannheim, 1993; Mücke & Protheroe, 2001; Mücke et al., 2003).
3C 66A was classified as a BL Lac object by Maccagni et al. (1987), based on its significant optical and X-ray variability. The synchrotron peak of this source is located between 1015 and 1016 Hz (Perri et al., 2003), therefore 3C 66A can also be classified as an intermediate-frequency peaked BL Lac object (IBL). The redshift of 3C 66A was determined to be by independent authors (Miller et al., 1978; Lanzetta et al., 1993). However, their measurements are based on the detection of one single line. Another observation of 3C 66A at a different spectral range was reported by Finke et al. (2008), but no spectral feature was found, and a lower limit of the redshift was derived to be 0.096. For the marginally resolved host galaxy (Wurtz et al., 1996), a redshift of 0.321 was found. Recently, through the investigation of the Large Area Telescope (LAT), on board the Fermi Gamma-ray Space Telescope (Fermi) satellite and VHE gamma-ray observations, upper limits for the redshift of 3C 66A were derived; (Prandini et al., 2010, confidence level) and (Yang & Wang, 2010).
Several gamma-ray observations of 3C 66A were performed since the 1990s. With the EGRET satellite, a GeV gamma-ray emission (3EG J0222+4253) was associated with 3C 66A (Hartman et al., 1999). However, due to the large EGRET point-spread function (PSF), an influence by the nearby pulsar PSR J0218+4232 could not be excluded (Kuiper et al., 2000). The Crimean Astrophysical Observatory claimed detections of 3C 66A above with an integral flux of (Stepanyan et al., 2002). Later observations by HEGRA and Whipple reported upper limits of (Aharonian et al., 2000) and (Horan et al., 2004), respectively. Additionally, the STACEE observation found a hint of signals at a 2.2 significance level and derived upper limits of and for thresholds of and , respectively (Bramel et al., 2005).
Recent VERITAS observations of 3C 66A taken from 2007 September to 2008 January and from 2008 September to 2008 November, for a total of 32.8 hr, resulted in a detection in VHE gamma rays (Acciari et al., 2009). The energy spectrum was derived with a photon index of . The integral flux of the VERITAS observations above is ( (6 of the Crab Nebula flux).
3C 66A has been monitored by Fermi/LAT since 2008 August, covering the latter part of the VERITAS observation. According to Abdo et al. (2009), who reported the first 5.5 months of Fermi/LAT observations of 3C 66A, the blazar showed a significant flux variability (a factor of 5–6 between the highest and lowest fluxes). The derived energy spectrum with the photon index of above , in combination with the VERITAS spectrum, indicates that the spectrum must soften above .
MAGIC observed the sky region around 3C 66A from 2007 August to December, obtaining a total exposure time after data quality cuts of 45.3 hr (Aliu et al., 2009b). These data revealed a significant VHE gamma-ray signal centered at 2h23m12s, 43∘0′7′′. This excess (named MAGIC J0223+430) coincides within uncertainties with the position of a nearby, Fanaroff-Riley-I (FRI) type galaxy 3C 66B (; Stull et al., 1975). Still, judging from the skyplot alone, the probability of the emission to originate from 3C 66A is 14.6. The energy spectrum of MAGIC J0223+430 was reproduced by a single power law with the index of . The integral flux above corresponded to ( (2.2 of the Crab Nebula flux). According to Tavecchio & Ghisellini (2008), the radio galaxy is also a plausible source of VHE gamma-ray radiation. Also, the recent MAGIC detection of IC 310 (Mariotti et al., 2010), a radio galaxy at a very similar redshift () indicates that 3C 66B might be feasible to explain all or part of the MAGIC detection from 2007.
2. Observations
From mid 2009 August, 3C 66A went into an optical high state which was reported by the Tuorla blazar monitoring program111http://users.utu.fi/kani/1m/index.html. This outburst triggered new MAGIC observations. The optical flux in the band reached a maximum level of in 2010 January, while the baseline flux in the historical data of the source is .
The observations were carried out with the MAGIC telescopes located on the Canary Island of La Palma (28.°8 N, 17.°8 W, ). The two diameter telescopes use the atmospheric Cherenkov imaging technique and allow for measurements at a threshold as low as in normal trigger mode.
We observed the blazar 3C 66A in several time slots between 2009 September and 2010 January. However, the sky imaging CCD cameras that are used to cross-check the telescope pointing (”starguider cameras”) only became fully applicable to stereo observations in early December. To allow for a high-confidence directional statement on the arcminute scale, we therefore only used data taken after these upgrades, which were 5.6 hr in total. Furthermore, we had to discard data with low event rates, affected by the exceptionally bad weather conditions in that winter. Finally, we had 2.3 hr of good quality data left after all quality cuts. They were taken on six days between 2009 December 5 and 2010 January 18, partly under low-intensity moon light conditions.
The data were taken using the false source tracking (wobble) method (Fomin et al., 1994), in which the pointing direction alternates every 20 minutes between two positions, offset by in RA from the source. These wobble positions were chosen with respect to 3C 66A, but the small distance to 3C 66B (0.°01) allows equal judgment for both sources. The data were taken at zenith angles between 13° and 35°.
3. Data Analysis
For the analysis, only stereoscopic events triggered by both MAGIC telescopes were used. They were analyzed in the MARS analysis framework (Moralejo et al., 2009), taking advantage both of the advanced single-telescope algorithms (e.g., Aliu et al., 2009a) and newly developed stereoscopic analysis routines. These routines are at present still subject to some minor improvements and will be discussed in more detail in a separate paper still in preparation, but are shortly outlined in the following.
Combining monoscopic and stereoscopic strategies, the direction of gamma rays is calculated for each telescope separately, using the random forest technique (Albert et al., 2008b), and later combined with the projected crossing point of the image axes, with a weight depending on the angle between the two shower images. Requiring a certain level of agreement between the different estimates furthermore improves the resolution, and also helps to reject the (less focused) hadron showers. Similarly, an energy estimator is determined from look-up tables for each telescope separately, and later combined to a common estimated energy.
The skymap generation, which is particularly important for the analysis of data from the 3C 66A/B region, follows a two-step algorithm. The first step is to generate an exposure model for the field of view in camera coordinates, for the quality cuts that were applied in the analysis. This is done by joining the distributions of photon-like events from the two wobble positions, taking advantage of the fact that the source, in relative camera coordinates, is on opposite sides for both wobble sets.
The second step is the calculation of an expected background event distribution in celestial coordinates, and its comparison to the actual event distribution. Before that comparison, a smearing with a Gaussian kernel is applied. The significances are calculated following Equation (17) of Li & Ma (1983), taking into account the higher precision of the background estimation implied by the above modeling.
The performance of the analysis software was optimized and checked with contemporaneous Crab Nebula data and MC. The Crab Nebula spectrum could be analyzed down to about , fully covering the range of the spectrum presented in the next paragraph. The achieved angular resolution, defined as the of a two-dimensional Gaussian function, is around 0.°1 at and approaching 0.°065 at higher energies. This defines the radius in which 39 of all photons of a point source are contained. The systematic uncertainty on the direction reconstruction is a product of the telescope pointing uncertainty and possible biases that occur in the reconstruction algorithms. The latter can be caused by irregularities in the shower images, such as missing camera pixels, inhomogeneous noise from stars in the field of view, or imperfections in the data acquisition electronics. Both the total pointing deviation and the telescope pointing precision of MAGIC were always monitored over the years (Bretz et al., 2009; Aleksić et al., 2010), and along with studies of contemporary stereo data of known direction lead to an estimate of the maximal systematic stereoscopic pointing uncertainty of 0.°025.
We also used the publicly accessible Fermi/LAT data222http://fermi.gsfc.nasa.gov/ to investigate the status of the source in the GeV energy range during the MAGIC observation period. The Fermi data were analyzed using the public software package LAT Science Tools v9.15.2, including the Instrument Response File P6_V3_DIFFUSE, and galactic, extragalactic and instrumental background models.
4. Results
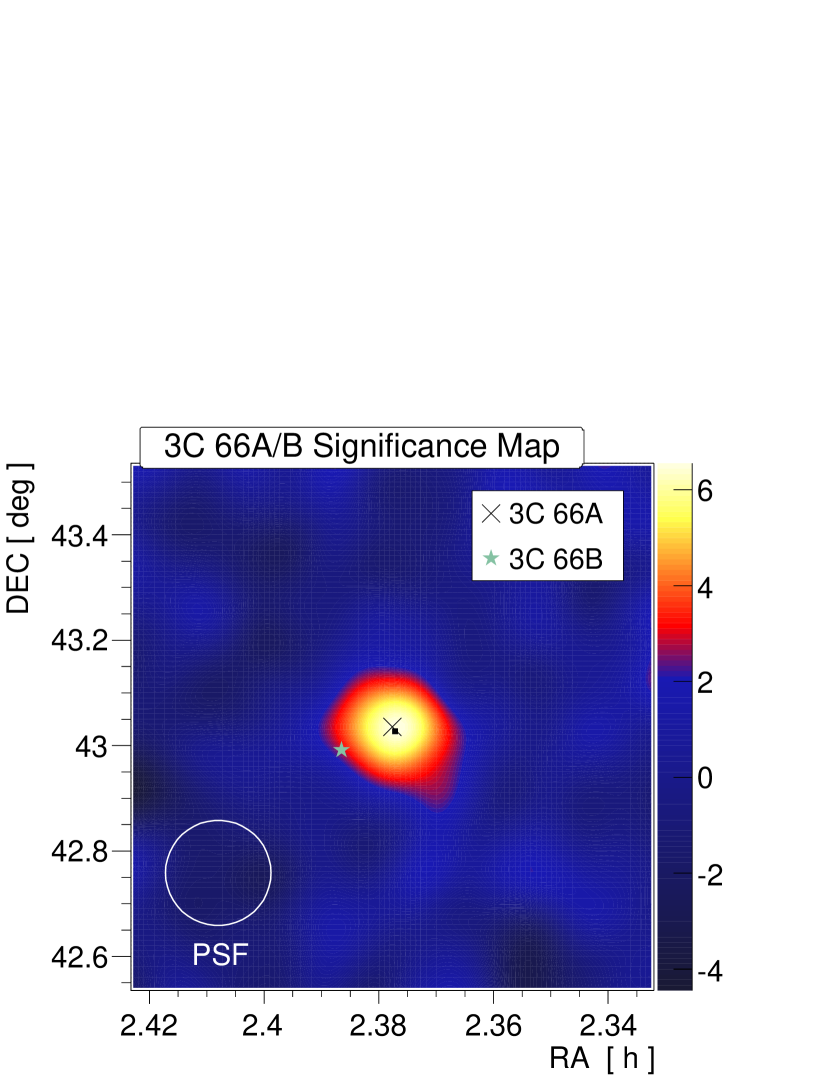
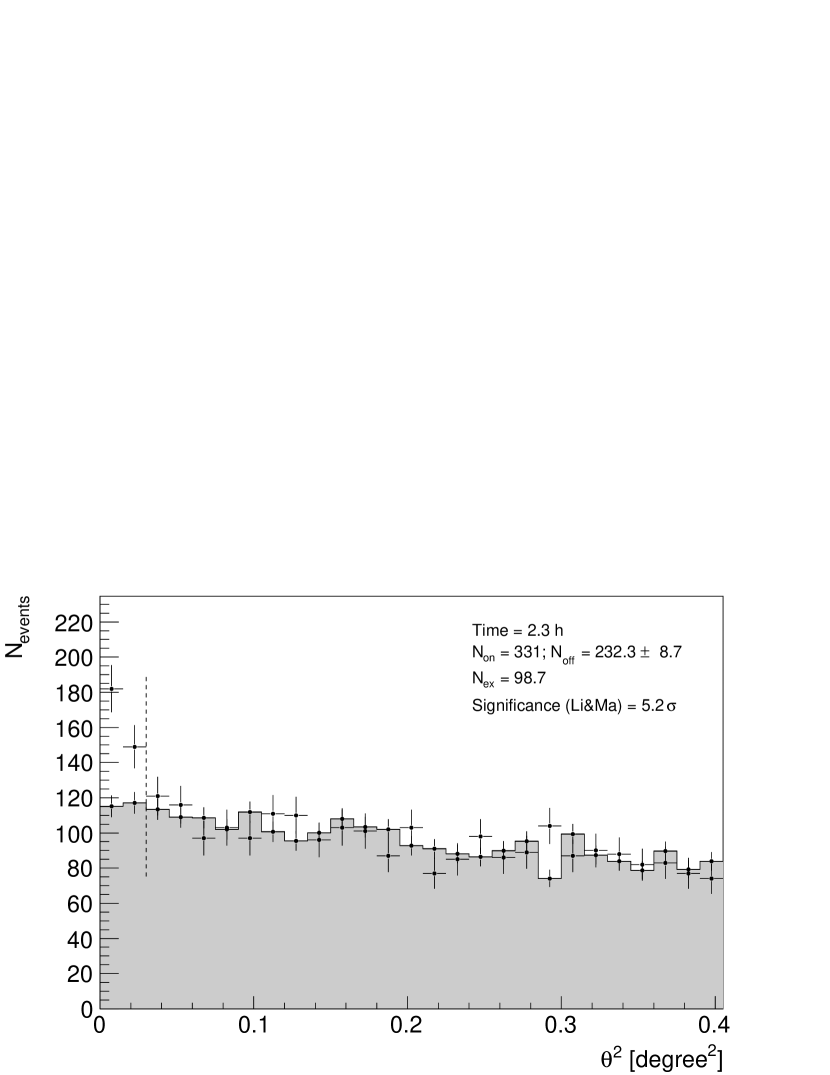
Figure 1 shows a skymap of the observed region above . The significance of the excess at the location of 3C 66A is . We cross-checked the detection also by investigating the distribution of squared angular distances () between photon directions and the assumed source position. The expected background is extracted from corresponding plots done with respect to other sky positions at similar distance from the pointing direction. Comparing the data with this expectation we find a significance of (see Figure 2). The difference in significance can be attributed to the different integration procedure of signal and background in the skymap, which generally leads to a slightly better background estimation and therefore a higher significance.
We also analyzed the data taken with and without moon light separately to find possible effects from the higher thresholds of individual camera pixels. However, we could not find a clear tendency beyond the statistical errors and thus decided to use all the data for the analysis.
Unlike in the 2007 observations of this sky region, the emission peak this time is clearly on top of 3C 66A. The fitted center of gravity of the excess (small black square in Figure 1) is at a distance of from 3C 66A, and from 3C 66B. While being compatible with the former, the statistical rejection power for the emission to emerge from the radio galaxy 3C 66B corresponds to 4.6 standard deviations. Even considering the unlikely case of a systematic offset exactly toward the blazar, the rejection significance of 3C 66B is at least . These numbers were confirmed by a second analysis with independent data quality selection and cut optimization procedures. The same result is found even when the photon direction is taken only from the projected crossing point of the two shower axes. We therefore conclude that the signal we see this time emerges from the blazar 3C 66A.
It shall be mentioned that this result is a clear merit of the angular resolution and background rejection of the new stereoscopic system. In fact, if we compare the above stereo directional reconstruction algorithm to the MAGIC-I algorithm alone, we find basically the same result, but the statistical error of the fitted source position increases roughly by a factor of two. Consequently, the rejection significance of 3C 66B would be less than 2 standard deviations, and the total detection significance would be below 5 standard deviations.
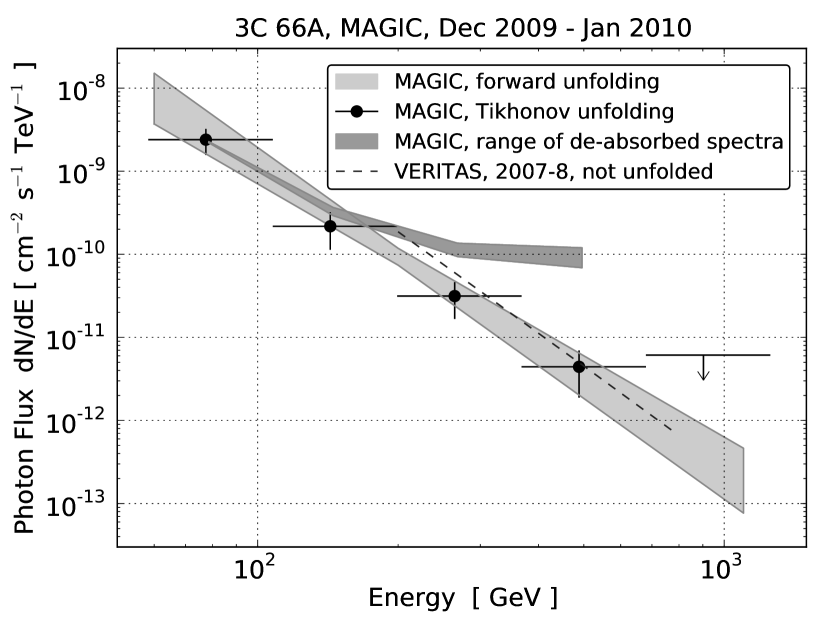
The energy spectrum of 3C 66A was derived using four different unfolding algorithms (Albert et al., 2007) which correct for efficiency, smearing and biasing effects in the energy response of the detector. The most conservative of these methods is the so-called forward unfolding, in which essentially a spectral shape is assumed a priori, and its parameters are adjusted by iteratively folding the assumed spectrum with the response function until the predicted distribution of estimated energies matches optimally the actually measured distribution. With all unfolding methods, we found that the data are well compatible with a power law of the form
| (1) |
with a photon index and a flux constant at of . The integral flux above corresponds to (8.3 Crab Nebula flux). Here, the parameters and statistical errors are taken from the forward unfolding, while the systematic errors reflect the variations among the other unfolding algorithms, plus several standard uncertainties discussed in Albert et al. (2008a). The systematic flux uncertainties add up to 36 in total. Figure 3 displays the function we fitted through forward unfolding, and spectral points derived using the Tikhonov unfolding method (Tikhonov & Arsenin, 1979).
Due to the shortness of our observation, we cannot discuss flux variability with these data. However, comparing the flux to the one from our previous observation of the 3C 66A/B region confirms the VERITAS report of 3C 66A being a variable source in general.
We also analyzed the Fermi data from the same time period. The flux variability we found in a week-to-week light curve is not significant. Given the statistical uncertainties of the light curve, we would be sensitive on level to flux variations of 60 or greater, and conclude the variability in the days we observed must be less than that. The averaged flux above is roughly comparable to the averaged flux over the first 5.5 months (Abdo et al., 2009), and lower than that seen in 2008 October, when a strong TeV flare was observed by VERITAS. A single power-law model can reproduce the source spectrum, and the photon index is compatible with the one found in Abdo et al. (2009), indicating no significant change in the overall spectral shape.
5. Discussions and Conclusions
MAGIC observed the 3C 66A/B region in 2009 December and 2010 January, during an optical active state of 3C 66A and detected a clear VHE gamma-ray signal. The excess coincides with the position of 3C 66A, and we rule out the emission to come from 3C 66B at a confidence level of . This detection does not contradict the earlier MAGIC detection, though, which favored 3C 66B as the VHE source. On the one hand, because the observation time of 2.3 hr would be too short to detect the VHE emission of 3C 66B, if on a similar flux level as in 2007, and on the other hand, because its flux may be even lower than before. In fact, 3C 66A might have to be in a low flux state in order not to outshine the comparably weak emission from 3C 66B at this close distance of about of the PSF of the MAGIC telescopes.
The obtained energy spectrum is softer than in the previous MAGIC detection () and compatible with the VERITAS spectrum of 3C 66A. Compared to VERITAS, the MAGIC measurement has a lower threshold and the spectrum is extending to well below . The flux level of 8.3 Crab Nebula flux is similar to the one reported by VERITAS (6), and significantly higher than in the previous MAGIC observation (2.2).
The VHE photons produced at the source can be absorbed in the intergalactic space by pair production with the low energy (UV to infrared) photons of extragalactic background light (EBL; Stecker et al., 1992; Hauser & Dwek, 2001). The amount of absorption depends on the energy and redshift, and can be corrected for in the data, assuming a certain modeling of the EBL density. Such a de-absorbed spectrum can be regarded as the spectrum we would measure if there were no EBL. To derive a de-absorbed spectrum, we tested several state of the art EBL models, namely, Franceschini et al. (2008), the fiducial model in Gilmore et al. (2009), Kneiske & Dole (2010), and Domínguez et al. (2010). The EBL corrections were applied in the spectrum unfolding procedure (see above), using the full covariance matrix to correctly calculate the errors. The spread of the differential, de-absorbed flux spectra, obtained with the four models and assuming the redshift of , is shown as the dark shaded area in Figure 3. The de-absorbed photon indices for the four EBL modelings are listed in Table 1. The differences between the de-absorbed spectra are very small, although the one corrected after Kneiske & Dole (2010) is slightly harder than the others. This also reflects the fact that also the predicted EBL shapes and densities are very similar in the first three models, but the overall density in Kneiske & Dole (2010) is somewhat higher.
| Model | |
|---|---|
| Franceschini et al. (2008) | |
| Gilmore et al. (2009) | |
| Domínguez et al. (2010) | |
| Kneiske & Dole (2010) |
From most VHE emission models, the de-absorbed spectrum is expected not to be concave, i.e., rising toward higher energies. This can be tested both by comparing the points of our own spectrum, but also by a comparison with the Fermi photon index (1.98). The fact that we find our spectrum neither significantly concave nor harder than in Fermi suggests that the assumed redshift of does not contradict our observations. In fact, we investigated the plausibility of the redshift, assuming that the intrinsic spectrum is not expected to be exponentially rising, and thus have a pileup, at highest energies. This common method was previously used and described, for example, in Mazin & Goebel (2007); Mazin & Raue (2007). Using the Franceschini et al. (2008) model and the likelihood ratio test between the ”power law” and ”power law + pile-up” hypotheses, as described in the reference, we derive an upper limit on the redshift of .
The results derived in this paper demonstrate the advantages of the MAGIC stereoscopic system. Further MAGIC and other gamma-ray observations of this region can provide interesting information about the IBL type BL Lac object 3C 66A, and, during low flux periods of that, also the FRI type galaxy 3C 66B.
References
- Abdo et al. (2009) Abdo, A. A., et al. 2009, ApJ, 707, 1310
- Acciari et al. (2009) Acciari, V. A., et al. 2009, ApJ, 693, L104
- Aharonian et al. (2000) Aharonian, F., et al. 2000, A&A, 353, 847
- Albert et al. (2007) Albert, J., et al. 2007, Nucl. Instrum. Methods A, 583, 494
- Albert et al. (2008a) Albert, J., et al. 2008a, ApJ, 674, 1037
- Albert et al. (2008b) Albert, J., et al. 2008b, Nucl. Instrum Methods A, 588, 424
- Aleksić et al. (2010) Aleksić, J., et al. 2010, A&A, 524, A77
- Aliu et al. (2009a) Aliu, E., et al. 2009a, Astropart. Phys.,30, 293
- Aliu et al. (2009b) Aliu, E., et al. 2009b, ApJ, 692, L29
- Blandford & Rees (1978) Blandford, R. D., & Rees, M. J., 1978, in Pittsburgh Conf. on BL Lac Objects, ed. A. M. Wolfe (Pittsburgh, PA: Univ. Pittsburgh), 328
- Bloom & Marscher (1996) Bloom, S. D., & Marscher, A. P. 1996, ApJ, 461, 657
- Bramel et al. (2005) Bramel, D. A., et al. 2005, ApJ, 629, 108
- Bretz et al. (2009) Bretz, T., Dorner, D., Wagner, R. M., & Sawallisch, P. 2009, Astropart. Phys., 31, 92
- Dermer & Schlickeiser (1993) Dermer, C. D., & Schlickeiser, R. 1993, ApJ, 416, 458
- Domínguez et al. (2010) Domínguez, A., et al. 2010, MNRAS, in press (arXiv:1007.1459)
- Finke et al. (2008) Finke, J. D., Shields, J. C., Böttcher, M., & Basu, S. 2008, A&A, 477, 513
- Fomin et al. (1994) Fomin, V. P., Stepanian, A. A., Lamb, R. C., Lewis, D. A., Punch, M., & Weekes, T. C. 1994, Astropart. Phys., 2, 137
- Franceschini et al. (2008) Franceschini, A., Rodighiero, G., & Vaccari, M. 2008, A&A, 487, 837
- Gilmore et al. (2009) Gilmore, R. C., Madau, P., Primack, J. R., Somerville, R. S., & Haardt, F. 2009, MNRAS, 399, 1694
- Hartman et al. (1999) Hartman, R. C., et al. 1999, ApJS, 123, 79
- Hauser & Dwek (2001) Hauser, M. G., & Dwek, E. 2001, ARA&A, 39, 249
- Horan et al. (2004) Horan, D., et al. 2004, ApJ, 603, 51
- Kneiske & Dole (2010) Kneiske, T. M., & Dole, H. 2010, A&A, 515, A19
- Krawczynski (2004) Krawczynski, H. 2004, New Astron. Rev., 48, 367
- Kuiper et al. (2000) Kuiper, L., Hermsen, W., Verbunt, F., Thompson, D. J., Stairs, I. H., Lyne, A. G., Strickman, M. S., & Cusumano, G. 2000, A&A, 359, 615
- Lanzetta et al. (1993) Lanzetta, K. M., Turnshek, D. A., & Sandoval, J. 1993, ApJS, 84, 109
- Li & Ma (1983) Li, T.P., & Ma, Y.Q. 1983, ApJ, 272, 317
- Maccagni et al. (1987) Maccagni, D., Garilli, B., Schild, R., & Tarenghi, M. 1987, A&A, 178, 21
- Mannheim (1993) Mannheim, K. 1993, A&A, 269, 67
- Maraschi et al. (1992) Maraschi, L., Ghisellini, G., & Celotti, A. 1992, ApJ, 397, 5
- Mariotti et al. (2010) Mariotti, M. et al. 2010, Atel, 2510
- Mazin & Goebel (2007) Mazin, D., & Goebel, F. 2007, ApJ, 655, L13
- Mazin & Raue (2007) Mazin, D., & Raue, M. 2007, A&A, 471, 439
- Miller et al. (1978) Miller, J. S., French, H. B., & Hawley, S. A. 1978, in Pittsburgh Conf. BL Lac Objects, ed. A. M. Wolfe (Univ. Pittsburgh, PA), 176
- Moralejo et al. (2009) Moralejo, A., et al. 2009, in Proc. 31st ICRC (Łódź), 469 (arXiv:0907.0943)
- Mücke & Protheroe (2001) Mücke, A., & Protheroe, R. J. 2001, Astropart. Phys., 15, 121
- Mücke et al. (2003) Mücke, A., Protheroe, R. J., Engel, R., Rachen, J. P., & Stanev, T. 2003, Astropart. Phys., 18, 593
- Perri et al. (2003) Perri, M., et al. 2003, A&A, 407, 453
- Prandini et al. (2010) Prandini, E., Bonnoli, G., Maraschi, L., Mariotti, M., & Tavecchio, F. 2010, MNRAS, 405, L76
- Stecker et al. (1992) Stecker, F. W., de Jager, O. C., & Salamon, M. H. 1992, ApJ, 390, L49
- Stepanyan et al. (2002) Stepanyan, A. A., Neshpor, Y. I., Andreeva, N. A., Kalekin, O. P., Zhogolev, N. A., Fomin, V. P., & Shitov, V. G. 2002, Astron. Rep., 46, 634
- Stull et al. (1975) Stull, M. A., Price, K. M., Daddario, L. R., Wernecke, S. J., Graf, W., & Grebenkemper, C. J. 1975, AJ, 80, 559
- Tavecchio & Ghisellini (2008) Tavecchio, F., & Ghisellini, G. 2008, MNRAS, 394, L131
- Tikhonov & Arsenin (1979) Tikhonov, A.N., & Arsenin, V.J. 1979, Methods for the Solution of Ill-posed Problems (Moscow: Nauka)
- Urry & Padovani (1995) Urry, M. & Padovani, P. 1995, PASP, 107, 803
- Wurtz et al. (1996) Wurtz, R., Stocke, J. T., & Yee, H. K. C. 1996, ApJS, 103, 109
- Yang & Wang (2010) Yang, J., & Wang, J. 2010, PASJ, 62, L23