Approximating Mexican highways
with slime mould
Abstract
Plasmodium of Physarum polycephalum is a single cell visible by unaided eye. During its foraging behavior the cell spans spatially distributed sources of nutrients with a protoplasmic network. Geometrical structure of the protoplasmic networks allows the plasmodium to optimize transport of nutrients between remote parts of its body. Assuming major Mexican cities are sources of nutrients how much structure of Physarum protoplasmic network correspond to structure of Mexican Federal highway network? To find an answer undertook a series of laboratory experiments with living Physarum polycephalum. We represent geographical locations of major cities (nineteen locations) by oat flakes, place a piece of plasmodium in Mexico city area, record the plasmodium’s foraging behavior and extract topology of nutrient transport networks. Results of our experiments show that the protoplasmic network formed by Physarum is isomorphic, subject to limitations imposed, to a network of principle highways. Ideas and results of the paper may contribute towards future developments in bio-inspired road planning.
Keywords: bio-inspired computing, Physarum polycephalum, pattern formation, Mexican highways, road planning
1 Introduction
Plasmodium of Physarum polycephalum111Order Physarales, subclass Myxogastromycetidae, class Myxomecetes is a single cell with many diploid nuclei. The plasmodium feeds on microbial creatures and microscopic food particles. When colonizing its habitat the plasmodium develops an optimal network of protoplasmic tubes or veins. The protoplasmic network is optimal in a sense that it maximizes number of food sources occupied, minimizes time for nutrient transport between distant parts of the plasmodium’s body, and maximizes area of substrate covered by sensorial activity.
A plasmodium is a single cell yet can be considered as large-scale collective of simple entities with distribute and massive-parallel sensing, computation and actuation. A sensing is parallel because the plasmodium can detect and determine position of many source of chemo-attractants, including nutrients, and also make decentralized sensing of environmental conditions, including humidity, temperature and illumination. An actuation is parallel because the plasmodium can propagate in several directions in parallel, the plasmodium can occupy and colonize many food sources at the same. With regards to parallel computation, the plasmodium is a wave-based massively-parallel reaction-diffusion chemical computer [2, 7, 10]. A computation in the plasmodium is implemented by interacting bio-chemical and excitation waves [19], redistribution of electrical charges on plasmodium’s membrane [1] and spatio-temporal dynamics of mechanical waves [19]. Experimental proofs of P. polycephalum computational abilities include approximation of shortest path [22] and hierarchies of planar proximity graphs [6], computation of plane tessellations [31], implementation of primitive memory [28], execution of basic logical computing schemes [36], control of robot navigation [37], and natural implementation of spatial logic and process algebra [30]. See overview of Physarum-based computers in [10].
Approximation of shortest or even computation of a transportation network have been already a hot application for unconventional computing scientists. Nature-inspired computing paradigms and experimental implementations were successfully applied to calculation of a minimal-distance path between two given points in a space or a road network. Thus, a shortest-path problem is solved in experimental reaction-diffusion chemical systems [2], gas-discharge analog systems [27], spatially extended crystallization systems [8], formation of fungi mycelian networks [15], and using computer and mathematical models of collective insects [12] and Physarum polycephalum [34]. Previously [5] we have evaluated a road-modeling potential of P. polycephalum, however no conclusive results were presented back in 2007. A step forward biological-approximation, or evaluation, of man-made road networks was done in our previous paper on approximation of United Kingdom motorways by plasmodium of P. polycephalum [9]. Results obtained in [9] were refreshing yet convincing. In general, we shown that transportation links constructed by Physarum match man-made motorways, there are however subtle differences between slime mould and motorways, see details in [10]. The experimental laboratory approach to slime-mould-based approximation of road networks was tested on just one country (United Kingdom) so far. To make this bio-inspired approach truly universal we must study how the plasmodium will behave on different setups of cities and different shapes of countries. In present paper we have chosen Mexico as a test country for plasmodium approximation because it is the most populated Spanish-speaking country with diverse landscapes, sudden north-south changes in land size, highest level of public transport in Latin America, and high-concentration pollutants in central part of the country. These features are not unique but enhanced and, what it is most important, they provide very good test-bed for studies of nature-inspired approaches to road planning.
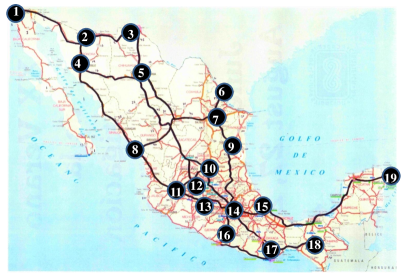
Mexico ranks 7th in highways length with 6,335 kilometers (3,935 miles). Followed by (1) United States with 91,541 km (56,859 mi), (2) China with 24,474 km (15,202 mi), (3) Germany with 11,400 km (7,081 mi), (4) France with 10,300 km (6,398 mi), (5) Spain with 9,063 km (5,629 mi), and Italy with 8,957 km (5,563 mi).222http://www.publicpurpose.com/hwy-worldmotorway.htm Political division constitute 31 states and one Federal District (DF or Mexico city) that centralize the main activities in the whole republic, for this reason main highways at least connect one time Mexico city from any place. With a total population of 103,263,388 (2005 estimation) on a territorial extension of 1,964,375 km2 (758,450 mi2).333National Institute of Statistical and Geographic (INEGI Spanish abbreviation) http://inegi.org.mx/ Mexico has a relevant and strategical geographical position because it is a natural land transit between North America (mainly United States and Canada) with Mexico self, Central and South America, i.e., all Latin America countries. This contributes towards essential components of economical structure for the United States in transporting prime materials, natural resources, imports and exports, and labor migration. For this reason years ago extensive highways were built from Central America across Mexico to the United States, and from coast to coast.
The paper is structured as follows. In Sect. 2 we describe experimental setup and software analysis. Experimental laboratory results on Physarum approximation of transport links are presented in Sect. 3. Analysis of Physarum and man-made highways in terms of planar proximity graphs is provided in Sect. 4. Directions of future studies are outlined in Sect. 5.
2 Methods
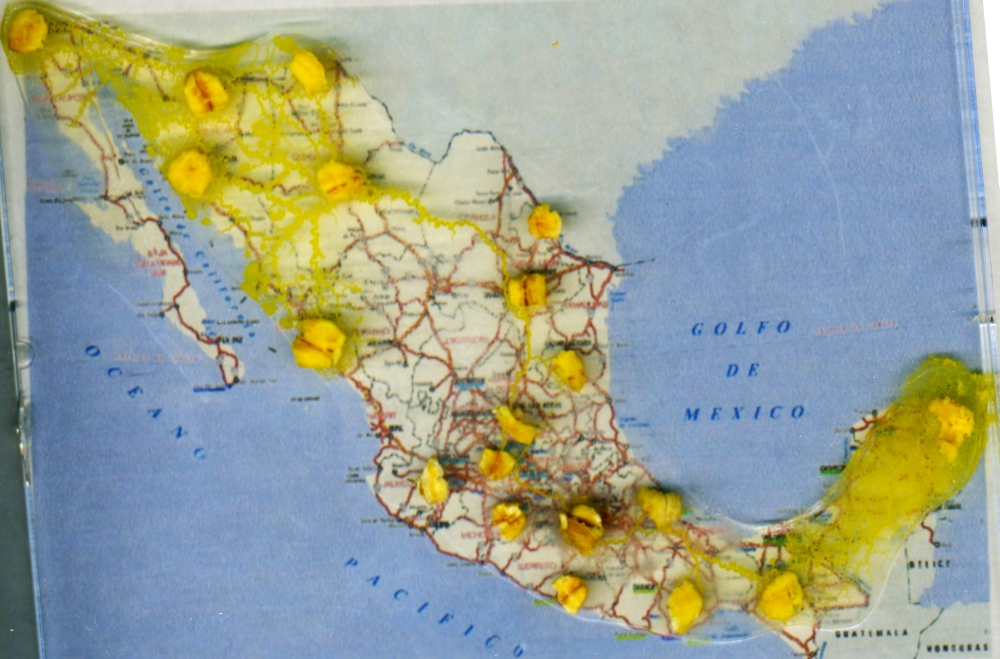
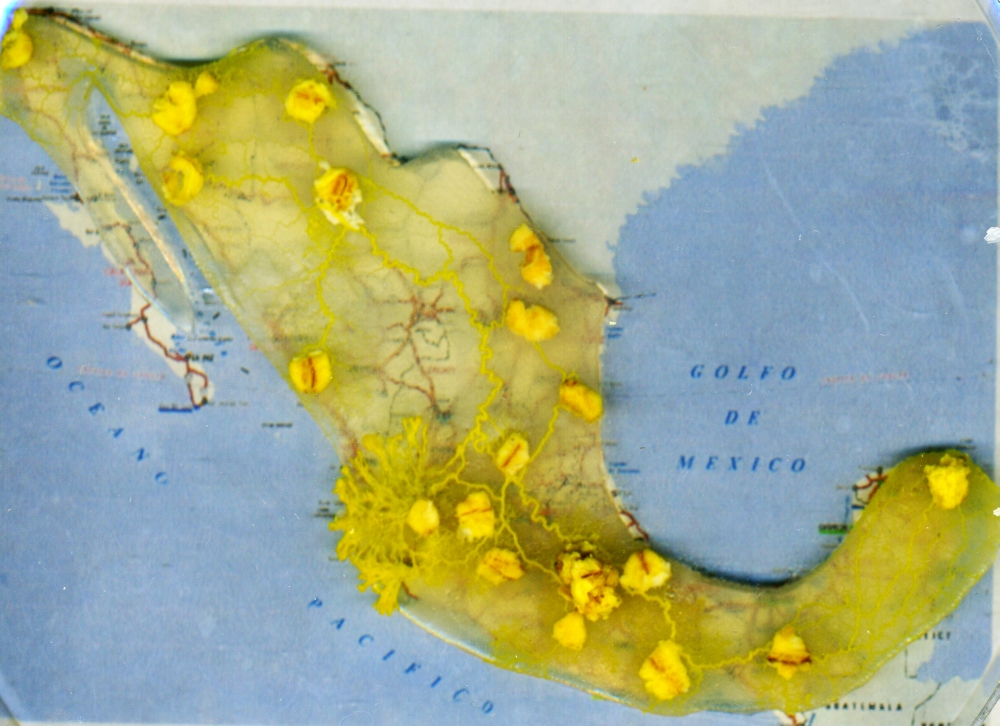
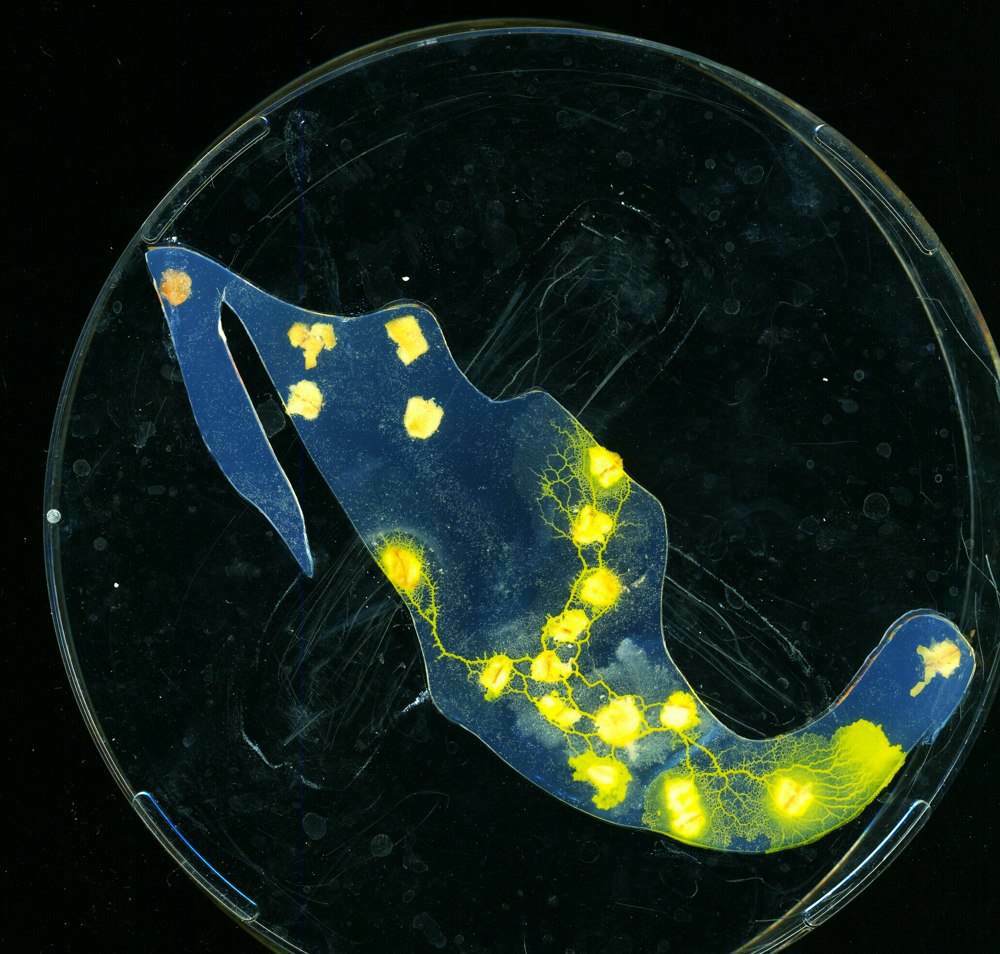
Plasmodium of P. polycephalum is cultivated in plastic container, on paper kitchen towels sprinkled with still drinking water and fed with oat flakes444Asda’s Smart Price Porridge Oats. For experiments we use mm polystyrene square and round Petri dishes. We use 2% agar gel (Select agar, Sigma Aldrich). Agar plates are cut in a shape of Mexico.
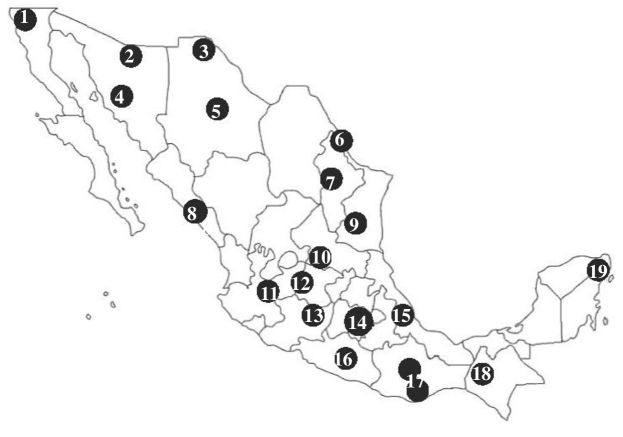
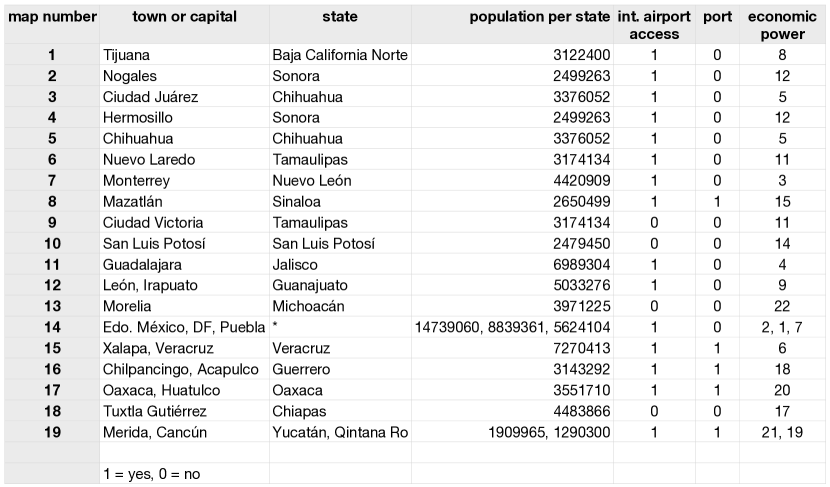
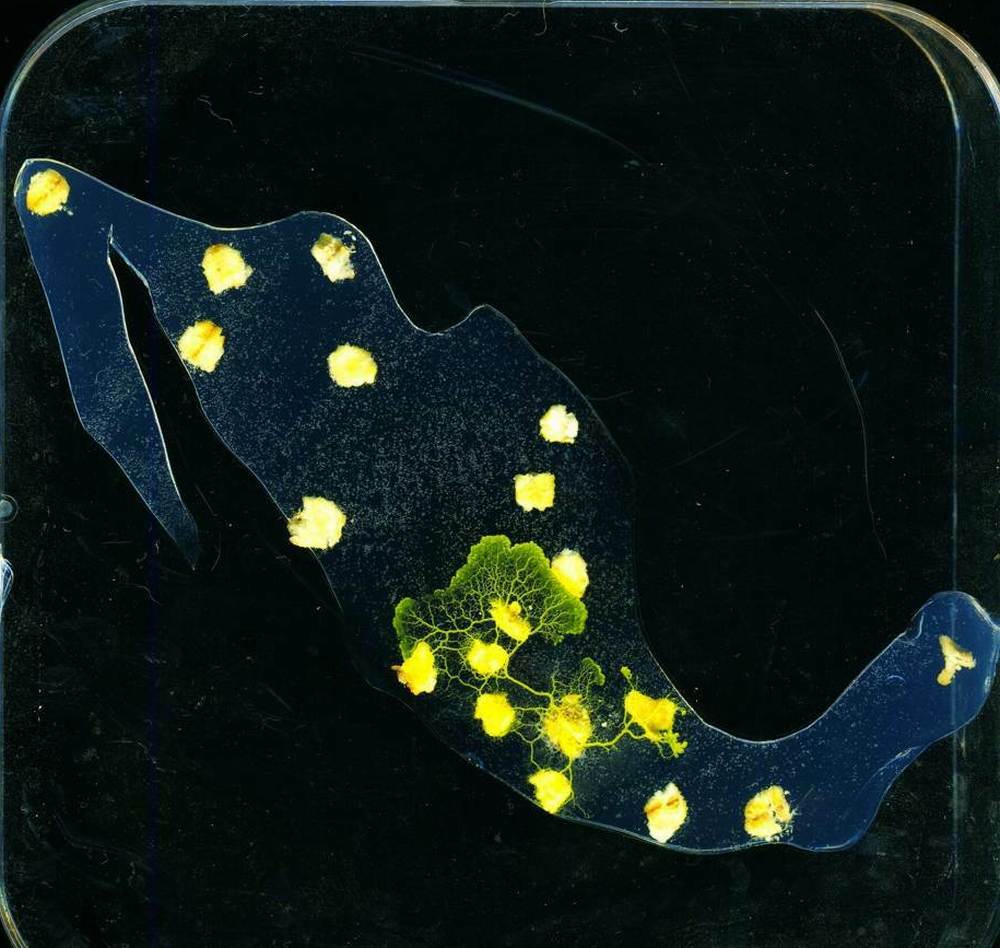
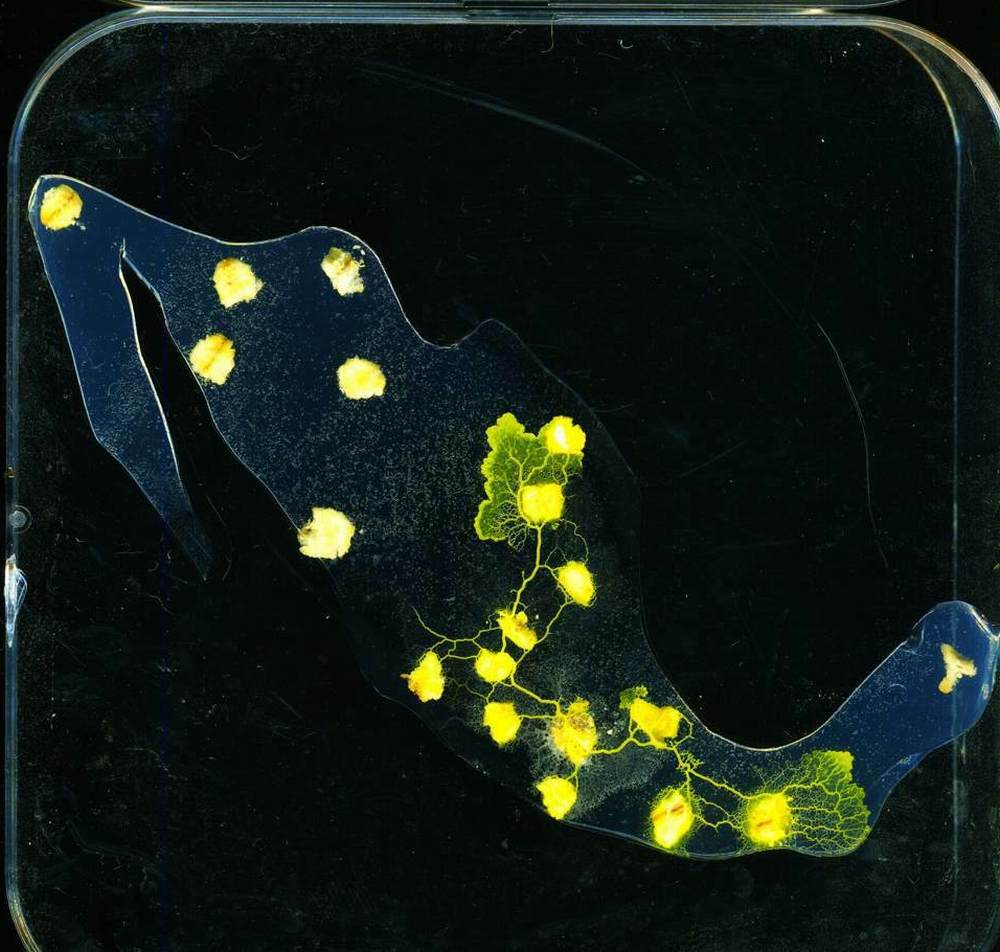
We selected 19 most populous urban areas, based on a selection of relevant features, including economic impact, sea and air ports, and tourist attractions. Details of the areas are provided in Fig. 2.
Further we refer to the urban regions as . These region of are projected onto gel and oat flakes, of size approximately matching size and shape of the regions, are placed in the positions of the regions (Fig. 1b). At the beginning of each experiment a piece of plasmodium, usually already attached to an oat flake, is placed in the region corresponding to Edo. México, DF, Puebla (region 14 in Fig. 1a).
The Petri dishes with plasmodium are kept in darkness, at temperature 22-25 C, except for observation and image recording. We undertook 26 experiments. Periodically the dishes are scanned using Epson Perfection 4490 scanner. Scanned images of dishes are enhanced for higher visibility, saturation increased to 55, and contrast to 40.
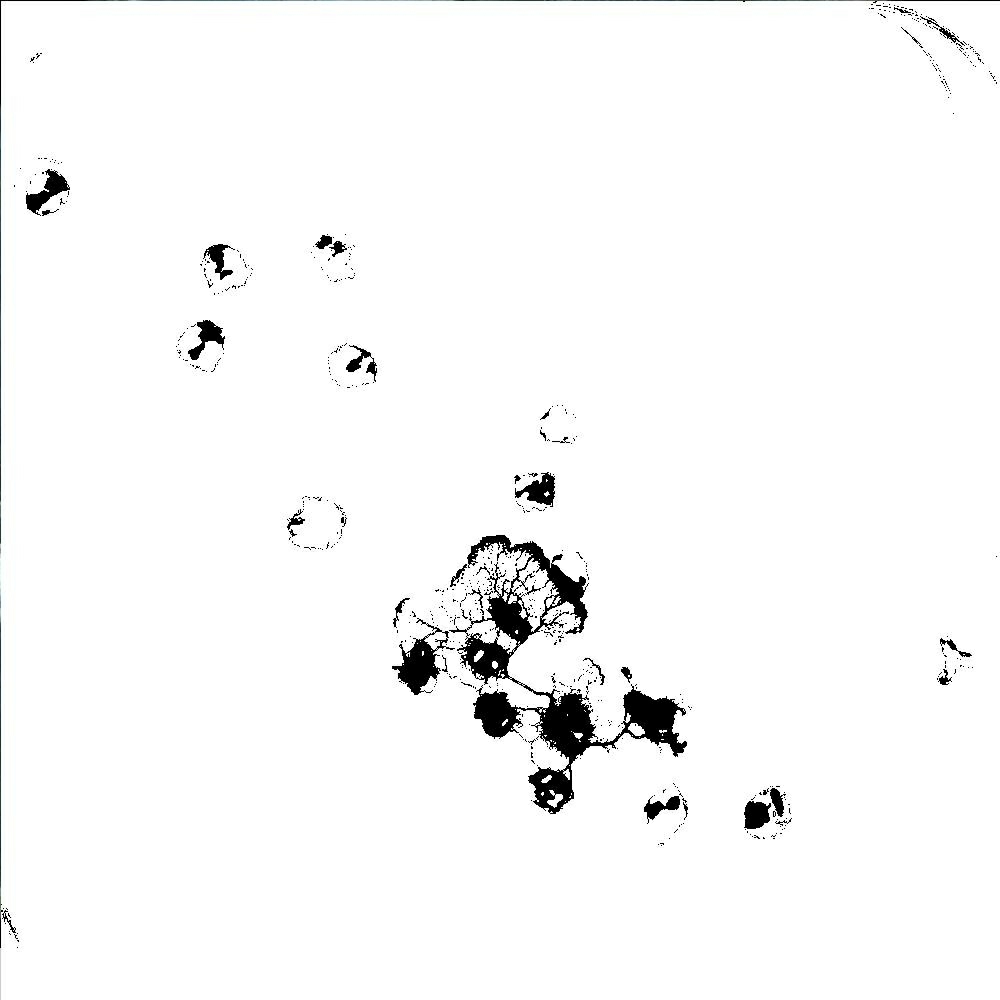
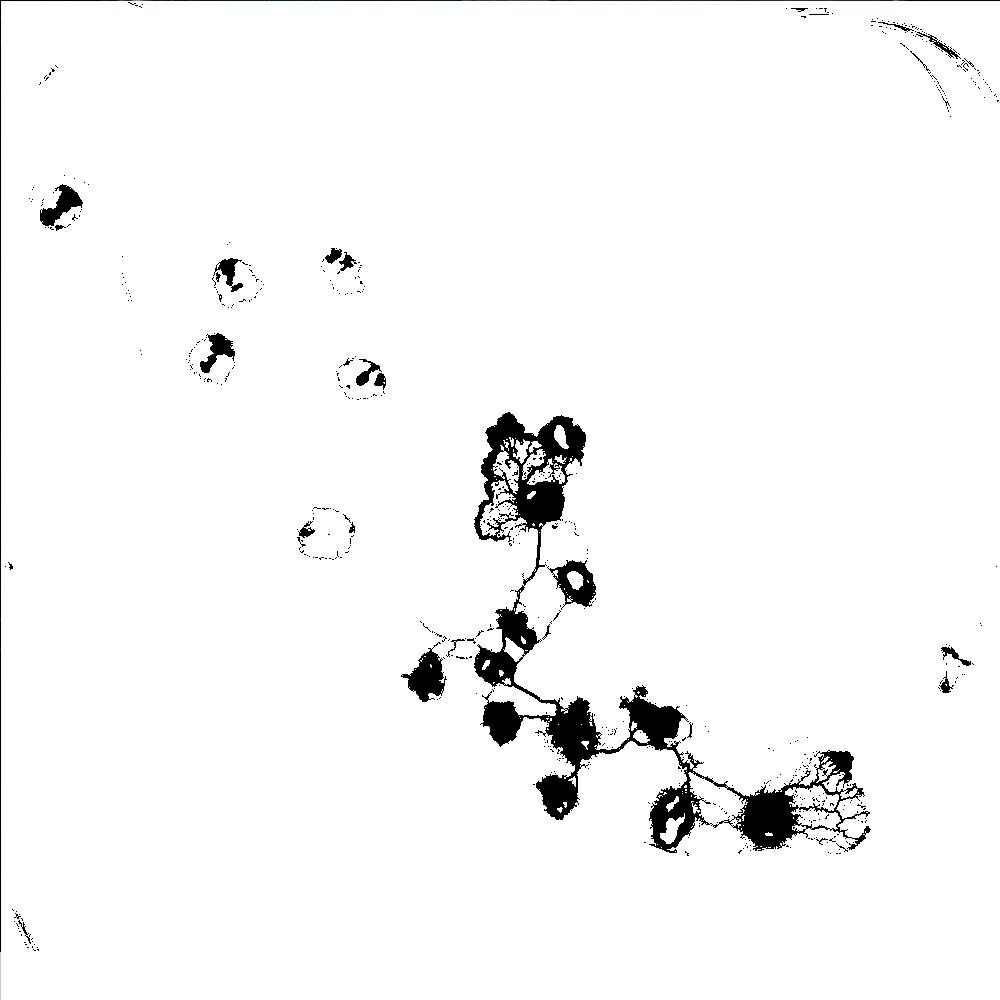
To ease readability of experimental images we provide a binary version of each image. The binarization is done as follows. Each pixel of a color image is assigned black color if red and green components of its RGB color exceed some specified thresholds, , and blue component does not exceed some threshold value ; otherwise, the pixel is assigned white color (exact values of the thresholds are indicated in the figure captions as .
3 Transport links via foraging
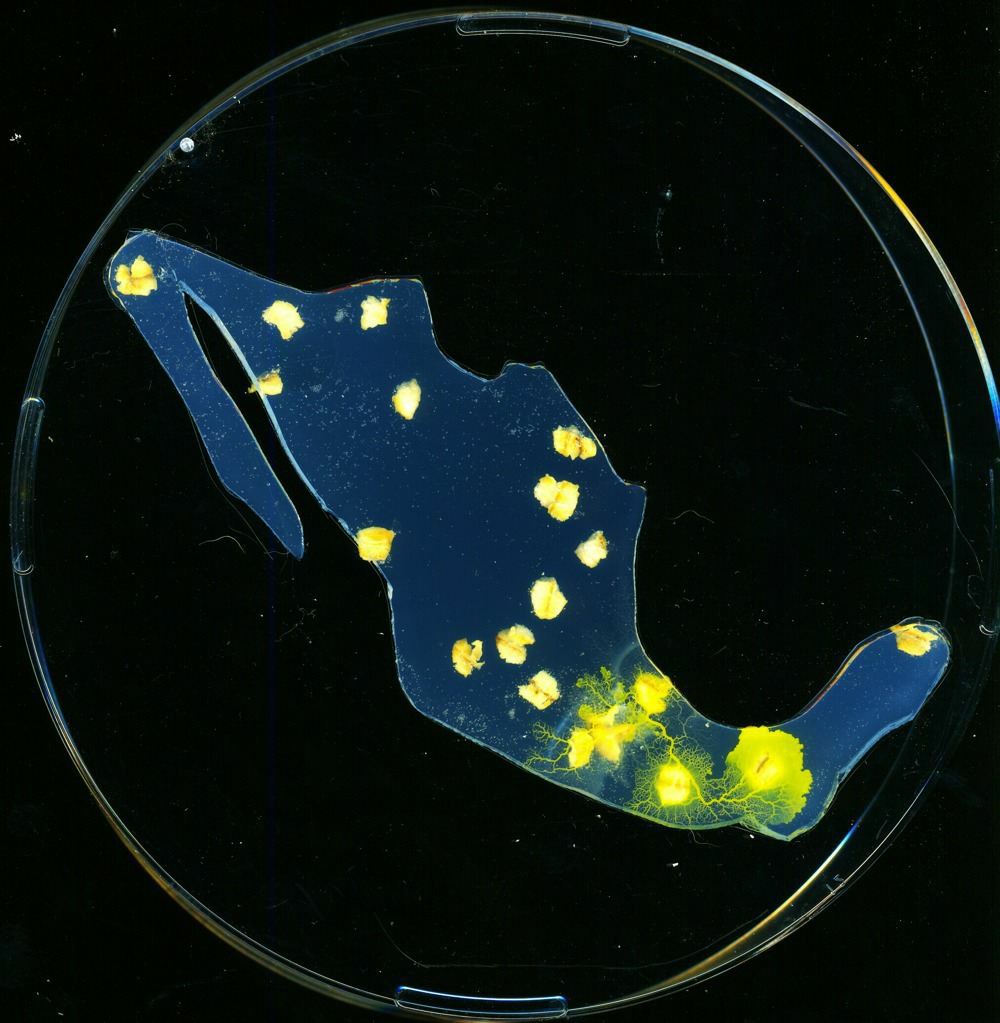
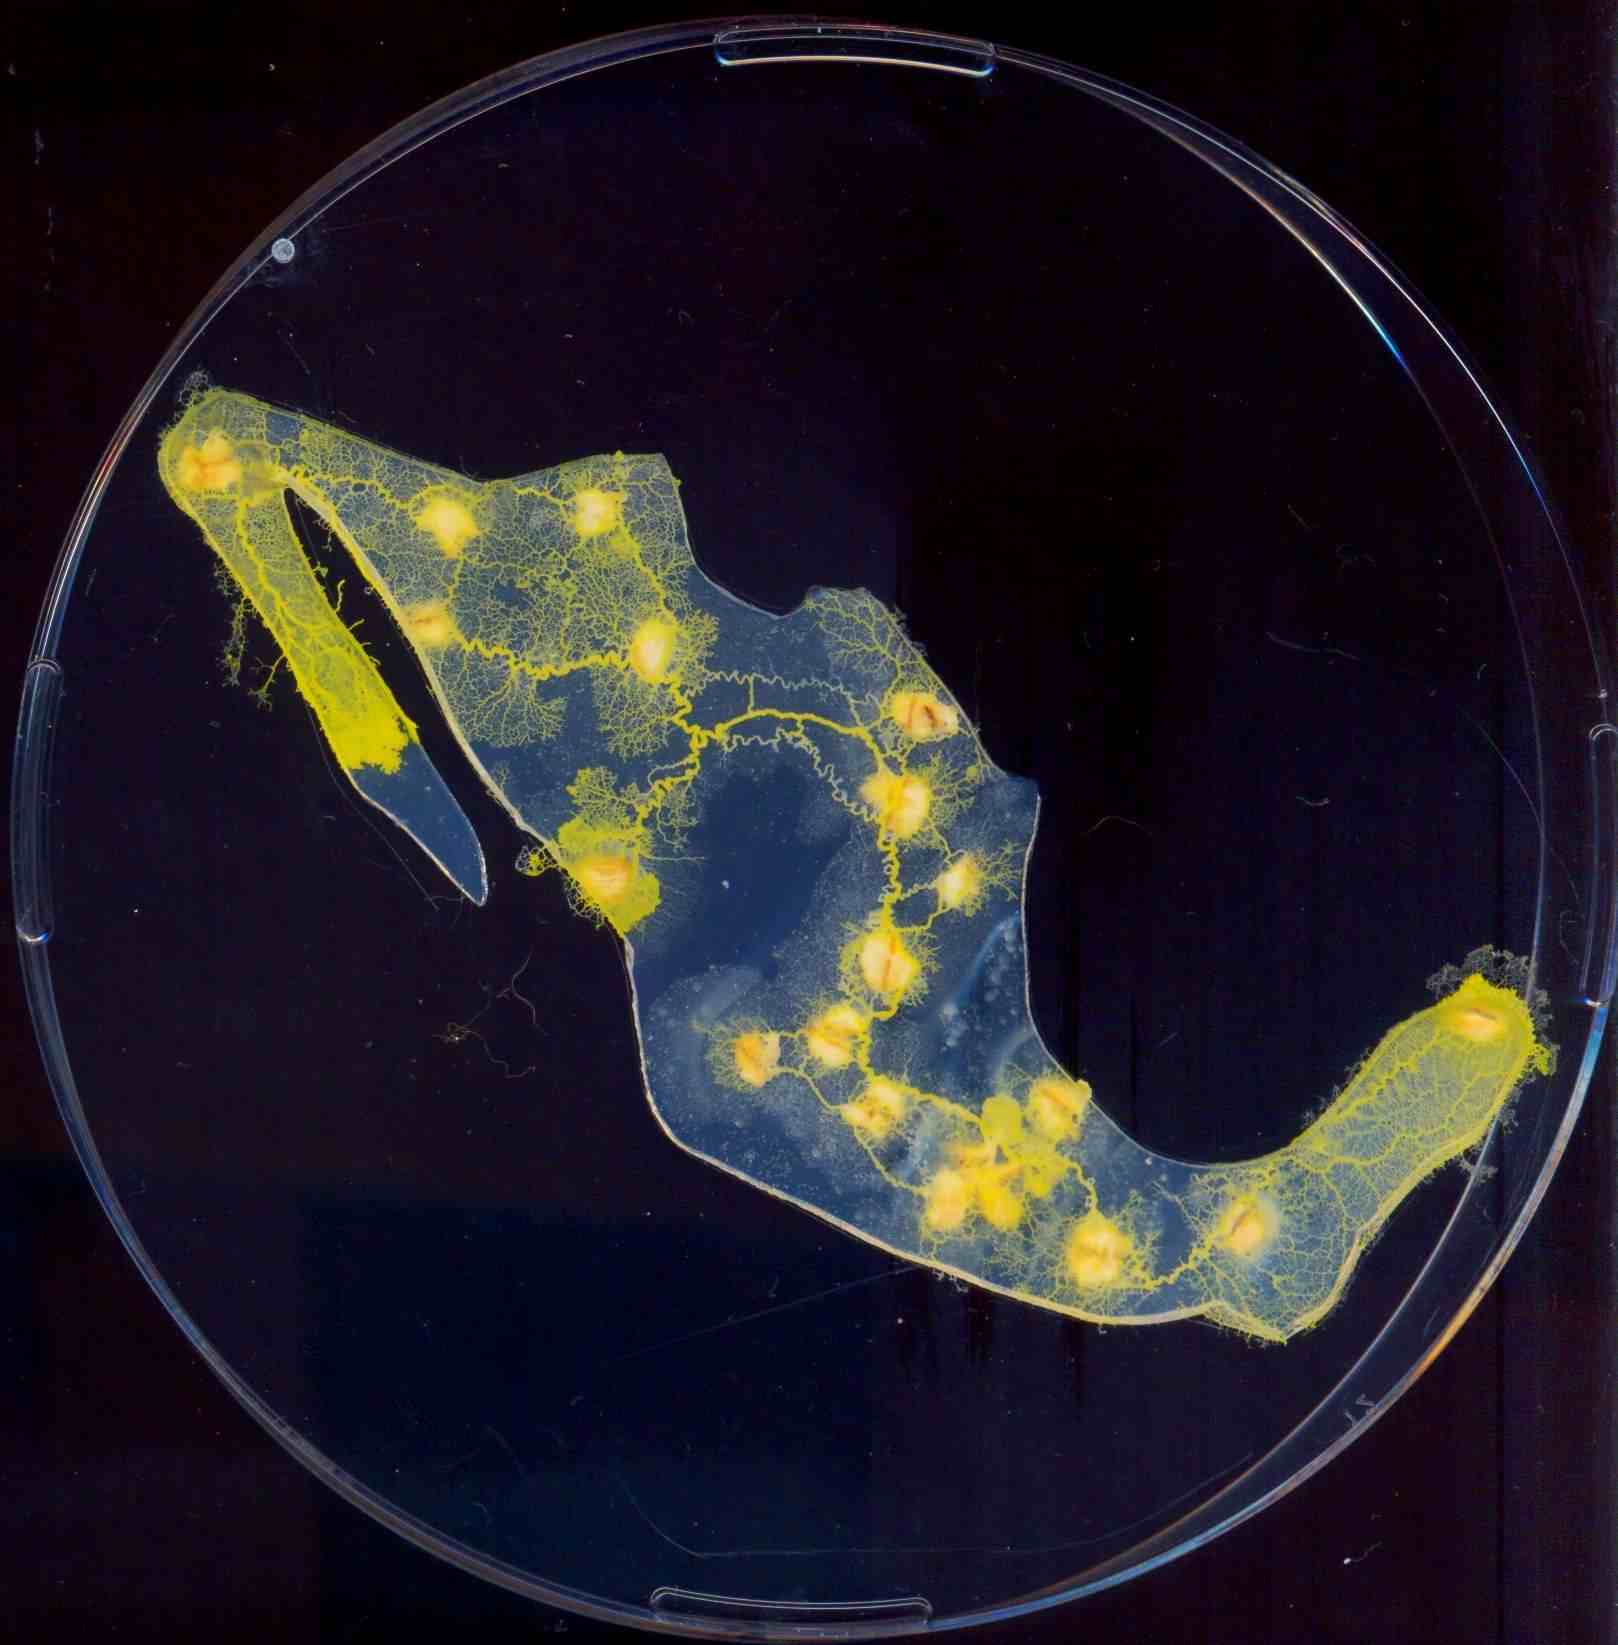
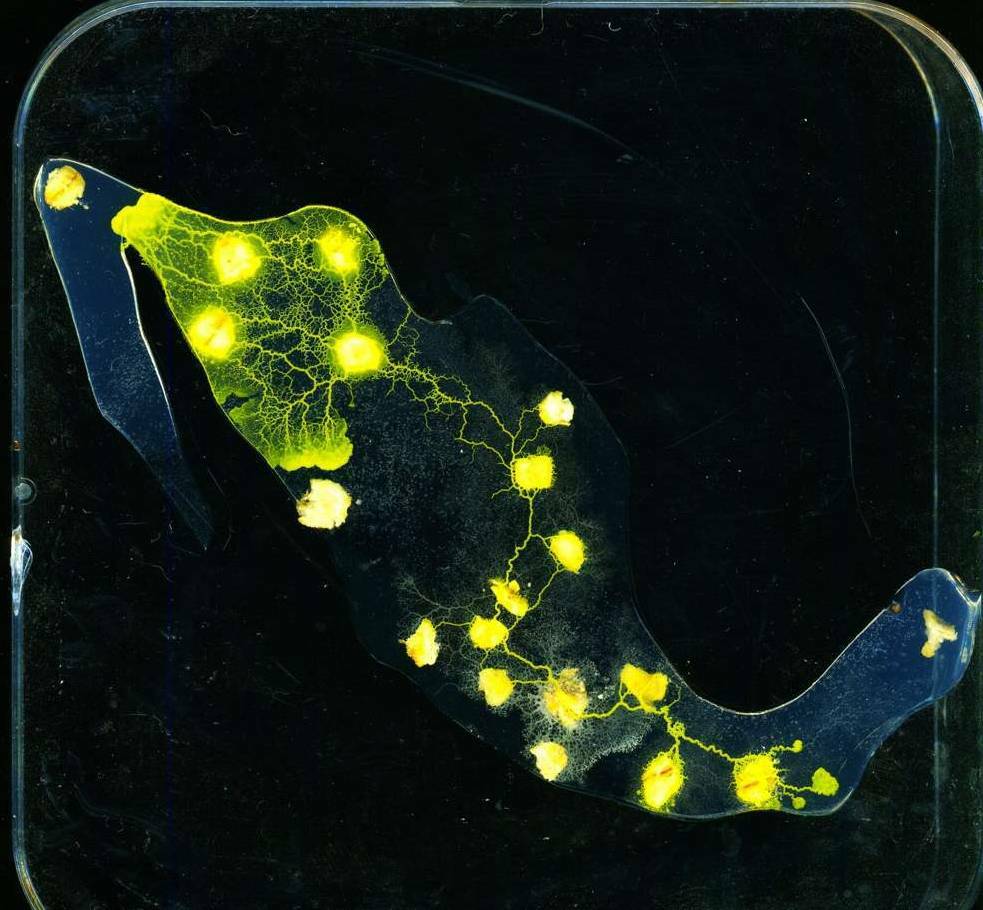
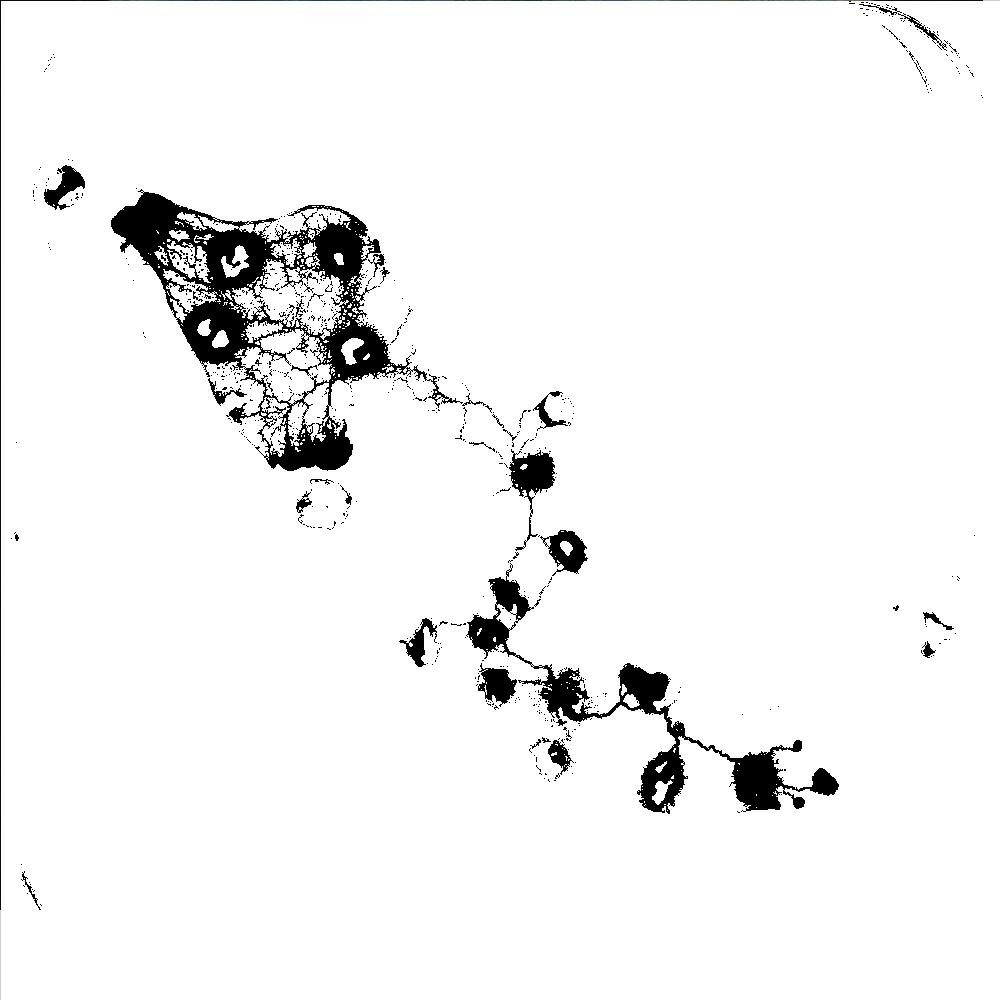
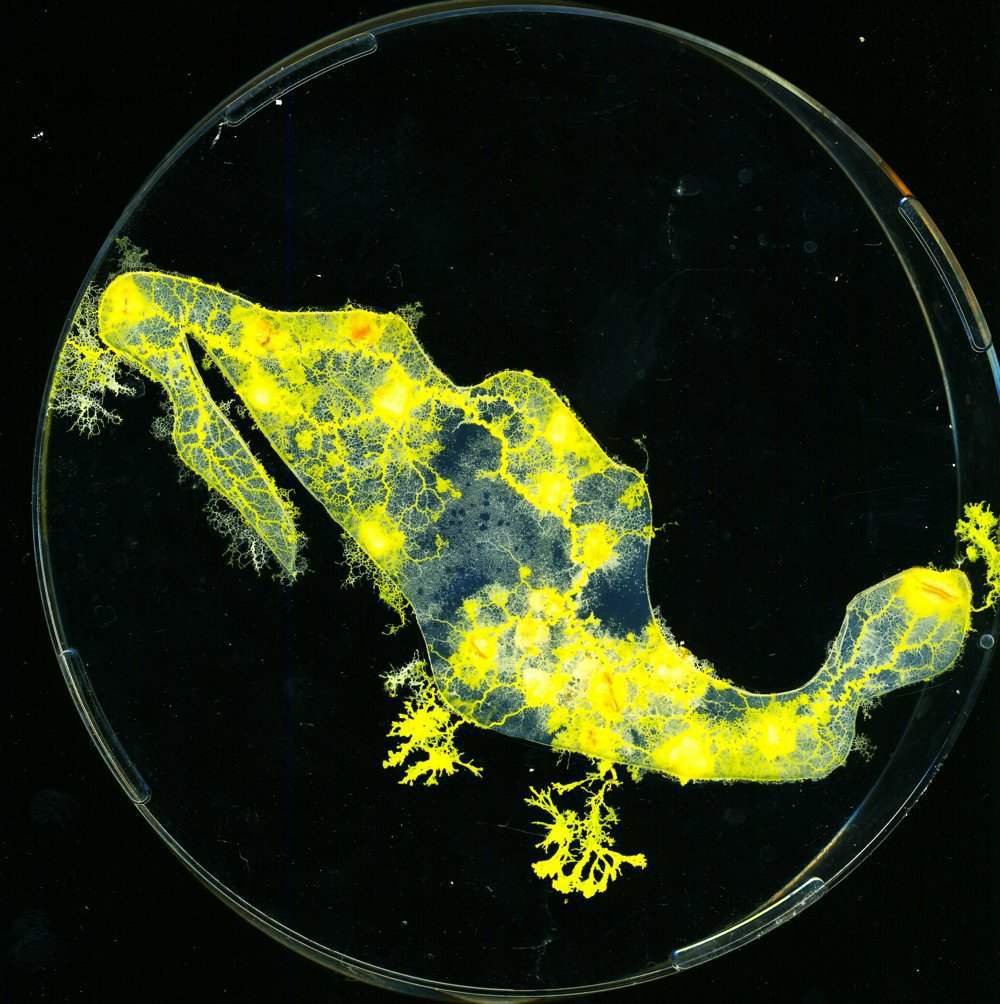
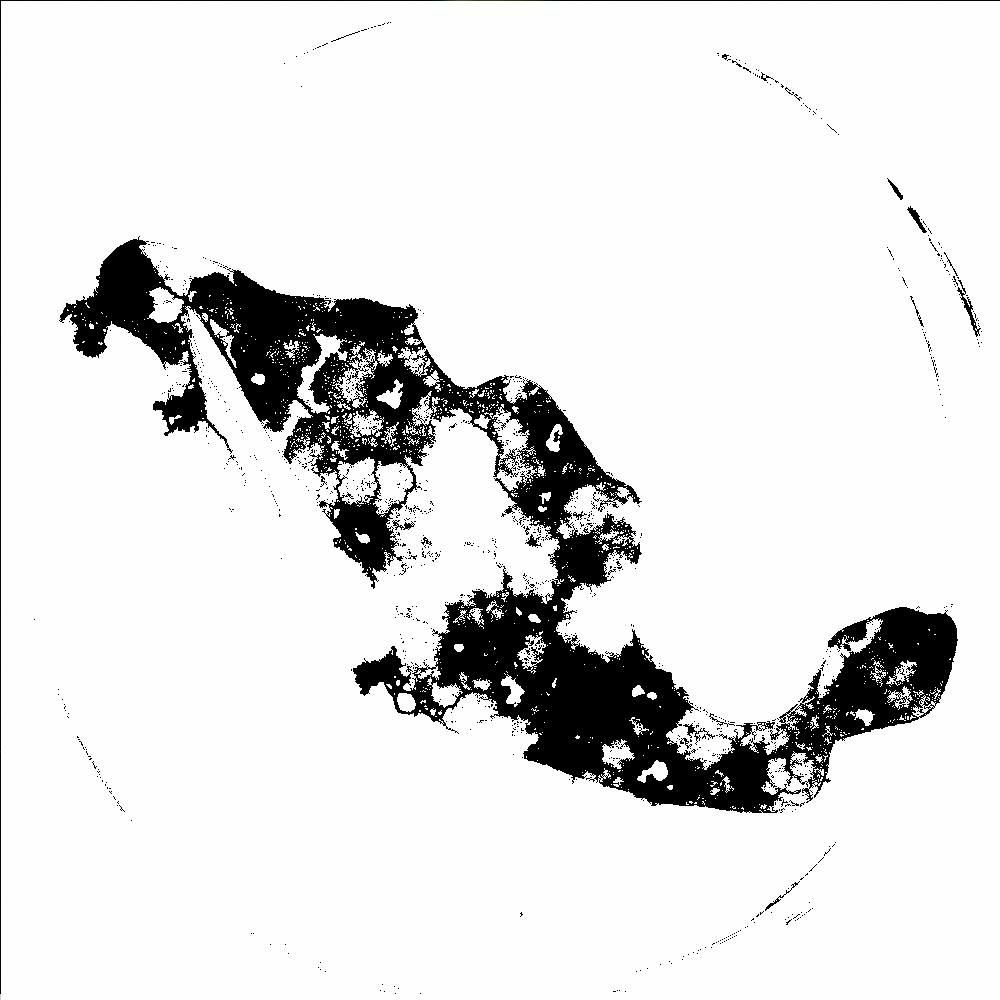
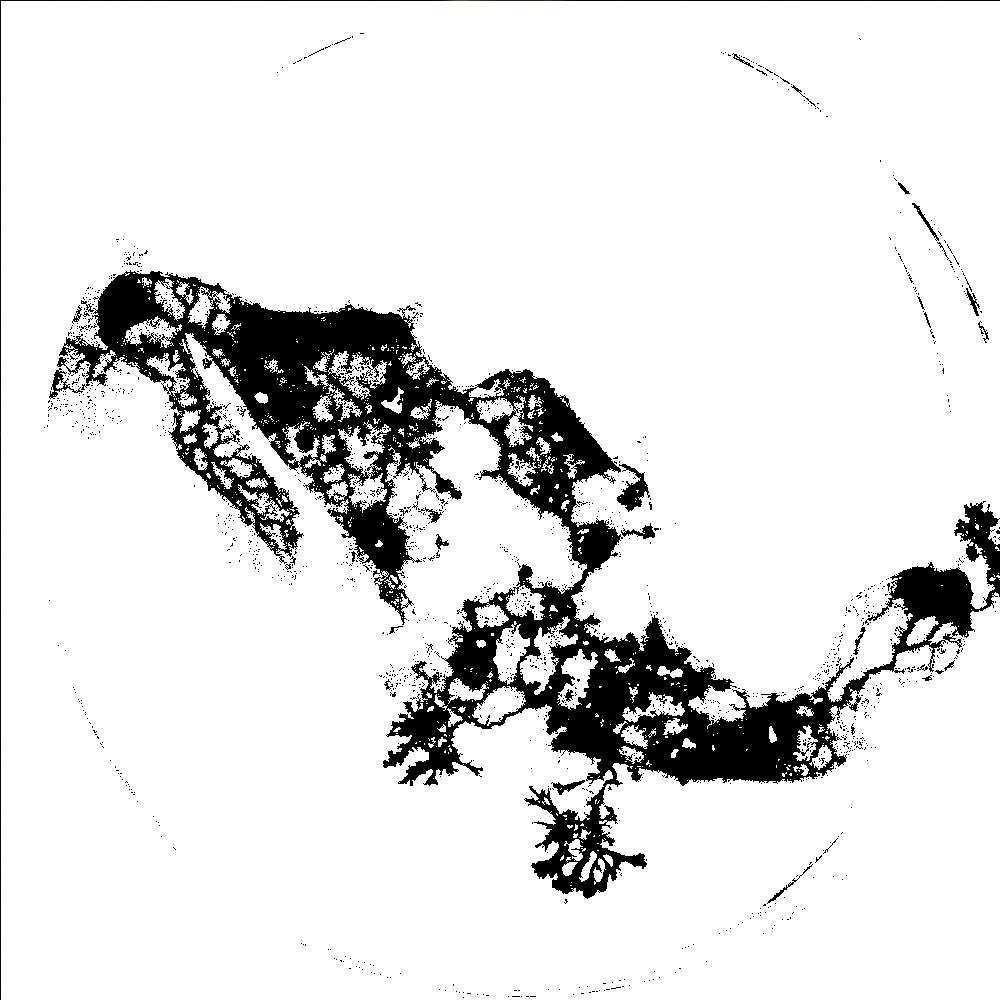
Typical plasmodium development: (a)–(e) scanned image of experimental Petri dish. Time elapsed from inoculation is shown in the sub-figure captions. (f)–(j) binarized images, .
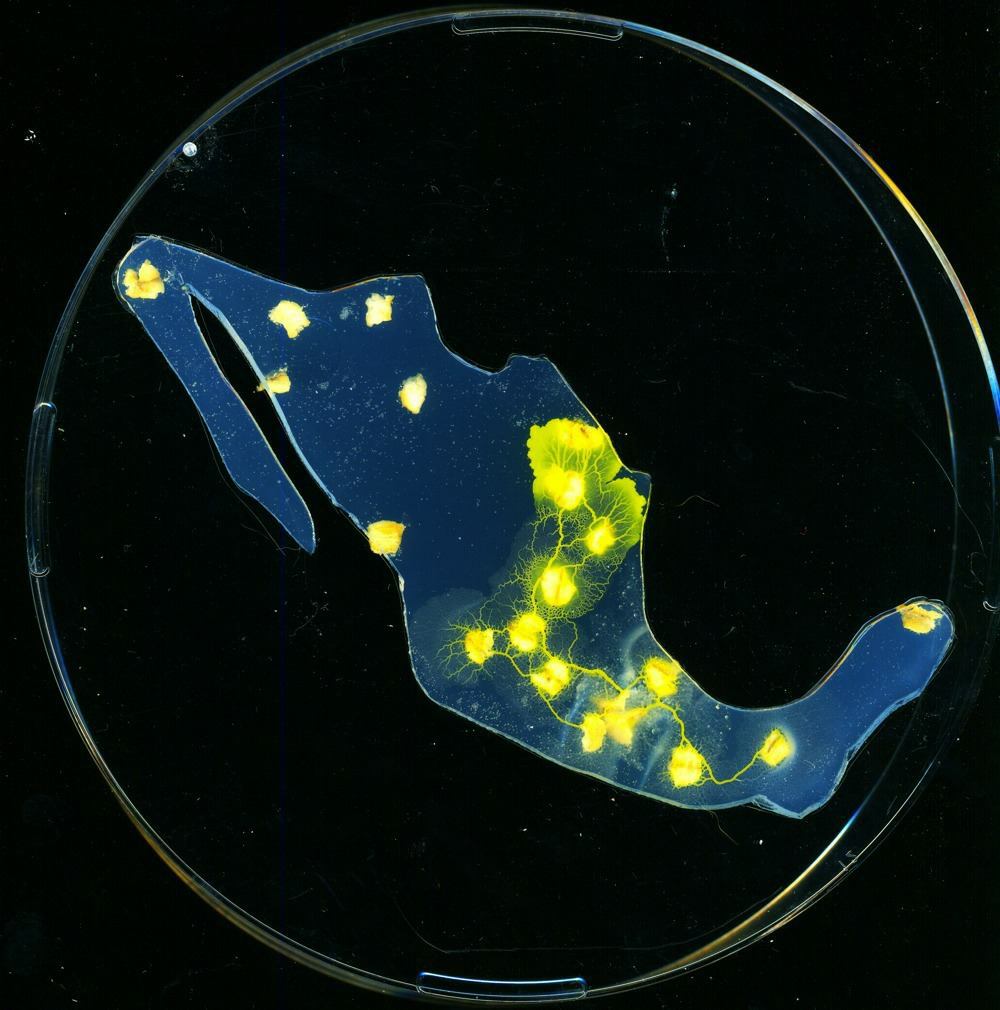
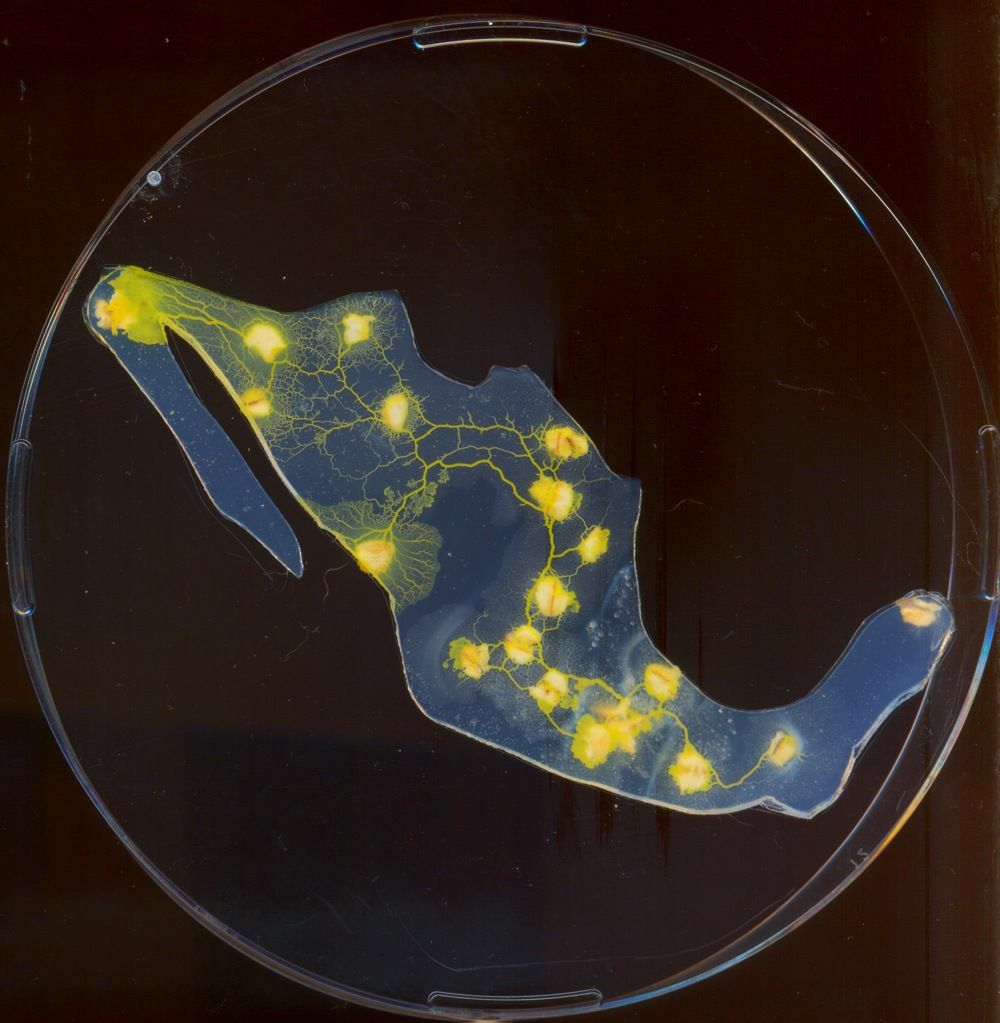
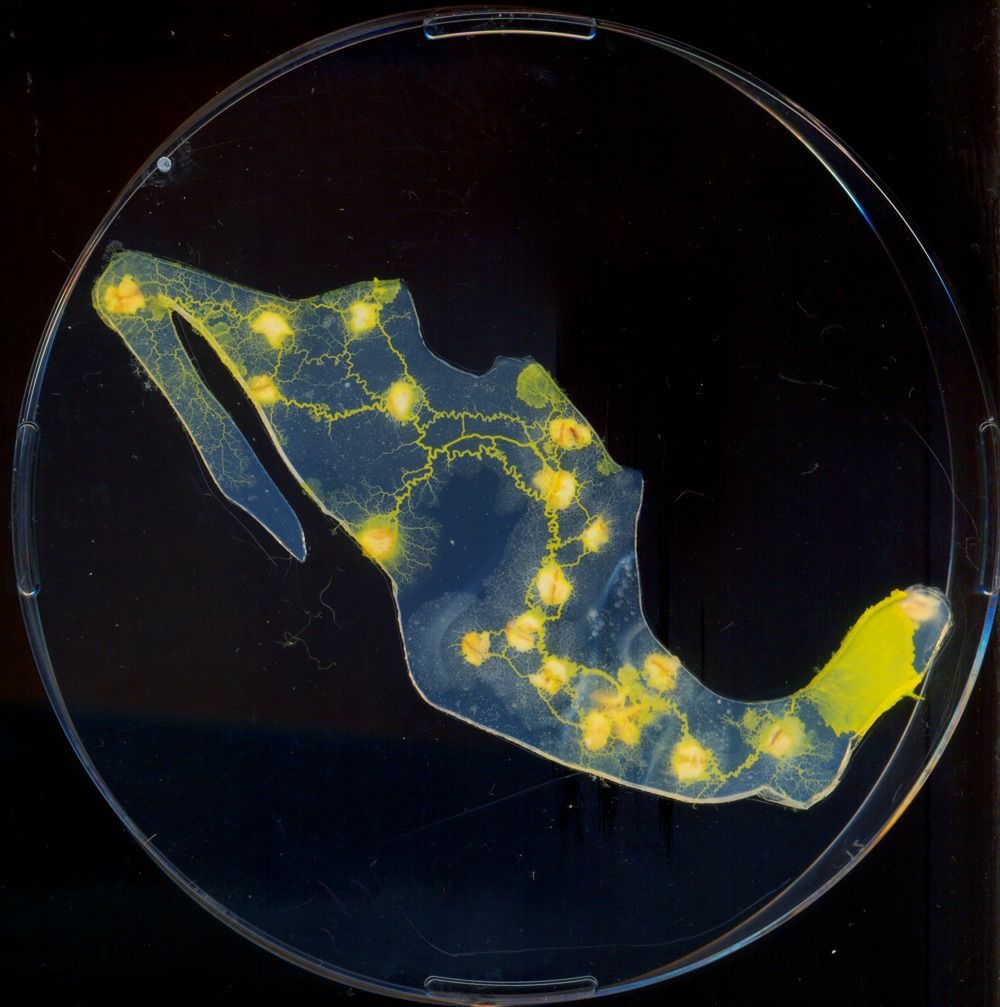
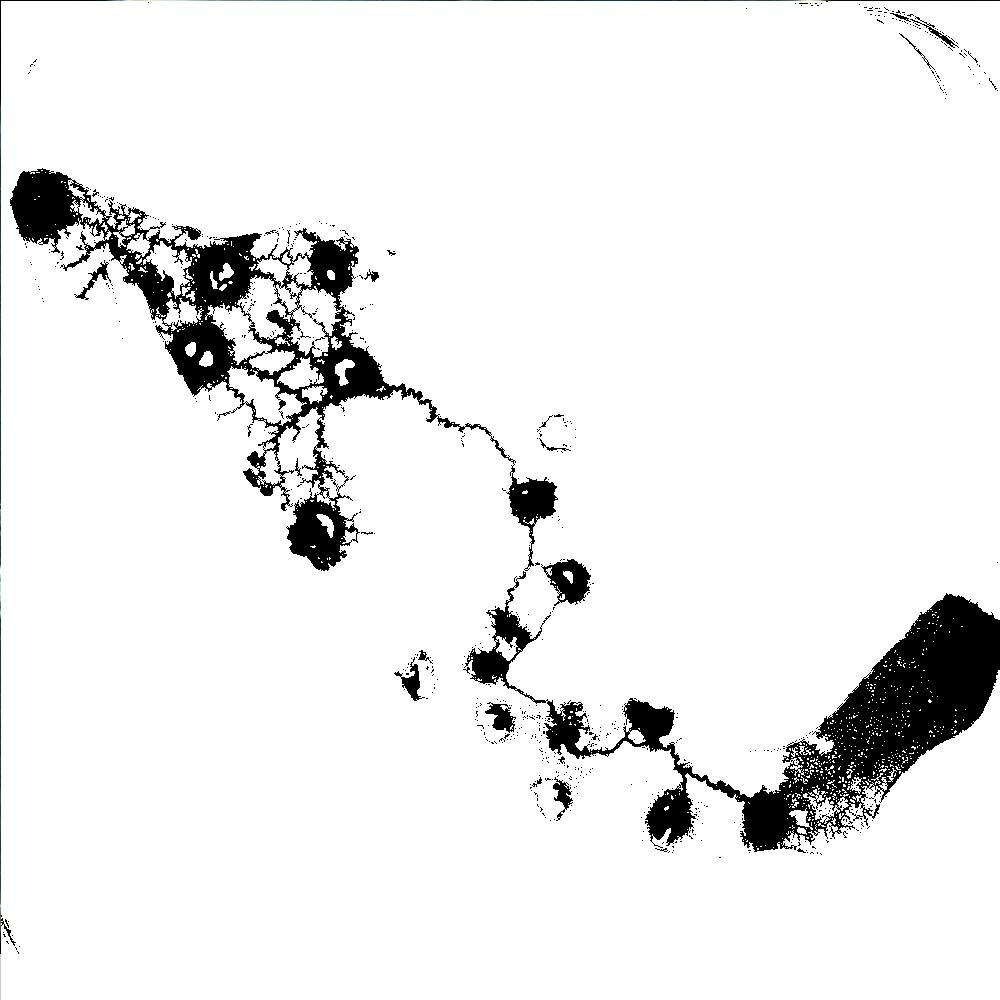
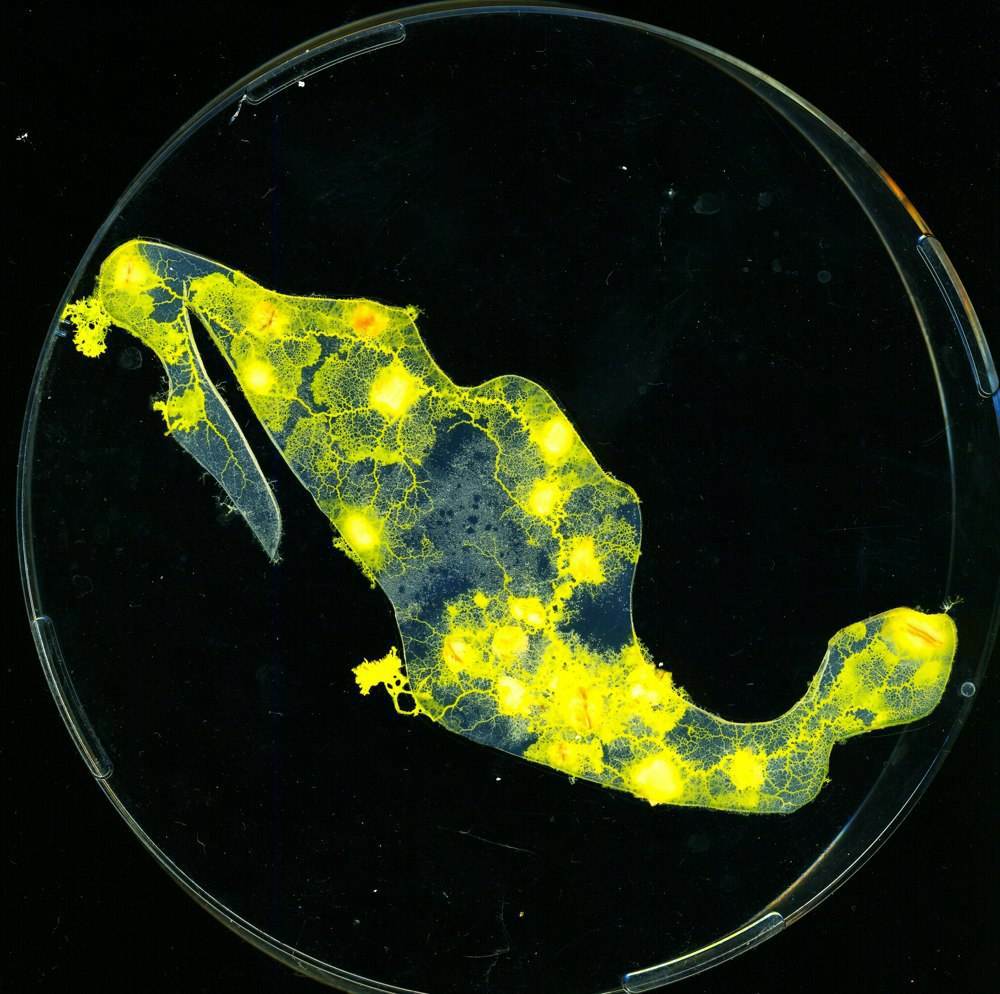
Snapshots of plasmodium foraging patterns during typical experiment are shown in Fig. 3. Initially a piece of plasmodium is placed onto an oat flake representing Mexico City. The plasmodium grows and propagates in south-easterly direction occupying Oaxaca-Huatulco region and then traveling towards Tuxtla Gutiérrez region (Fig. 3af). The plasmodium reaches Tuxtla Gutiérrez region usually in 12 hours after inoculation (real time distance is 11 hours). At the same time the plasmodium colonizes Xalapa-Veracruz and Chilpancingo-Acapulco regions and moves north-north-west. In a normal situation (vigorous plasmodium, fresh agar gel, air not contaminated by bacteria), south-east and north-north-west developments occurs simultaneously. In 12-14 hours after inoculation the plasmodium can reach as far as Monterrey and Nuevo Laredo regions (Fig. 3bg). The plasmodium colonizes almost the whole Mexico in 38 hours, spanning major urban region from Tijuana in the north-west to Tuxtla Gutiérrez in the south-east (Fig. 3ch). The colonization is truly completed in 52 hours, when an oat flake representing Merida-Cancún is covered by plasmodium mass (Fig. 3di). Despite spanning all cities marked by oat flakes the plasmodium continues exploring the territory outlined by agar gel and propagates along Baja California Peninsula (Fig. 3ej). There are no cities represented by food sources, therefore the plasmodium retreats from the Peninsula.
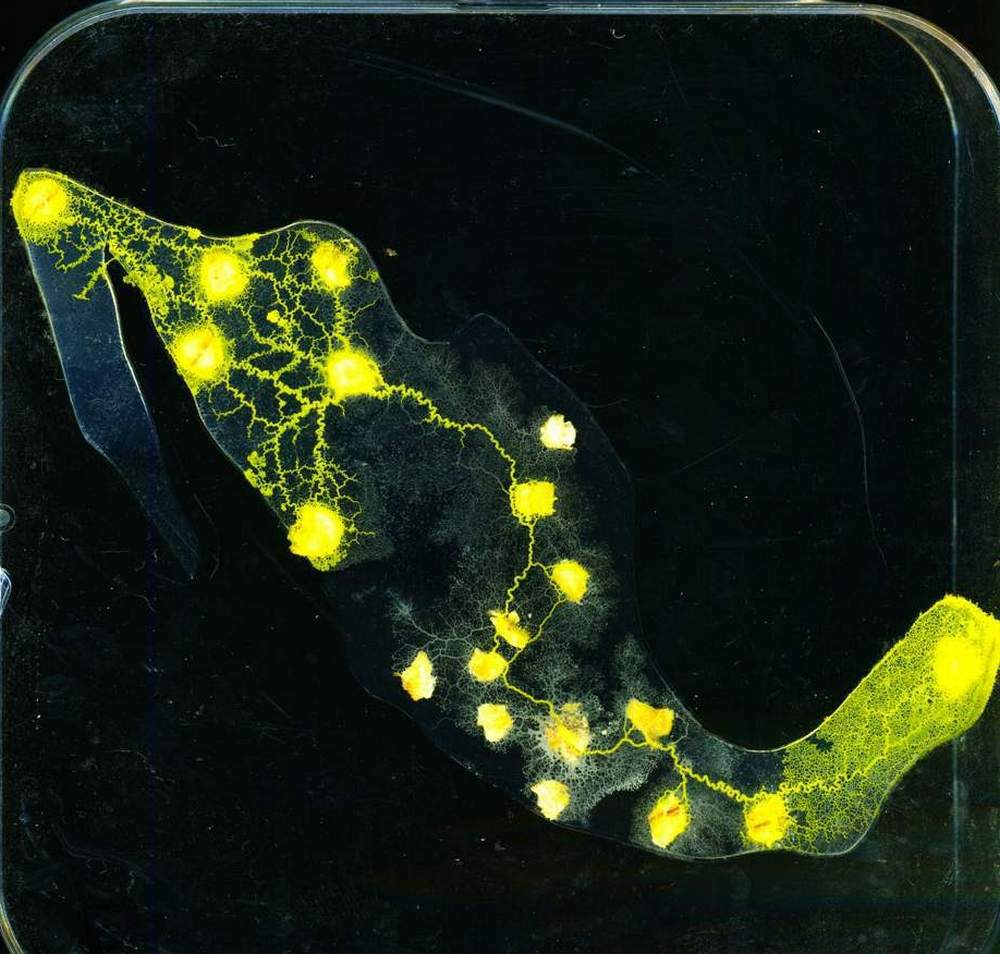
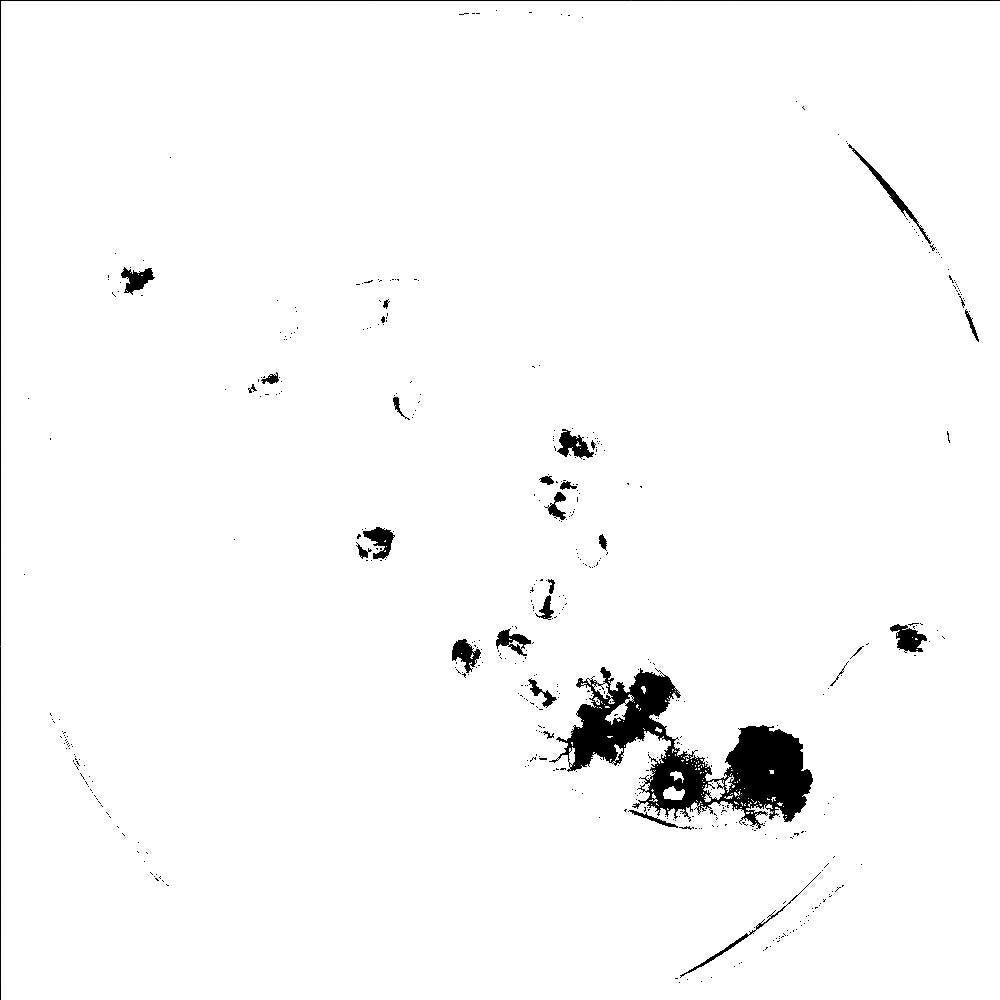
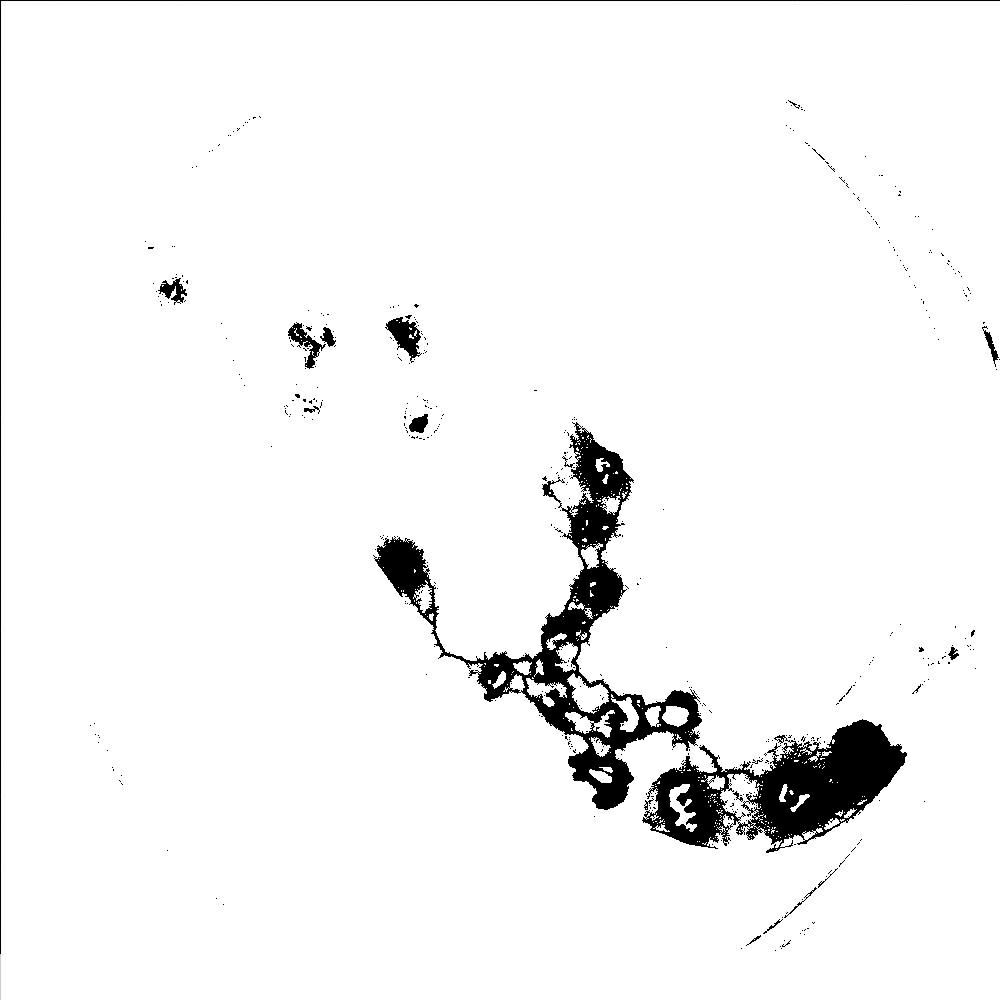
Plasmodium does not always span all cities (sources of food): (a)–(d) scanned image of experimental Petri dish. Time elapsed from inoculation is shown in the sub-figure captions. (e)–(h) binarized images, .
In some situations the plasmodium does not span all cities, represented by oat flakes. An example is shown in (Fig. 4). In few hours after being inoculated in Mexico city the plasmodium propagates in all directions. In 12 hours the plasmodium reaches Ciudad Victoria region on the north, and Xalapa-Veracruz on the south (Fig. 4ae). On 24th hour of development the plasmodium expands its occupation till Nuevo Laredo region on the north and Tuxtla Gutiérrez on the south (Fig. 4bf). The plasmodium continues then to Chihuahua and Merida-Cancún regions (Fig. 4cg) and abandons the oat flake, representing Nuevo Laredo region. Even when the whole territory of Mexico becomes colonized by plasmodium the Nuevo Laredo regions remains free (Fig. 4dh).
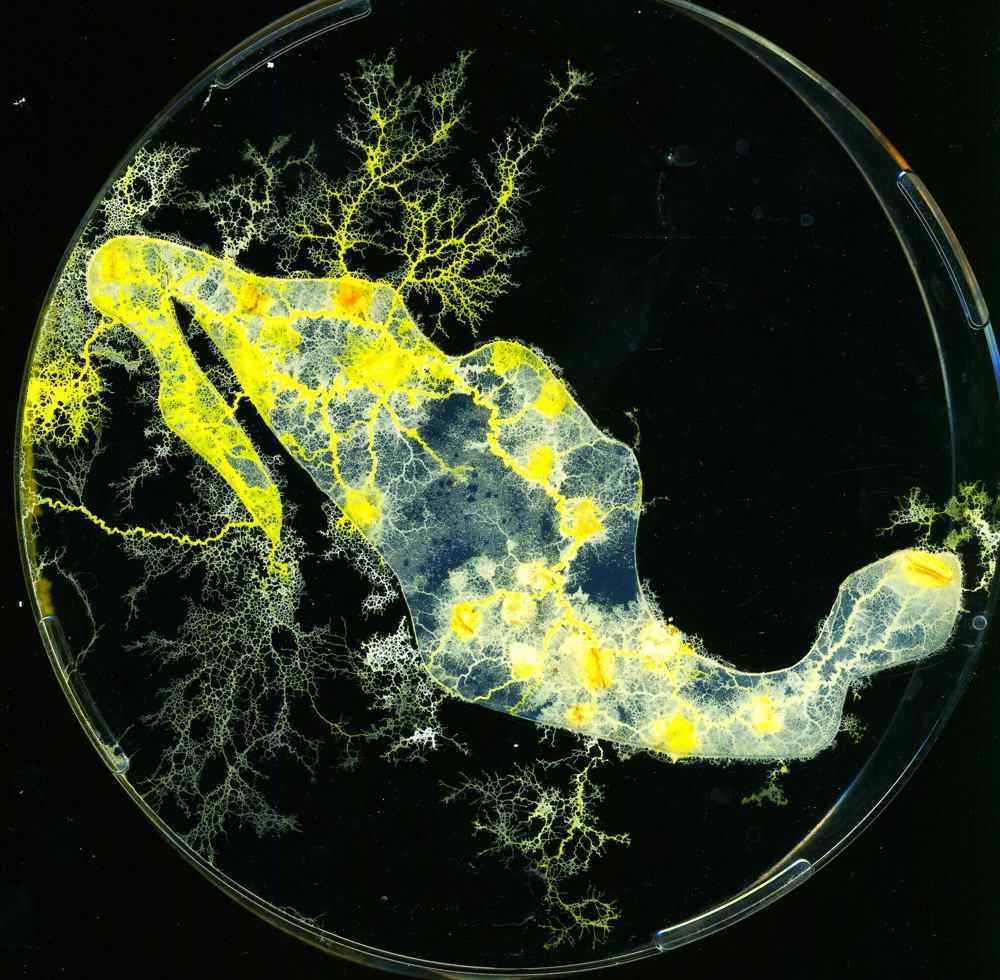
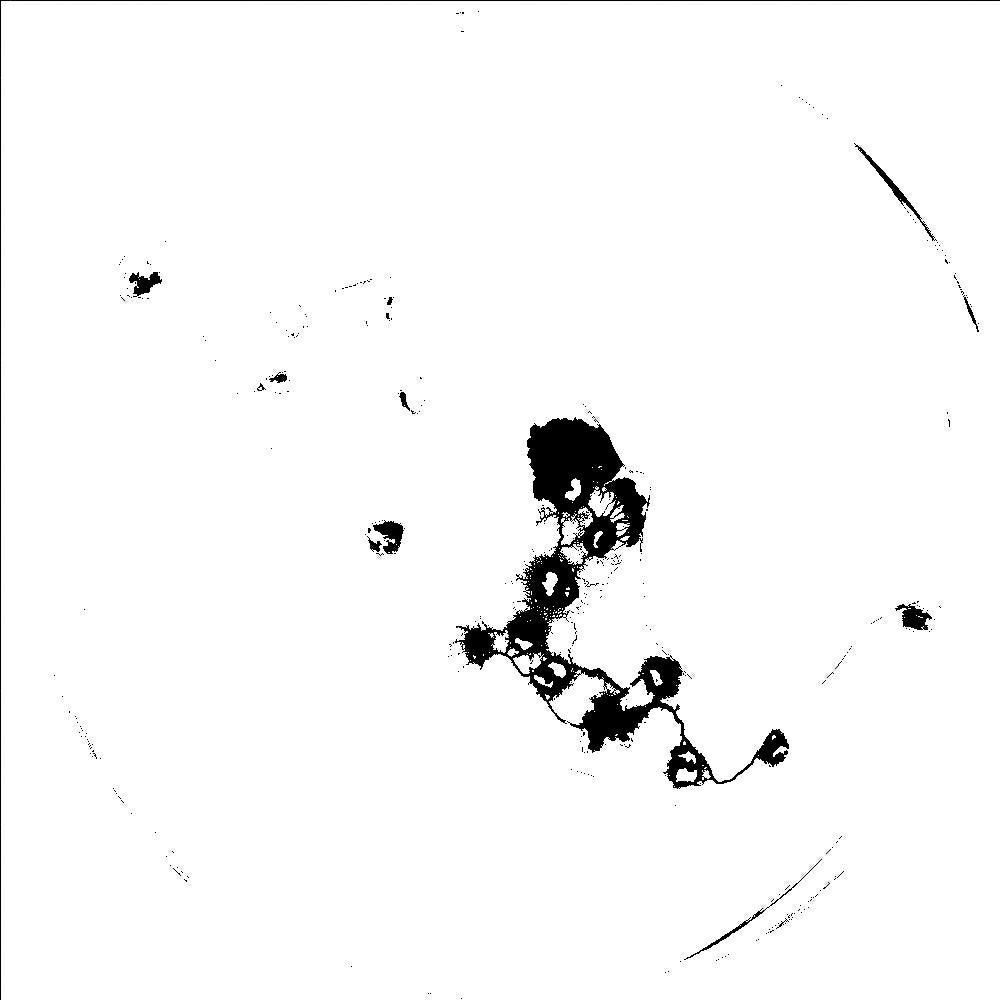
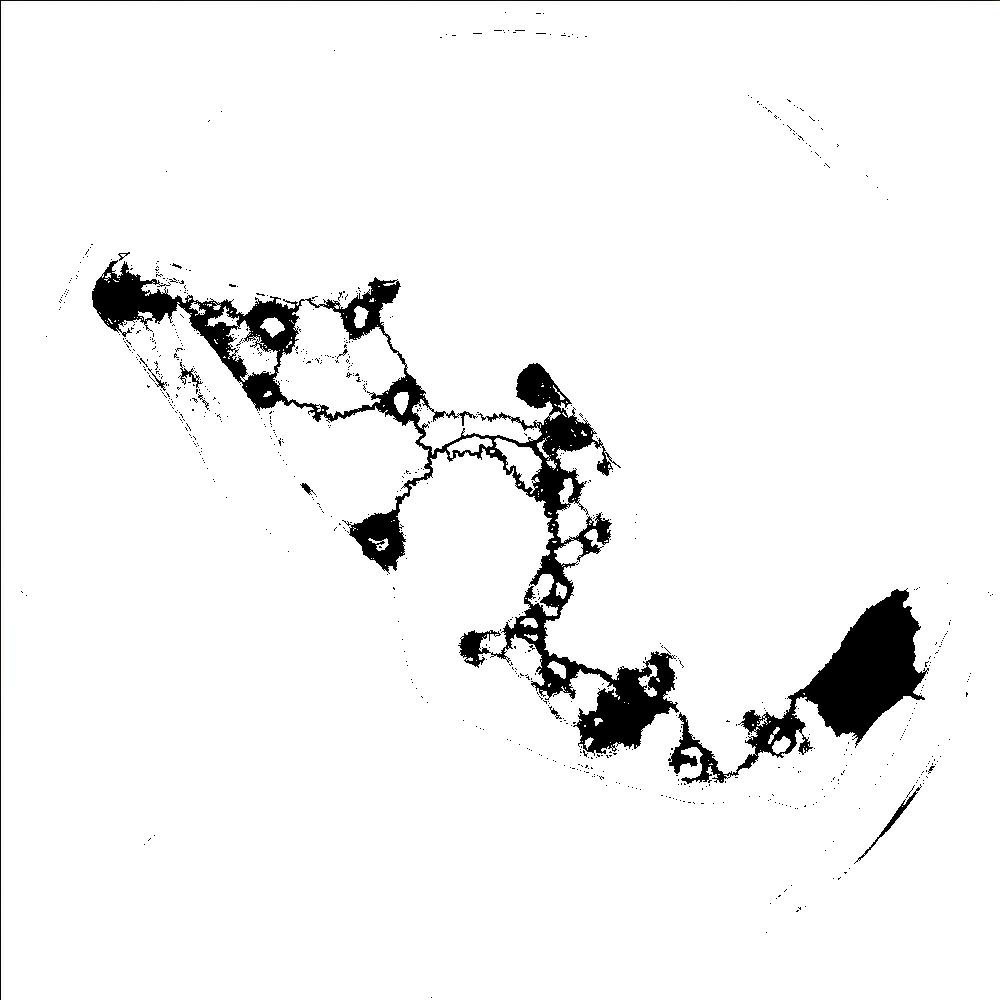
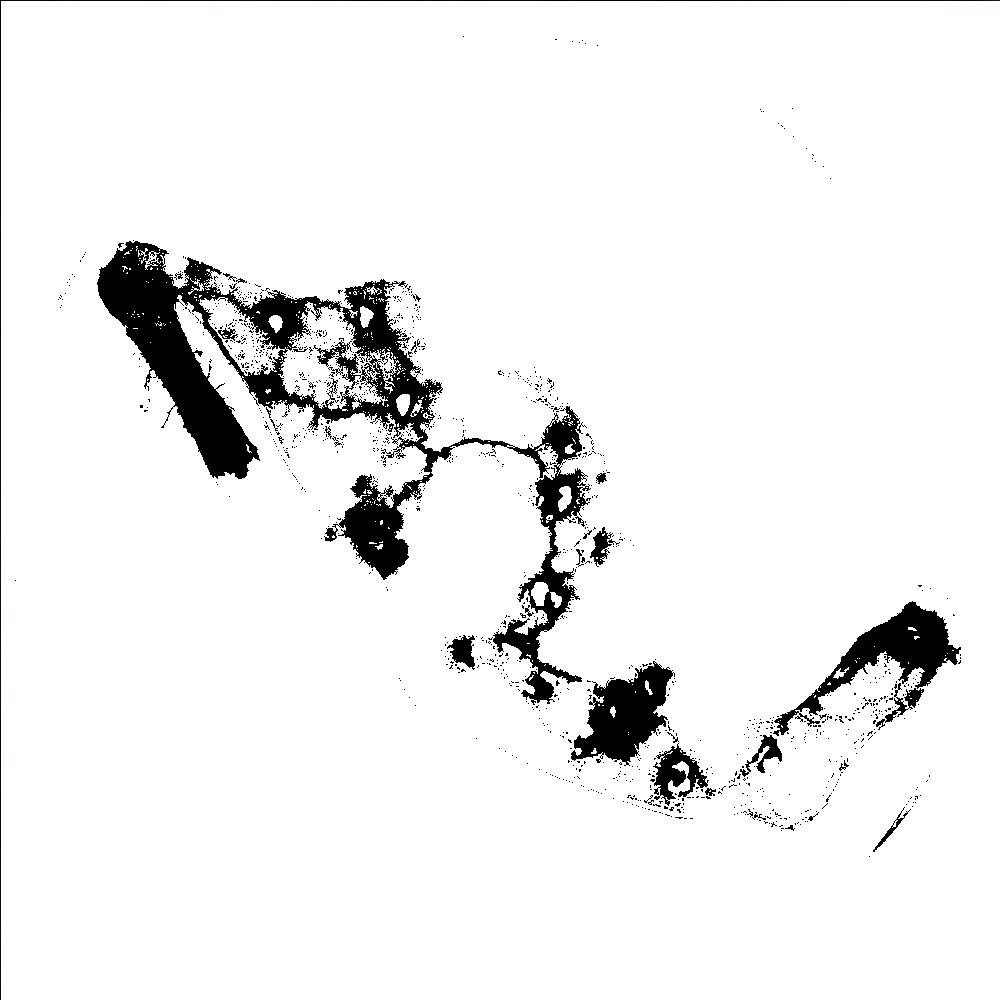
Plasmodium spreads beyond ‘dedicated’ experimental domain: (a)–(d) scanned image of experimental Petri dish. Time elapsed from inoculation is shown in the sub-figure captions. (e)–(h) binarized images, .
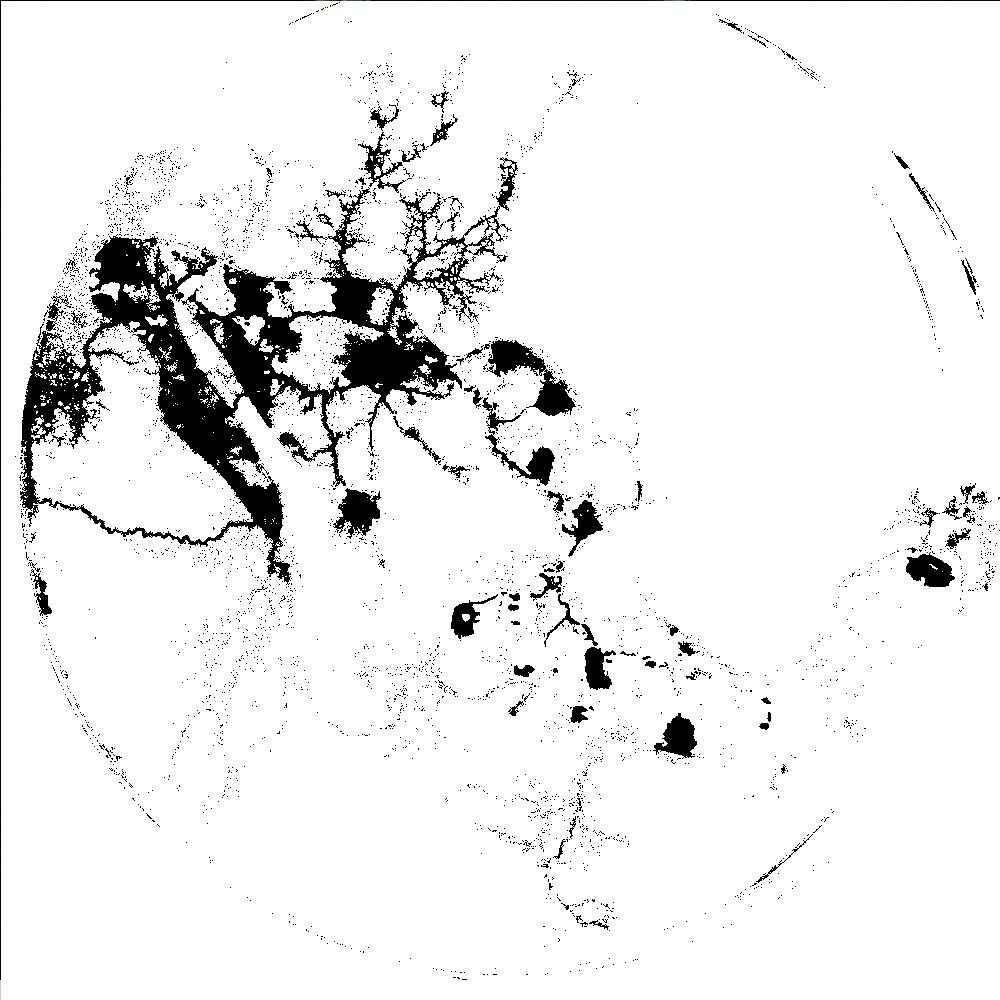
The plasmodium may not stop its foraging activity even when all sources of nutrients are occupied and the whole agar plate is explored. As illustrated in Fig. 5 a vigorous plasmodium can spread over surrounding Petri dishes, trying to settle on a bare plastic. Plasmodium parts residing on a non-agar substrate suffer from the lack of humidity and therefore cease to sustain. Abandoned protoplasmic tubes are clearly visible in southern half of Petri dish in Fig. 5dh.
As illustrated in Figs. 3,4 and 5 plasmodium rarely develops exactly the same foraging pattern twice. Even in any given experiment the plasmodium sometime may change topology of its protoplasmic networks, abandon and re-colonize sources of food. Thus we could not ever consider a stationary configuration of a protoplasmic network but a probabilistic graph, representing all possible configuration of protoplasmic networks occurring in experiments for a given configuration of sources of nutrients. We define a probabilistic Physarum graph in the following manner.
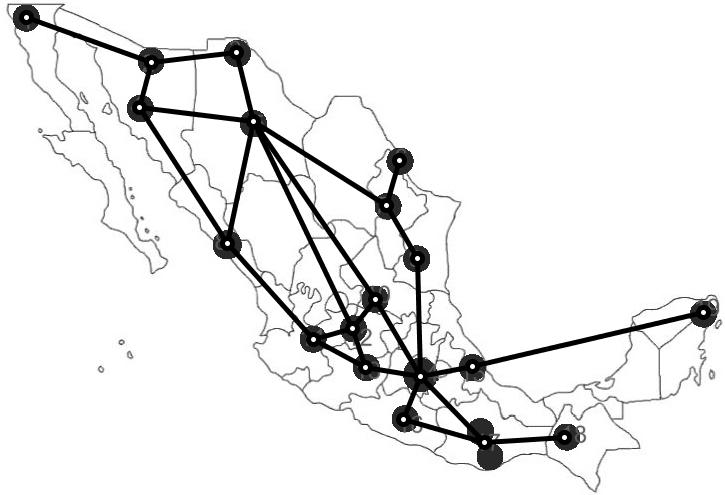
Physarum graph is a tuple , where is a set of nineteen urban areas, is a set edges, and is a probability-weights of edges from . For every two regions and from there is an edge connected and if a plasmodium’s protoplasmic link is recorded at least in one of experiments, and the edge has a probability calculated as a ratio of experiments where protoplasmic link occurred to the total number of experiments . We do not take into account exact configuration of the protoplasmic tubes but merely their existence. We also consider threshold Physarum graphs , defined as follows: for if .
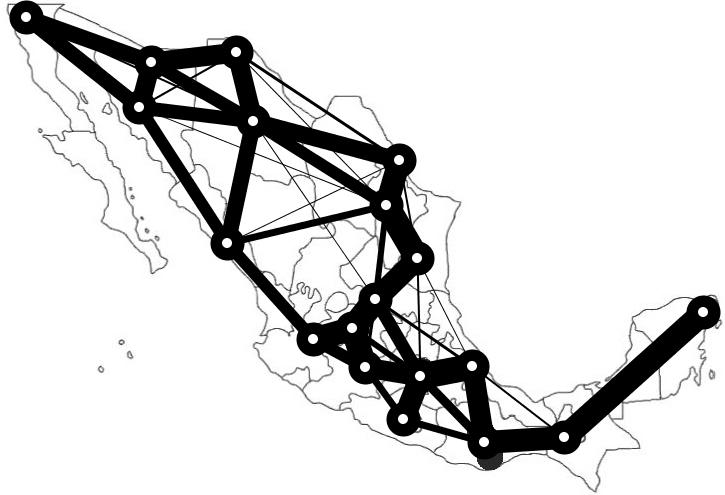
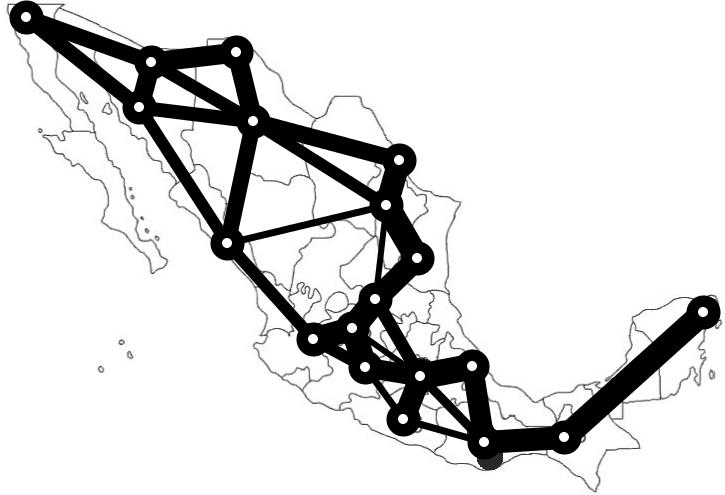
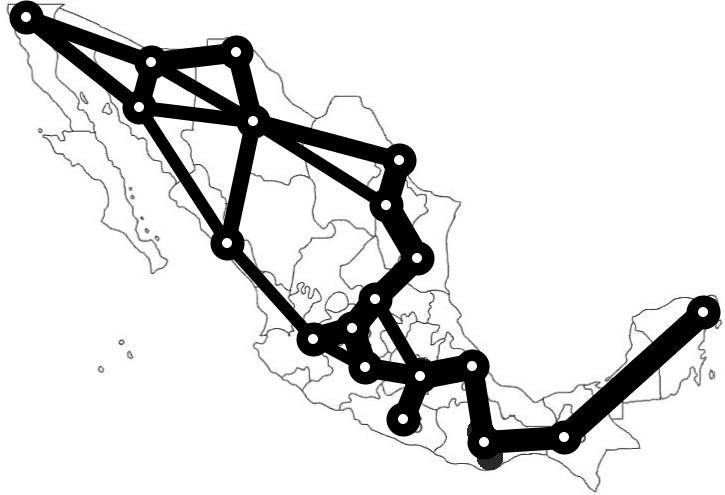
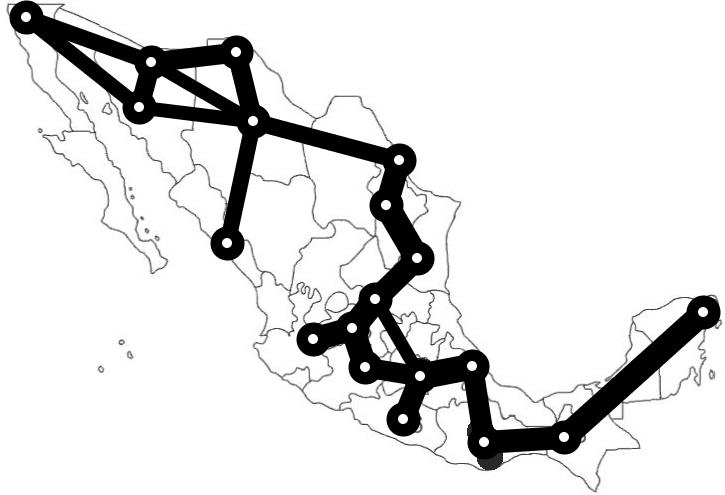
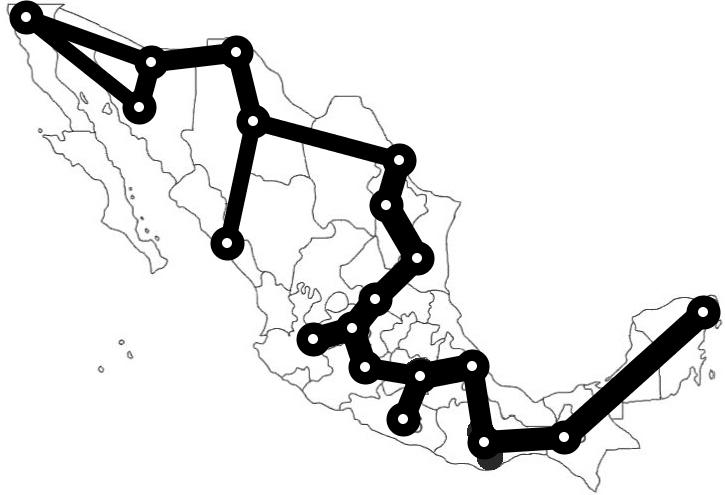
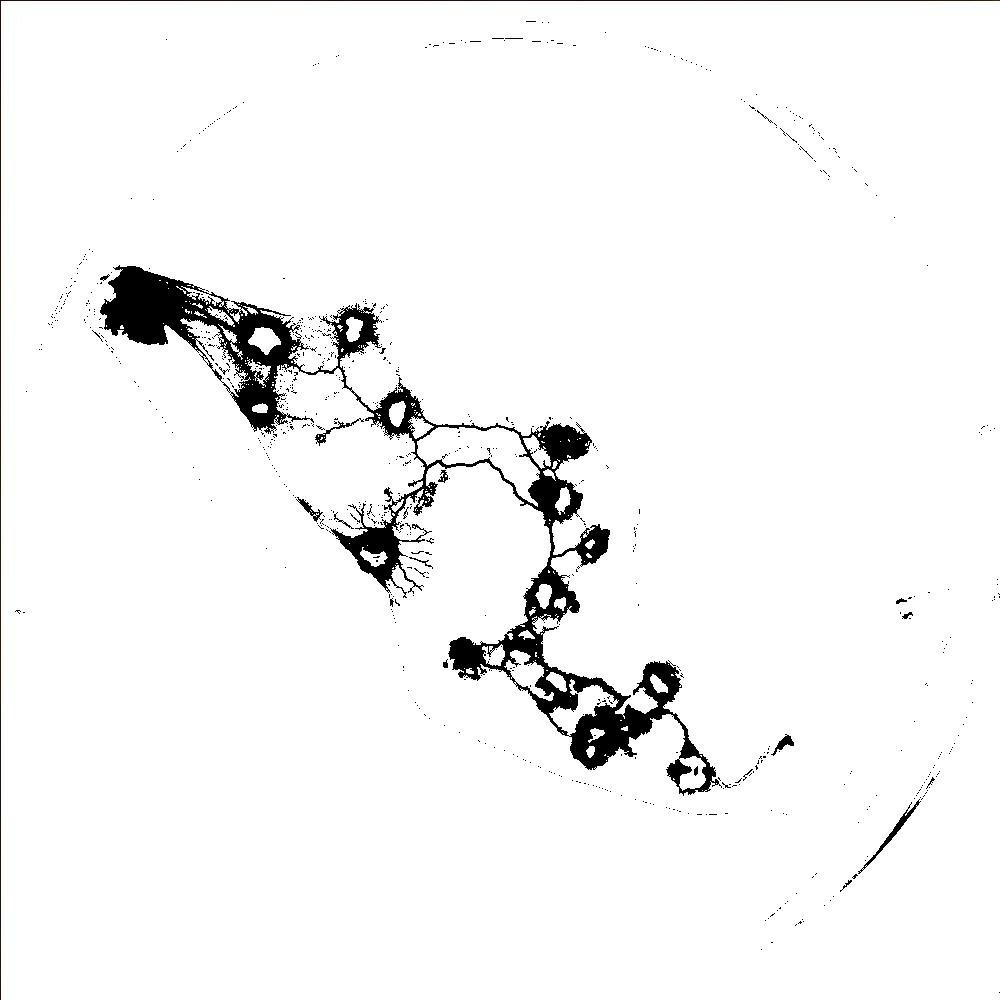
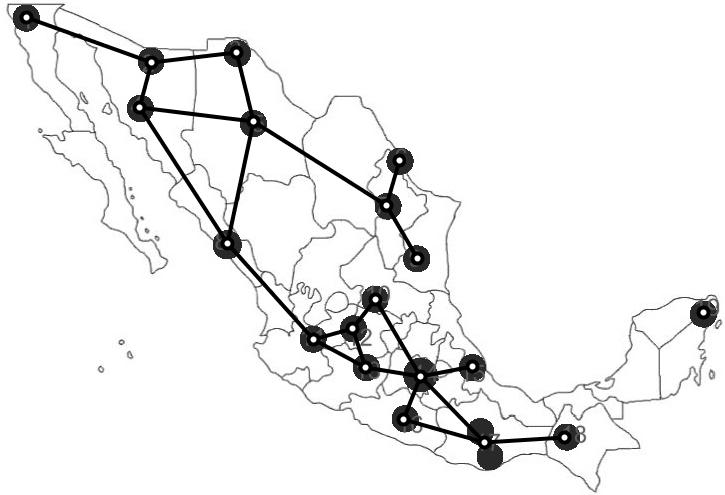
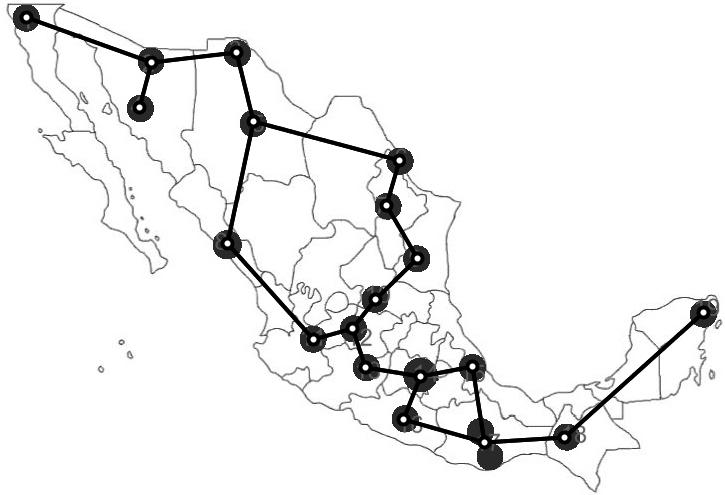
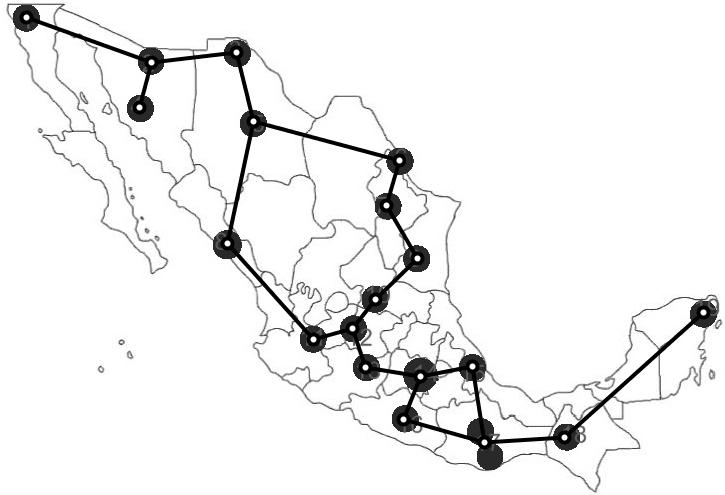
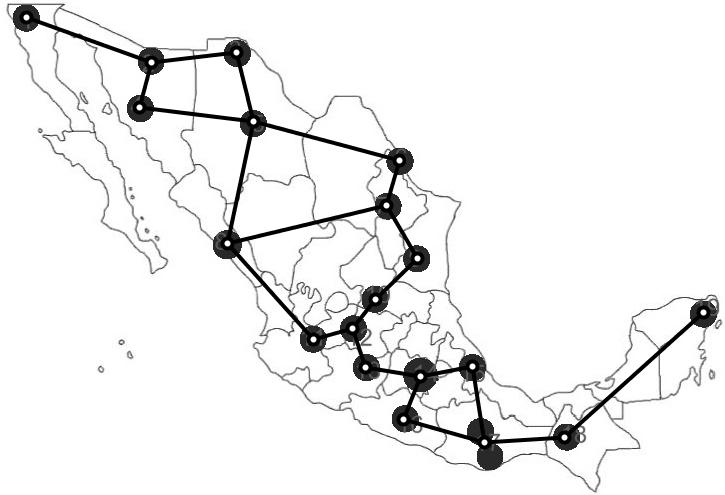
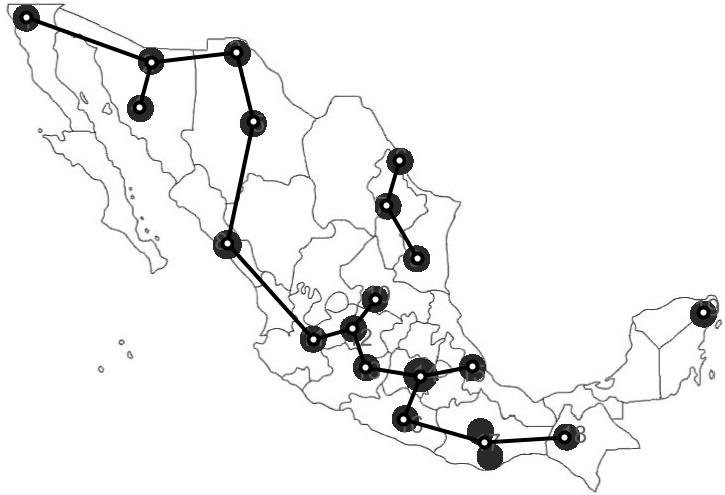
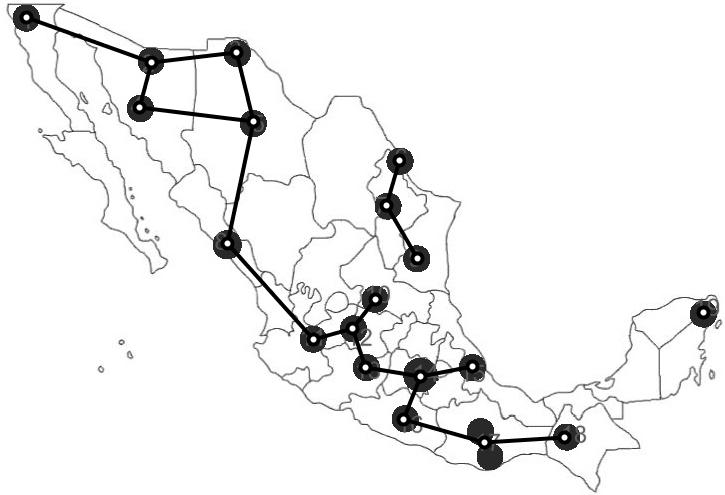
Physarum-graphs extracted from 26 laboratory experiments are shown in Fig. 6. The graph becomes planar when we remove edges with weights below 0.19 (Fig. 6b). The graphs is acyclic, or a tree, when only edges with probability-weights exceeding 0.58 are taken into consideration (Fig. 6d). Thus edges of the spanning tree are represented by protoplasmic tubes in over half of experimental trials.
Finding 1
Spanning tree is a stable core structure of Physarum foraging and nutrient transport network built on a configuration of urban regions .
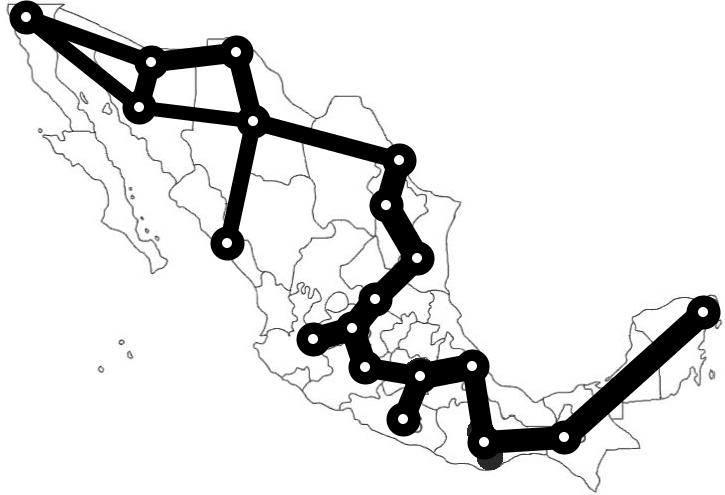
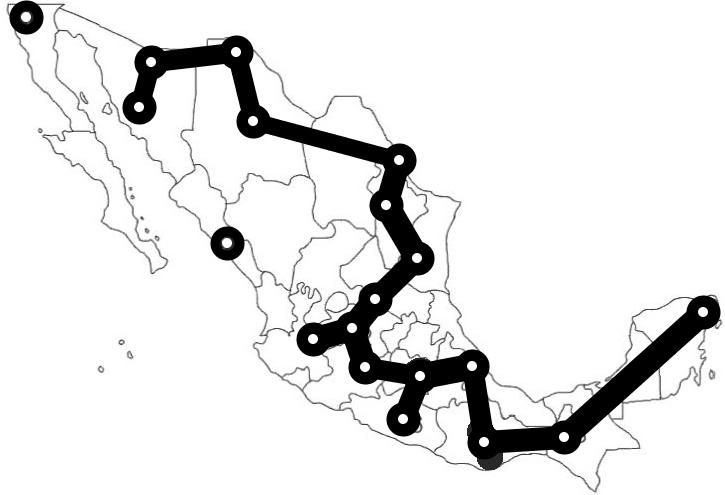
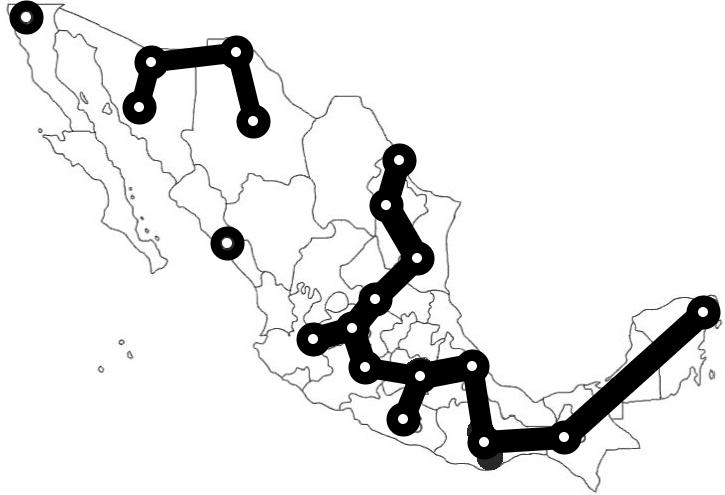
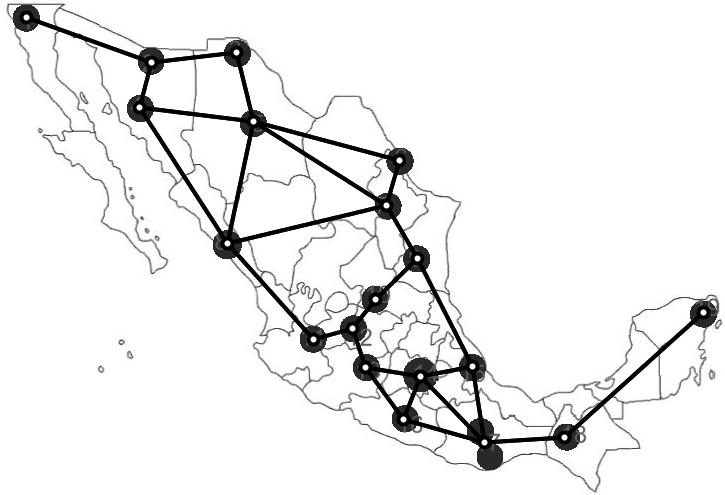
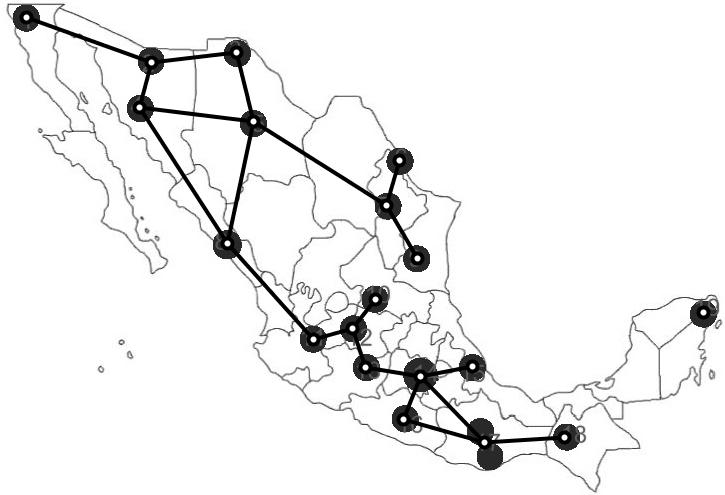
If we increase threshold value to 0.61 the Physarum transport graph becomes disconnected (Fig. 7a). The nodes corresponding to Tijuana and Mazatlán regions becomes isolated. There is no a direct highway between such cities, mainly with main big highways as M15 or M2 and this isolation of course, represents geographical limitations.
The graph is split into two connected components when (Fig. 7b). Superior component reflects directly the highway dominating north-west of Mexico that is M2 crossing from Tijuana to Ciudad Juárez. The component also represents the fact that Indeed M2 does not reach east coast, that reflect precisely this component. Second component display a strong connection between Mexico city and south-east of Mexico. Such relation involves a high-through connection region of north-east with Mexico city, and Mexico city with south-east, they are connected specifically by motorway M85 from Nuevo Laredo to Mexico city and M180 that run from Xalapa-Veracruz to Cancún.
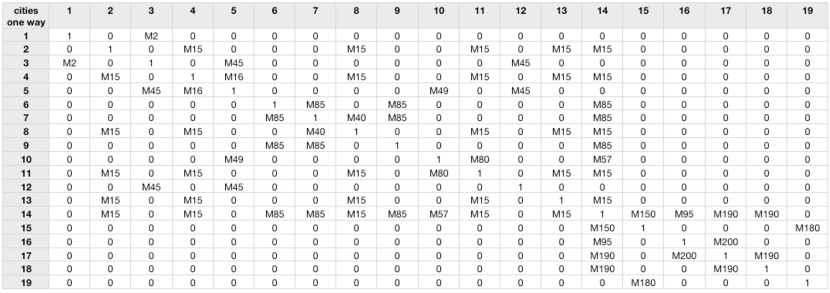
A specific relation of connections by standard highways (not rural ways) is given in the table 8 given from the last update from “Guía Roji” publications.555Source: Guía Roji “Por las Carreteras de México 2011”, 17a. Edition. Web site: http://www.guiaroji.com.mx
Finding 2
Transport links to Tijuana and Mazatlán urban regions are unstable.
As we saw some implication in Finding 1 (first component), and table in Fig. 8 connectivity. We will need at least two or three highways to reach Mazatlán from Tijuana. Here there is not a direct motorway as could be M15. Although there is a number of connections to travel between both cities.
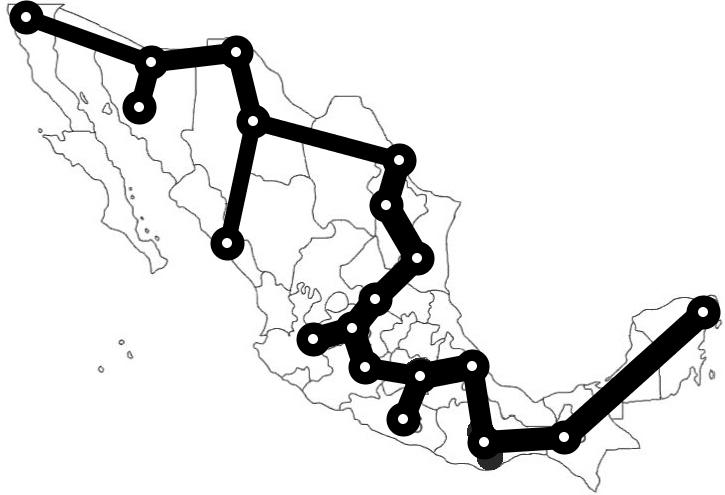
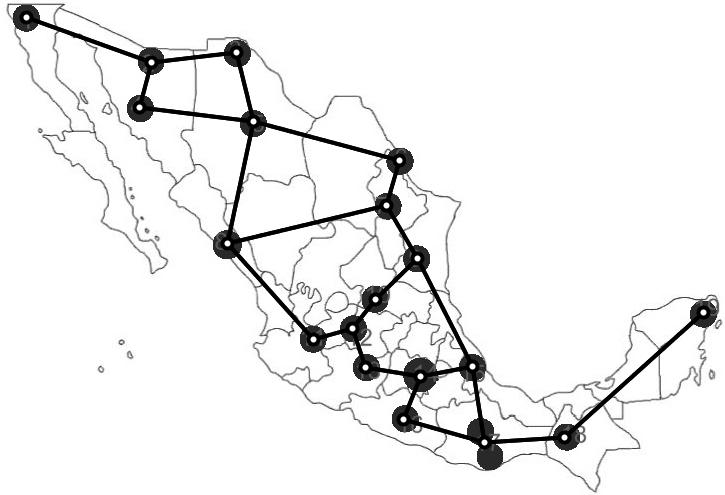
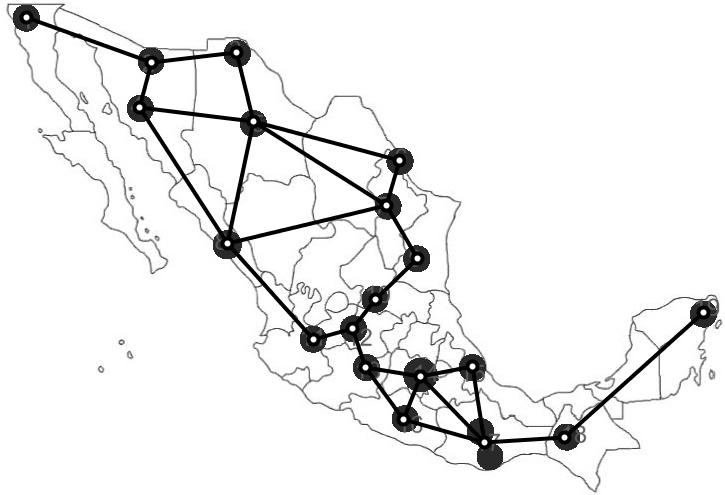
On the way, how well Physarum graphs approximate Mexican highway network. A sketch of the highway network and the graph derived are shown in Fig. 9. We construct the highway graph as follows. Let be a set of nineteen urban regions, for any two regions and from , the nodes and are connected by an edge if there is a highway starting in vicinity of and passing in vicinity of and not passing in vicinity of any other urban area .
Finding 3
Graph is a sub-graph of apart of three edges.
Intersection of Physarum and highway graphs is shown in Fig. 9c. The three edges of missing in are transport links connecting Chihuahua and Nuevo Laredo regions, Xalapa-Veracruz and Oaxaca-Huatulco regions, and Tuxtla Gutiérrez and Merida-Cancún regions. Such difference could possibly be explained by the fact that in laboratory experiments we did not represent geographical landscape in agar gel structure but just a uniform gel plate was cut in a shape of Mexico.
Indeed, we have considered natural restrictions. Missing connections between Chihuahua and Nuevo Laredo are limited by Chihuahua desert. While connection between Xalapa-Veracruz and Oaxaca-Huatulco mainly is limited by geographical features such as Juárez mountain range. So missing connection between Tuxtla Gutiérrez and Merida-Cancún implies a large border over Golf of Mexico upping to motorway M180 and crossing also on Chiapas mountain range.
4 Physarum, proximity graphs and highways

Physarum constructs planar proximity graphs by its protoplasmic network [6]. A planar graph consists of nodes which are points of Euclidean plane and edges which are straight segments connecting the points. A planar proximity graph is a planar graph where two points are connected by an edge if they are close in some sense. Usually a pair of points is assigned certain neighborhood, and points of the pair are connected by an edge if their neighborhood is empty. Relative neighborhood graph [14], Gabriel graph [24], -skeletons [17] and spanning tree are most known examples of proximity graphs.
Relative neighborhood graph [35] (Fig. 10a) and Gabriel graph [13, 24] (Fig. 10b) are computed over nodes corresponding to urban areas . Points and are connected by an edge in if no other point is closer to and than [35]. Points and are connected by edge in if a disc with diameter centered in middle of the segment is empty [13, 24]. The graphs are related as [35, 24, 14].
Proximity graphs found their applications in many fields of science and engineering. The application domains related to topics of the paper include routing in ad hoc wireless networks [18, 32, 29, 25, 38], road network analysis [39, 40], study percolation [11] and analysis of magnetic field [33]. Structure of proximity graphs represents so wide range of natural and engineering system that it would be productive to compare Physarum graph and highway graph to relative neighborhood graph , -skeleton (1.5) (-skeleton was calculated for to make an ‘intermediate’ graph between and ), Gabriel graph and minimum spanning tree (Fig. 11). From now on we mean when writing .

Finding 4
This is a direct outcome of calculating intersections of the graphs (Fig. 11). Relative neighborhood graph is considered to be optimal in terms of total edge length and travel distance, and is a closest approximation of road networks [39, 40]. The fact this graph is a sub-graph of Physarum graph indicates deep intrinsic analogies between formation of man-made and plasmodium transport networks.
In all cases (Fig. 11a–d) the large pathway between Mexico city and USA is preserved in three following ways. Mexico city via Ciudad Juárez by motorway M45, Mexico city via Nogales by motorway M15, and Mexico city via Nuevo Laredo by motorway M85. They are very important since Mexico colonization because they represent ancient ways to transport materials and nature sources to Spanish monarchs and later British colonies (now USA). Of course, they were besides guided initially from Xalapa-Veracruz to Mexico city (from Aztec’s age where Spanish tried to reach Tenochtitlan), and consequently defining this way from old times, that actually represent motorway M150.
In this context it is not surprising that “Ciudad Juárez” play a strategic position in reaching USA directly from Mexico center and beyond. This is because motorway M45 is connected with M190 and runs across all Mexican Republic south-to-north from Central America. It is also important to highlight that Ciudad Juárez undergone an explosive growth in last few years, partly to its dramatic life at the intersection of main drug transport arteries.
South-east intersections represent connectivity with highways M180 and M190. Both are the main large highways connecting principal cities in their regions with Mexico city.
Finding 5
The result is expected because spanning tree is a sub-graph of a relative neighborhood graph [35], however we intentionally highlighted it to show that — in terms of minimal-length travel — graph, built by plasmodium of Physarum polycephalum offers optimal solution for transportation of nutrients. Experiment-wise we found that the spanning tree is a sub-graph of Physarum graphs for , compare Fig. 6 and 11d.
As we demonstrated previously (Finding 1) by cutting edges of with we transform cyclic graph to a spanning tree (Fig. 6g). By comparing Fig. 6g and Fig. 10d we find that if Physarum built a transport link connecting Mazatlán and Guadalajara regions instead of connecting Chihuahua and Nuevo Laredo regions then the Physarum would approximate an ideal minimum spanning tree. Actual travel distance makes Physarum spanning tree just a bit longer than ideal spanning tree , constructed by conventional algorithm Fig. 10d.
In contrast to Physarum graphs highway graph poorly matches proximity graphs (Fig. 11e–h).
Finding 6
Let then is a disconnected graph.
Merida-Cancún region stays isolated in all four intersections (Fig. 11e–h) of the highway graph with proximity graphs. A connected cluster of regions Nuevo Laredo, Monterrey, Ciudad Victoria is disconnected from the rest of other vertices of in , , and . Of course, this cluster represents the most important economic activity of the region. But in this case the connectivity result is poor with respect to intersection with . A similar situation takes place with Merida-Cancún connection in intersection of minimum spanning tree with highway graph .
Let be a transport link connecting San Luis Potosí region with Mexico city-Puebla-State of México region then we see that links of motorway network which are also edges of Gabriel graph correspond to the common links of the motorway network and Physarum graph . San Luis Potosí connection represents a special case linked directly to Mexico city region with motorway M57.
Finding 7
Unfortunately, we have lost a link between Merida-Cancún and Mexico center and also a center-to-north link from San Luis Potosí to Chihuahua. This means that motorways M85 and M190 are partly misrepresented. Said that, the pacific-long highway connecting Nogales to Mexico city by M15 is preserved. Thus, at least, we have preserved one of the largest and most important connection between Mexico city and the North of Mexico. This way, is the best approximation as we saw previously.
5 Discussion
To approximate, or rather re-construct, development of transport network in Mexico we cut of Mexico-shaped plate of agar, represented nineteen major urban regions by oat flakes and placed a plasmodium of Physarum polycephalum in place of Mexico city.666You can see an approximation of these simulations from http://www.youtube.com/watch?v=OmwtPR2cV-4. The plasmodium developed into a full-fledged plasmodium spanning all, or almost all, oat flakes on the agar plate. We compared graphs of protoplasmic networks developed by Physarum with man-made Federal Highway network and with basic types of proximity graphs.
We found that Physarum-made graph is a sub-graph of the highway network apart of few ages. This means that, in principle, slime mould based approximation of man-made transport networks works even in very simple experimental setups. The slight mismatch between Physarum and highway graphs may be because we did not take geographical profile of Mexico into account completely, no mountains or rivers were mapped onto the plasmodium growth substrate. Also, inoculation of plasmodium in Mexico city was backed up only by the fact that Mexico city is most populated region of the country. Thus, our future work might focus on experiments with three-dimensional substrates, which adequately reflect true landscape of Mexico, and on adding a historical perspective to our studies, particularly in choosing more ancient urban region for plasmodium inoculation.
Comparison of Physarum-made transport networks developed in United Kingdom [9] to the networks grown in Mexico brings interesting insights on the existing motorway structure in these countries. Physarum graphs, which built of only edges with highest probability of occurrence in experiments were minimum (for UK) and almost-minimum (for Mexico) spanning trees. Physarum graph is a sub-graph of UK motorways graph, while Physarum graph is a super-graph of Mexican highway graph. Does it mean that Mexican Federal Highway are redundant? Or do they simply reflect harsher geographical conditions which lead to a need of duplicating traffic routes? Further studies might bring answers to these questions.
Acknowledgement
Genaro J. Martínez thanks DGAPA-UNAM and EPSRC for support. Authors express their gratitude to Mexican government and INEGI for providing the last census information and to Natalia Volkow Fernández, and Guía Roji for permission to use additional road maps.
References
- [1] Achenbach F. and Weisenseel M. H. Ionic currents traverse the slime mould Physarum. Cell Biol Int Rep. 1981 (5) 375–379.
- [2] Adamatzky A., De Lacy Costello B., Asai T. Reaction-Diffusion Computers, Elsevier, Amsterdam, 2005.
- [3] Adamatzky A. Physarum machines: encapsulating reaction-diffusion to compute spanning tree. Naturwisseschaften 94 (2007) 975–980.
- [4] Adamatzky A. Physarum machine: implementation of a Kolmogorov-Uspensky machine on a biological substrate. Parallel Processing Letters 17 (2007) 455–467.
- [5] Adamatzky A. From reaction-diffusion to Physarum computing. Invited talk at Los Alamos Lab workshop “Unconventional Computing: Quo Vadis?” (Santa Fe, NM, March 2007).
- [6] Adamatzky A. Developing proximity graphs by Physarum polycephalum: does the plasmodium follow the Toussaint hierarchy? Parallel Processing Letters (2009), in press.
- [7] Adamatzky A. If BZ medium did spanning trees these would be the same trees as Physarum built. Physics Letters A (2009), in press.
- [8] Adamatzky A. Hot ice computer. Physics Lett A 374 (2009) 264–271.
- [9] Adamatzky A. and Jones J. Road planning with slime mould: If Physarum built motorways it would route M6/M74 through Newcastle Int J Bifurcaton and Chaos (2010), in print. http://arxiv.org/abs/0912.3967
- [10] Adamatzky A. Physarum Machines: Making Computers from Slime Mould (World Scientific, 2010).
- [11] Billiot J. M., Corset F., Fontenas E. Continuum percolation in the relative neighborhood graph. arXiv:1004.5292
- [12] Dorigo M. and Stutzle T. Ant Colony Optimization MIT Press, 2004.
- [13] Gabriel K. R. and R. R. Sokal. A new statistical approach to geographic variation analysis. Systematic Zoology, 18 (1969) 259–278.
- [14] Jaromczyk J. W. and G. T. Toussaint, Relative neighborhood graphs and their relatives. Proc. IEEE 80 (1992) 1502–1517.
- [15] Jarrett T. C., Ashton D. J., Fricker M., Johnson N. F. Interplay between function and structure in complex networks Phys. Rev. E 74 (2006) , 026116.
- [16] Jones J. The emergence and dynamical evolution of complex transport networks from simple low-level behaviours. nt. Journal of Unconventional Computing, 6 (2010) 125–144.
- [17] Kirkpatrick D. G. and Radke J. D. A framework for computational morphology. In G. Toussaint, editor, Computational Geometry (1985) 217–248.
- [18] Li X.-Y. Application of computation geometry in wireless networks. In: Cheng X., Huang X., Du D.-Z. (Eds.) Ad Hoc Wireless Networking (Kluwer Academic Publishers, 2004) 197–264.
- [19] Nakagaki T. Yamada H., Ueda T. Modulation of cellular rhythm and photoavoidance by oscillatory irradiation in the Physarum plasmodium. Biophysical Chemistry 82 (1999) 23–28.
- [20] Nakagaki T., Yamada H., Ueda T. Interaction between cell shape and contraction pattern in the Physarum plasmodium, Biophysical Chemistry 84 (2000) 195–204.
- [21] Nakagaki T., Smart behavior of true slime mold in a labyrinth. Research in Microbiology 152 (2001) 767- 770.
- [22] Nakagaki T., Yamada H., and Toth A., Path finding by tube morphogenesis in an amoeboid organism. Biophysical Chemistry 92 (2001) 47 -52.
- [23] Nakagaki T., Iima M., Ueda T., Nishiura y., Saigusa T., Tero A., Kobayashi R., Showalter K. Minimum-risk path finding by an adaptive amoeba network. Physical Review Letters 99 (2007) 068104.
- [24] Matula D. W. and Sokal R. R. Properties of Gabriel graphs relevant to geographical variation research and the clustering of points in the same plane. Geographical Analysis 12 (1984) 205–222.
- [25] Muhammad R. B. A distributed graph algorithm for geometric routing in ad hoc wireless networks. J Networks 2 (2007) 49–57.
- [26] Pointer G. Focus on People and Migration 2005. Chapter 3: The UK s major urban areas. (UK Statistics Authority, 2005) www.statistics.gov.uk
- [27] Reyes D. R., Ghanem M. G., George M. Glow discharge in micro fluidic chips for visible analog computing. Lab on a Chip 1 (2002) 113–116.
- [28] Saigusa T., Tero A., Nakagaki T., Kuramoto Y. Amoebae anticipate periodic events. Phys Rev Lett. 2008 (100) 018101.
- [29] Santi P. Topology Control in Wireless Ad Hoc and Sensor Networks (Wiley, 2005).
- [30] Schumann A. and Adamatzky A. Physarum spatial logic. In: Proc. 1th Int. Symp. on Symbolic and Numeric Algorithms for Scientific Computing (Timisoara, Romania, September 26-29, 2009).
- [31] Shirakawa T., Adamatzky A., Gunji Y.-P., Miyake Y. On simultaneous construction of Voronoi diagram and Delaunay triangulation by Physarum polycephalum. Int. J. Bifurcation and Chaos (2009), in press.
- [32] Song W.-Z., Wang Y., Li X.-Y. Localized algorithms for energy efficient topology in wireless ad hoc networks. In: Proc. MobiHoc 2004 (May 24 -26, 2004, Roppongi, Japan).
- [33] Sridharan M. and Ramasamy A. M. S. Gabriel graph of geomagnetic Sq variations. Acta Geophysica (2010) 10.2478/s11600-010-0004-y
- [34] Tero A., Kobayashi R. and Nakagaki T., Physarum solver: A biologically inspired method of road-network navigation. Physica A 363 (2006) 115–119.
- [35] Toussaint G. T., The relative neighborhood graph of a finite planar set, Pattern Recognition 12 (1980) 261–268.
- [36] Tsuda S., Aono M., Gunji Y.-P. Robust and emergent Physarum logical-computing. Biosystems 73 (2004) 45–55.
- [37] Tsuda S, Zauner K.-P., Gunji Y.-P. Robot control with bio-logical cells. BioSystems 87 (2007) 215–223.
- [38] Wan P.-J., Yi C.-W. On the longest edge of Gabriel Graphs in wireless ad hoc networks. IEEE Trans. on Parallel and Distributed Systems 18 (2007) 111–125.
- [39] Watanabe D. A study on analyzing the road network pattern using proximity graphs. J of the City Planning Institute of Japan 40 (2005) 133–138.
- [40] Watanabe D. Evaluating the configuration and the travel efficiency on proximity graphs as transportation networks. Forma 23 (2008) 81- 87.