The Relation Between Charged Particles and Muons With Threshold Energy 1 GeV in Extensive Air Showers Registered at the Yakutsk EAS Array
Abstract
Characteristics of the muon component in EAS are analyzed together with their fluctuations. The aim of this analysis — a comparison of experimental data with computational results obtained within frameworks of various hadron interaction models for protons and iron nuclei and an estimation of cosmic ray mass composition in the ultra-high energy region.
I Introduction
The Yakutsk complex array for many years measures three main observables of extensive air showers (EAS): total charged component, muons with GeV and Cherenkov light (Artamonov et al, 1994). Using these data we estimated the EAS energy with model independent quasi-calorimetric method (Knurenko et al, 2006) and determined the depth of maximum shower development (by the measured Cherenkov light lateral distribution, using the parameter and by the shape of the Cherenkov light pulse, ) (Dyakonov et al, 1993; Knurenko, Kolosov, Makarov et al, 2005). The relative muon content at different core distances was measured (Knurenko et al, 2001; Knurenko, Ivanov et al, 2005) and the cosmic ray (CR) mass composition was estimated by various EAS characteristics (Knurenko, Kolosov et al, 2005; Knurenko et al, 2007; Knurenko, Ivanov, et al, 2007).
In this paper we analyze the muon component of EAS: mean characteristics, muon content and its fluctuations at fixed energy. The analysis is conducted within the framework of QGSJet II (Ostapchenko, 2006) and EPOS (Werner et al, 2006) hadron interaction models involving computations for primary particles of different masses using CORSIKA-6.900 code (Heck et al, 1998).
II Muon lateral distribution function
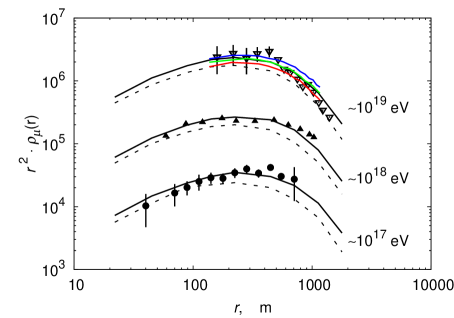
In Figure 1 examples of mean lateral distributions for muons at different energies are displayed. The muon lateral distribution function (LDF) is significantly lower then that of the charged component and can be effectively measured in individual events at eV within the core distance range m. Thus, as a classification parameter in this energy region, a parameter could be used — the density of muon flux at m from shower core.
Solid and dotted lines on the figure denote computational results obtained with QGSJet(UrQMD) models for proton (solid) and iron (dotted). It is seen from Figure 1 that the muon LDF from protons is steeper than that from iron nuclei and this difference is especially pronounced at large core distances. Qualitative comparison of computational results with the experiment reveals a better agreement with a heavier component of primary CR at eV and with lighter at eV. This feature could be stressed out if one puts parameter on the -axis of a plot instead of simple .
III Muon portion and its dependence on angle, energy and the depth of maximum EAS development
We considered the dependence of on the length of shower development after the maximum — . In highly inclined showers the muon content increases proportionally to value, where 0ptfor Yakutsk.
It is a known fact that the depth of maximum EAS development differs significantly, depending on the kind of primary particle and, hence, this feature could be used in the analysis of the CR mass composition: for instance, by fixing the parameter and studying the fluctuations of value. This technique is rather similar to one proposed by Atrashkevich et al (1981).
Shower parameters calculated with CORSIKA code were modified by applying distortions according to experimental errors. Parameters measured in experiment (e.g. ) for every shower were rolled with the normal distribution with parameter according to the experiment:
where is the area of the detector.
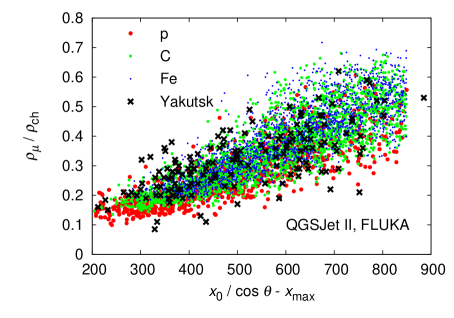
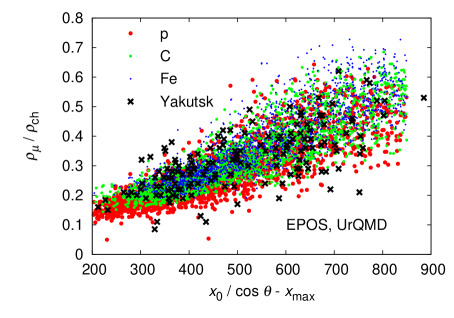
Figure 2 shows the dependence of on the length of cascade development after the shower maximum compared with computational results. A strong correlation is observed between the muon content and the length of track in the atmosphere after the shower maximum. It is also seen that experimental data are in good agreement with simulation results.
IV Mean characteristics

Figure 3 shows the energy dependence of obtained in the Yakutsk and MIA EAS experiments (Abu-Zayyad et al, 2001). A good agreement is observed between the two.
Computational results obtained with EPOS and QGSJet01 from the work by Abu-Zayyad et al (2001) are denoted with lines, dotted line represent our simulations with QGSJet II for protons and iron nuclei. A comparison of our computations with the results obtained by Abu-Zayyad et al (2001) reveals that virtually there is no difference between QGSJet01 and QGSJet II. A significant discrepancy is observed between EPOS and QGSJet II and it, as we believe, is associated with different amounts of muons generated by models. For example, the value calculated with EPOS for proton coincides with obtained with QGSJet II for iron. Thus, a comparison of experimental data with model calculations result in controversial conclusions on CR mass composition. According to EPOS, at energies up to eV CRs consist of iron nuclei and above that energy, up to eV — of protons. In the energy interval eV QGSJet II computations agree with the experiment quite well if primary particles are iron nuclei and above eV the mass composition might be mixed with portion of protons and helium nuclei not less than %. More precise estimation of CR mass composition could be derived after improvement of theoretical models and selecting one, that describes experimental EAS data better then others.
V Fluctuations of relation on the ground level at the energy eV
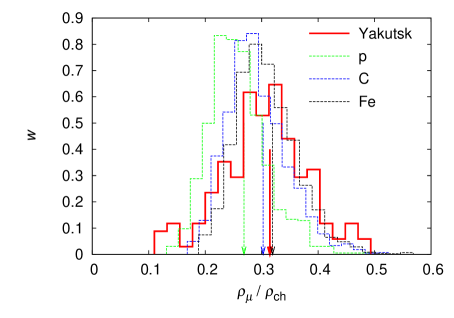
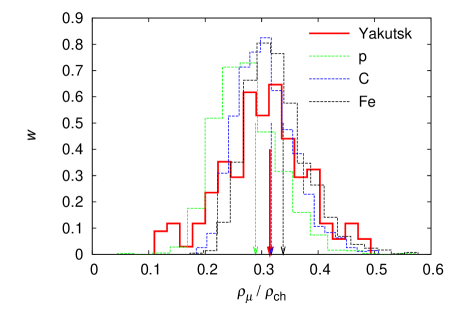
Showers initiated by different nuclei have differing altitudes of the maximum which in turn means that different numbers of muons are generated in these showers. It also means that they cover different paths in the atmosphere. By analyzing the tracks of muons that they pass in the atmosphere after the maximum of shower development we can try to estimate the composition of cosmic rays. With this aim in view, by choosing the mean zenith angle (which corresponds to the track length after the maximum 0pt), let us normalize the values of muon content to this level and consider their fluctuations.
Results are presented in Figure 4. Also shown are the computational results obtained with QGSJet II and EPOS models for various nuclei. Measured values of fluctuations are presented in Table 1. Obtained results have shown that within this method fluctuations of parameters do not allow to estimate the CR mass composition. However, mean values from different nuclei differ. Besides, QGSJet II hints at a heavier composition than that of EPOS: according to first one, the composition of selected showers shifts towards heavier nuclei; according to second one, showers correspond to nuclei of intermediate group. On the whole, both models argue for a mixed composition.
However, if one takes into account gamma-photons generated in ground covering muon detectors, the mean value of relation decreases and the composition shifts towards lighter nuclei (protons-helium-carbon) Dedenko et al (2010).
| QGSJet II, FLUKA | EPOS, UrQMD | |||||||
|---|---|---|---|---|---|---|---|---|
| Yakutsk | Yakutsk111With respect to contribution from gammas generated in the shielding of detector (Dedenko, 2010) | p | C | Fe | p | C | Fe | |
VI Conclusions
Within the framework of QGSJet II and EPOS hadron interaction models using the CORSIKA code the values of muon portion at core distance m were obtained. A relation between the muon portion and a distance to the depth of shower maximum was also obtained. A comparison of the dependency with experiment has shown that taking account of the experimental errors in the simulation data, a good agreement is observed between simulation and experiment.
A comparison of the muon portion distribution with computational results points towards a mixed cosmic ray composition near eV. Large fluctuations of the muon portion prevent revealing of a single determined group of nuclei. A more detailed analysis is required, involving possible systematics of muon density measurement in the Yakutsk experiment.
Acknowledgements.
The work is supported by RFBR grants 08-02-00348-a, 09-02-12028 ofi-m and FANI g.k. 02.740.11.0248, 02.518.11.7173.References
- Artamonov et al (1994) V. P. Artamonov, B. N. Afanasiev, A. V. Glushkov. Izv. RAN, ser. fiz., 1994, t. 58, No. 12, s. 92-97. (in Russian)
- Knurenko et al (2006) S. P. Knurenko, A. A. Ivanov, I. E. Sleptsov et al. Pisma v ZhETF, 2006, V. 83, 11, s. 563-567. (in Russian)
- Dyakonov et al (1993) M. N. Dyakonov, S. P. Knurenko, V. A. Kolosov et al. Proc. 23th ICRC, Calgary, V. 3, p. 303, 1993.
- Knurenko, Kolosov, Makarov et al (2005) S. P. Knurenko, V. A. Kolosov, I. T. Makarov et al. Int. Jour. of Modern Physics A. Vol. 20, No. 29 (2005). pp. 6900-6902.
- Knurenko et al (2001) S. P. Knurenko, V. A. Kolosov, I. T. Makarov et al. Proc. 27th ICRC, Hamburg, V. 1, pp. 157-160, 2001
- Knurenko, Ivanov et al (2005) S. P. Knurenko, A. A. Ivanov, I. E. Sleptsov et al. Izv. RAN, ser. fiz. 2005, t. 69, No. 3, s. 363-365. (in Russian)
- Knurenko, Kolosov et al (2005) S. P. Knurenko, V. A. Kolosov, I. T. Makarov et al. Int. Jour. of Modern Physics A. Vol. 20, No. 29 (2005) pp. 6894-6896.
- Knurenko et al (2007) S. P. Knurenko, A. A. Ivanov, I. E. Sleptsov. Izv. RAN, ser. fiz., 2007, t. 71, No. 4. s. 467-469. (in Russian)
- Knurenko, Ivanov, et al (2007) S. P. Knurenko, A. A. Ivanov, I. E. Sleptsov. Pisma v ZhETF, 2007, t. 86, vyp. 10, s. 709-712. (in Russian)
- Ostapchenko (2006) S. S. Ostapchenko. Nucl. Phys. B (Proc. Suppl.) 151, 143 (2006).
- Werner et al (2006) K. Werner, F. M. Liu, T. Pierog. Phys. Rev. C 74 (2006) 044902.
- Heck et al (1998) D. Heck, J. Knapp, J.-N. Capdevielle et al. Forschungszentrum Karlsruhe Thechnical Report No. 6019 (1998).
- Fassó et al (2005) A. Fassó, A. Ferrari, J. Ranft and P. R. Salpa., CERN-2005-10 (2005), INFN/TC_05/11, SLAC-R-773
- Bass et al (1999) S. A. Bass et al. Prog. Part. Nucl. Phys. 41 (1998) 225. M. Bleicher et al. J. Phys. G25 (1999) 1859.
- Atrashkevich et al (1981) V. B. Atrashkevich, N. N. Kalmykov, G. B. Khristiansen. Pisma v ZhETF, 1981, t. 33, vyp. 4, s. 236-239. (in Russian)
- Abu-Zayyad et al (2001) T. Abu-Zayyad et al. Astroph. J. 557, 686 (2001)
- Glushkov (2008) A. V. Glushkov, D. S. Gorbunov, I. T. Makarov et al. JETPl. 87, 220 (2008)
- Dedenko et al (2010) L. G. Dedenko et al. Private discussion at Moscow CR conference. (2010)