Occultation of the Quiescent Emission from Sgr A* by IR Flares
Abstract
We have investigated the nature of flare emission from Sgr A* during multi-wavelength observations of this source that took place in 2004, 2005 and 2006. We present evidence for dimming of submm and radio flux during the peak of near-IR flares. This suggests that the variability of Sgr A* across its wavelength spectrum is phenomenologically related. The model explaining this new behavior of flare activity could be consistent with adiabatically cooling plasma blobs that are expanding but also partially eclipsing the background quiescent emission from Sgr A*. When a flare is launched, the plasma blob is most compact and is brightest in the optically thin regime whereas the emission in radio/submm wavelengths has a higher opacity. Absorption in the observed light curve of Sgr A* at radio/submm flux is due to the combined effects of lower brightness temperature of plasma blobs with respect to the quiescent brightness temperature and high opacity of plasma blobs. This implies that plasma blobs are mainly placed in the magnetosphere of a disk-like flow or further out in the flow. The depth of the absorption being larger in submm than in radio wavelengths implies that the intrinsic size of the quiescent emission increases with increasing wavelength which is consistent with previous size measurements of Sgr A*. Lastly, we believe that occultation of the quiescent emission of Sgr A* at radio/submm by IR flares can be used as a powerful tool to identify flare activity at its earliest phase of its evolution.
1 Introduction
Observations of stellar orbits in the proximity of the enigmatic radio source Sgr A* located at the very dynamical center of our galaxy have established that it is a 4 black hole (Reid & Brunthaler, 2004; Ghez et al., 2008; Gillessen et al., 2009). The emission from Sgr A* consists of quasi-steady and variable components (e.g. Hornstein et al., 2007; Dodds-Eden et al., 2010; Yusef-Zadeh et al., 2010). The variable component is now detected in almost all wavelength bands and is used to estimate the physical quantities of the gas flow, the radiation mechanism in different wavelength bands and the scale lengths at which variable emission operates. One of the puzzling aspect of the flaring activity of Sgr A* is the physical nature of the variable emission in different wavelengths and how its spectrum evolves with time. Furthermore, it is not clear whether flares are deeply embedded in the accretion disk of Sgr A* or are physically distinct from the region where the bulk of the emission arises (Yusef-Zadeh et al., 2006a, 2008, 2009; Marrone et al., 2008; Eckart et al., 2008; Trap et al., 2010).
Flare emission at near-IR (IR) wavelengths is due to optically thin synchrotron emission and the submm frequency is considered to be the dividing line between optically thin emission at high frequencies (near-IR), and optically thick emission at lower frequencies (submm/radio). To examine the possibility that there is a causal association between radio/submm variability and IR flaring activity, we studied in detail the light curves of flare emission from optically thick and thin plasma where there was sufficient overlap between IR/X-ray and submm/radio wavelengths. We searched for signatures of optical depth effect against the background quiescent emission at the earliest phase of the evolution of flares.
2 Data Reduction and Results
The primary purpose of our archival search was to find simultaneous observations of Sgr A* at submm, radio and IR wavelengths. We found three experiments that had overlaps between these wavelengths bands. Almost all the data presented here have already been published previously.
One multi-wavelength observing campaign was carried out on 2006 July 17 during which there was wavelength coverage between the Keck, Chandra, the Caltech Submillimeter Observatory (CSO), the Submillimeter Array (SMA), and the Very Large Array (VLA) of the National Radio Astronomy Observatory666The National Radio Astronomy Observatory is a facility of the National Science Foundation, operated under a cooperative agreement by Associated Universities, Inc. (NRAO) (Hornstein et al., 2007; Marrone et al., 2008; Yusef-Zadeh et al., 2008). The CSO data are reanalyzed with a higher time sampling and the VLA data are recalibrated. The light curves presented at 7 and 13mm have selected data corresponding to uv spacings greater than 100k.
The second multi-wavelength observations took place on 2005 July 31 employing the CSO, the SMA, the Keck II and Very Large Telescopes (VLT). The time coverage on this day was excellent as there was a total of ten continuous hours of observations with the Keck II and VLT telescopes at IR wavelengths (Hornstein et al., 2007; Marrone et al., 2008; Meyer et al., 2008). We searched for archival radio data from the VLA and found 7mm (43GHz) and 13mm (12GHz) data taken for a temporal coverage of about four hours on 2005, July 31. These data were taken in the C configuration using fast switching technique and a phase calibrators (0173+331, 17444-31166) to take out rapid atmospheric fluctuations. The light curves presented here are self-calibrated in phase using data corresponding to uv spacings .
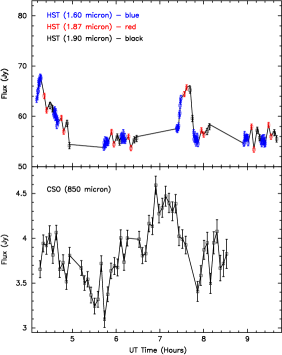
Lastly, the campaign that took place on 2004 September 4 made simultaneous observations with the Hubble Space Telescope (HST/NICMOS) and CSO. The submm data are reanalyzed with a better time sampling (Yusef-Zadeh et al., 2006b). The NICMOS data include photometry from three filters - F160W, F187N, and F190N - which are centered at wavelengths of 1.6, 1.87, and 1.90m. The aperture photometry measurements have been corrected to an absolute flux scale, including an extinction correction that assumes AK=3.3 magnitudes for Sgr A*.
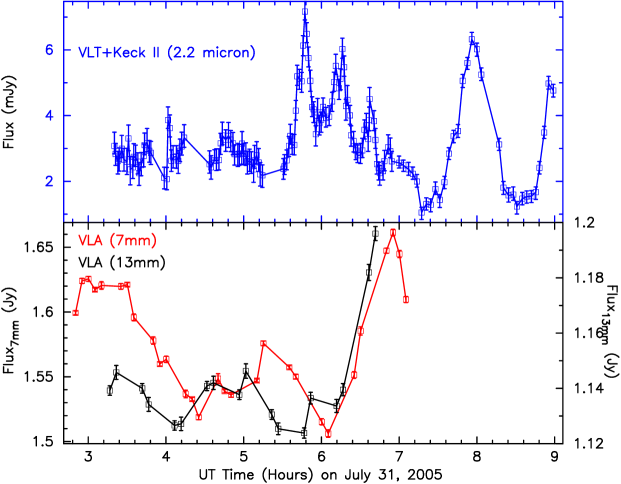
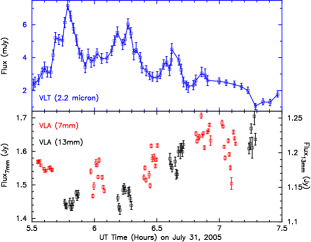
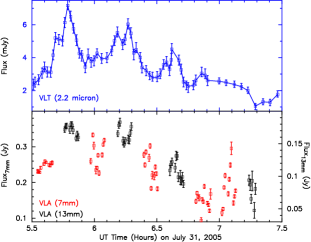
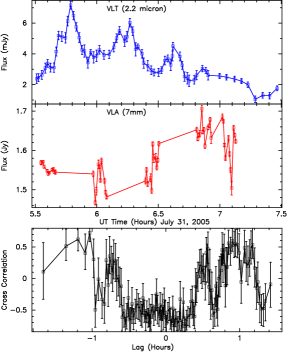
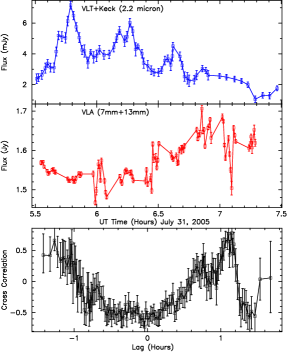
Three examples in which there is evidence for anti-correlation of optically thin and thick flare emission are presented. The first set of light curves show radio observations of flaring activity that took place on July 31, 2005. Meyer et al. (2008) presented a 600min light curve by combining Keck II and VLT data. Sgr A* was highly active during this period showing several IR flares. Figure 1a shows IR and radio light curves. The bottom panels show individual 7mm and 13mm light curves in two different colors. Radio measurements indicate a remarkable trend that the emission is higher when there is a low-level flaring activity and is lower when there is a strong IR flare. This trend is best noted at times less than 5h UT and greater than 6h UT. The flux changes by about 150 and 100 mJy at 7 and 13mm wavelengths, respectively. A more detailed view of flaring activity between 5.5h and 7.5h UT is shown in Figure 1b. The light curves at at 2.2 m, 7 and 13mm are presented with sampling time of 60s, 30sec and 30sec, respectively. The anti-correlation is evident clearly, first by the rise and fall of IR and radio activity during 5.5 and 7.5h UT. A more detailed examination of the radio emission anti-correlating with two of the strongest IR flares can best be viewed near 6h UT. Radio flux rises between the two peaks of flare emission at 5.8h and 6.2 UT. The fast fluctuations in the flux of Sgr A* at radio wavelengths appears to track the variation of flux at IR wavelengths. To clarify this relationship better, radio flux of Sgr A* are reversed before the change in radio flux is presented in Figure 1c. The ”correlation” of radio and IR flux is shown in remarkable clarity, given that the quiescent flux and the net variable flux are different at 7 and 13mm wavelengths. The apparent discrepancy between 7mm and 2.2m variation near 7.1h UT may be due to poor time sampling min of Keck data and a sudden change of observations from VLT to Keck which starts around 6.8h UT. The anti-correlation between near-IR and 1.3mm data (Marrone et al. 2008) was not as clear as that of radio and near-IR data but 1.3mm data could suffer from poor sampling and complication from time delayed emission. To examine the anti-correlation statistically, Figure 2a,b show the cross correlation of the IR data with 7mm and the merged 7 and 13mm data, respectively. The cross-correlation analysis use the ZDC function algorithm (Alexander, 1997). A minimum in the likelihood value is identified at a zero time lag, strengthening the anti-correlation of IR and radio data.
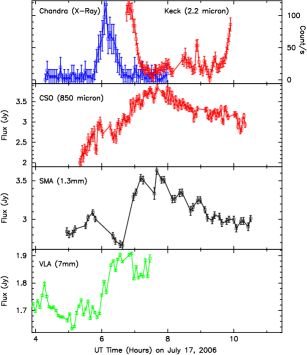
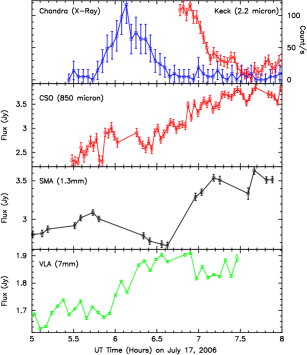
The second evidence for dimming of optically thick light comes from observations made in 2006 July 17 (Marrone et al., 2008; Yusef-Zadeh et al., 2008). The authors showed evidence of a time delay between the peaks of IR/X-ray emission with respect to radio/submm emission. Figure 3a shows simultaneous light curves of Sgr A* at X-rays between 2 and 8 keV, IR K′ band (Hornstein et al., 2007), 850m, 1.3mm, and 7mm. In these observations, as noted in the top panel of Figure 3a, the second half of the X-ray flare was observed with Keck and showed evidence of flaring at IR wavelengths. This figure shows a dip in the flux of mm and submm emission, during which an X-ray flare is detected. A close-up view during the peak emission at X-rays between 5:30 and 8h UT is shown in Figure 3b. The light curves at 1.3mm and 850m track each other well. However, we note the 7mm light curve seems to be somewhat shifted in time by with respect to the 1.3mm light curve. The poor sampling of 1.3mm data between 6 and 7h UT makes the comparison difficult. The largest drop in the 1.3mm flux is noted at 6.7h UT. The average dimming at 850m, 1.3mm and 7mm range between 0.5-1 Jy, 0.5 Jy and 200-300 mJy, respectively. The 13mm data also showed a very similar light curve to that of 7mm with a flux variation of about 100-150 mJy.
Although we note a general trend in the anti-correlation of X-ray and optically thick emission, this anti-correlation should have been evident between IR and optically thick emission. This is because X-ray emission is processed IR emission and does not exactly tract the flux of a IR flare. The duration of a typical X-ray flare is generally shorter than in IR wavelengths (Dodds-Eden et al., 2009; Marrone et al., 2008). The 2.2m flare of Figure 3 indicates the duration of flare is longer than that observed in X-rays by at least 30 minutes on the decaying side of the flare. Unfortunately, there is no IR data available at times earlier than 6:45h UT. Nevertheless, the rise of flux at 7mm, 1.3mm and 850m between 6h and 6:45h UT is consistent with the decline in the IR flux. Using the anti-correlation between IR and radio flux, we expect that the IR flare should have started around 5h UT with a flare duration of about two hours. Another feature we note in Figure 3 is a possible trend that the dimming of light appears to end first at longer wavelengths. However, this needs to be confirmed as SMA data are not sampled well during the dip in the quiescent flux of Sgr A*.
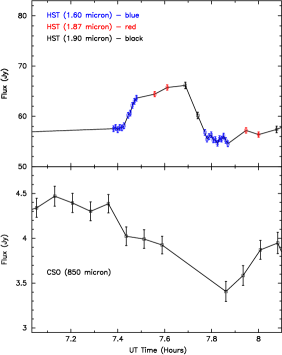
Lastly, the light curves showing evidence of dimming at submm wavelengths is also detected in an observing campaign that took place on 2004, September 4. The light curves presented in Figure 4a show emission at 850m and three IR wavelengths at 1.6, 1.87 and 1.90m. Two strong IR flares and one submm flare are detected near 4.2h UT, 7.6h UT and 7h UT, respectively. (see also Figure 10 of Yusef-Zadeh et al. (2006b). A previous analysis of submm data using long sampling time of 20min in the construction of the light curve suggested the possibility that the submm flare is the counterpart either to flare at 4.3h UT delayed by 200min with respect to the first IR flare or to the second IR flare at 7.6 with no time delay (Yusef-Zadeh et al., 2006b). However, the new analysis shows a new feature that had not been recognized before. The 850m light curve indicates a decrease in the quiescent flux of Sgr A* by 500 mJy during which the second IR flare occurred. We also note a decrease in the submm flux at the start of IR observations when there is a detection of a flare. Figure 4b shows detailed views of the light curves to demonstrate the brightening and dimming of IR and submm flux during flaring activity near 7.6h UT, respectively. This figure provides another support for a general trend in the anti-correlation between IR flare emission and submm flux of Sgr A*. Exceptions to this trend are two data points at 7.8h UT during which submm flux is lower than the peak IR flux near 7.5h UT. Unfortunately, the data are not sampled well at these wavelengths. Another effect that may complicate the analysis of absorption in light curves at radio and submm wavelengths could be due to flaring events that are time delayed and are superimposed on an absorbing feature.
3 Discussion
The infrared wavelength band is the most important part of the spectrum of flare emission from Sgr A*. This is because the flare is first launched in IR wavelengths followed by radio and submm emission being delayed with respect to the peak in IR emission. In this model, flaring at a given frequency is produced through the adiabatic expansion of an initially optically thick blob of synchrotron-emitting relativistic electrons. The expanding hot plasma model of Sgr A* flares has explained the nature of time delay of flare emission in the optically thick regime. However, the relationship between IR and radio/submm flare emission has not been well established. Recent work has suggested that that the optically thin component of flare emission is unrelated to the evolution of optically thick emission and that that IR and radio/submm flares emission operate independent of each other (e.g. Sabha et al., 2009). The light curves presented here demonstrate the dimming of the quiescent flux of Sgr A* at radio/submm wavelengths while IR flares are observed. The new measurements show that the observed flares in different frequencies operate under the same physical mechanism.
A likely scenario for the drop in flux seen at radio and submm frequencies during IR flaring is that the electron population responsible for the flaring is optically thick at lower frequencies, partially obscures the submm-radio emission from the accretion flow, and has a lower brightness temperature. To explore this picture we construct a simple two-component model. The first component is a homogeneous, foreground, synchrotron emission region responsible for the IR flare. We characterize this by an electron energy spectrum of relativistic electrons, a magnetic field strength , and radius . This component is responsible for the IR flare and also for producing the dips in the emission from Sgr A*. The second, background, component is responsible for the quiescent flux from Sgr A* in the radio and submm, is also homogeneous and is parametrized by its flux density and radius , both of which are frequency-dependent. For simplicity, we assume that the two components are concentric, so that the fraction of the quiescent background source covered by the flaring component is when and otherwise.
The net flux received from Sgr A* in this simple model consists of contributions from the flaring region, and the obscured and unobscured fractions and of the quiescent source:
| (1) | |||||
| (2) |
where the flare region has source function , optical depth , and subtends solid angle at Earth, where kpc is our adopted distance to the Galactic Center.
The synchrotron source function for an electron number density spectrum is
| (3) |
where
| (4) |
is the typical energy of the electrons responsible for synchrotron emission at frequency , and the other symbols have their usual meaning (e.g. Rybicki & Lightman, 1986). We write the optical depth as , where the synchrotron absorption coefficient is
| (5) |
Note that we have implicitly set the electron pitch angle to 90 degrees in equations (5) and (4). Finally, we adopt a fixed ratio between the energy density of the electron population, i.e. , and the energy density of the magnetic field, i.e. , so that
| (6) |
between energies and , where .
The flux in the infrared is dominated by optically thin flare emission, and equation (2) reduces to
| (7) |
This allows us to use equations (3)–(6) to compute the flare region’s magnetic field strength, optical depth and source-function flux
| (8) | |||||
| (9) | |||||
| (10) |
where we have scaled the results using cm, , mJy at 2.2 m, and GHz. The weak dependence on the equipartition factor mean that our results are insensitive to the ratio of the energy densities in the magnetic field and electron population.
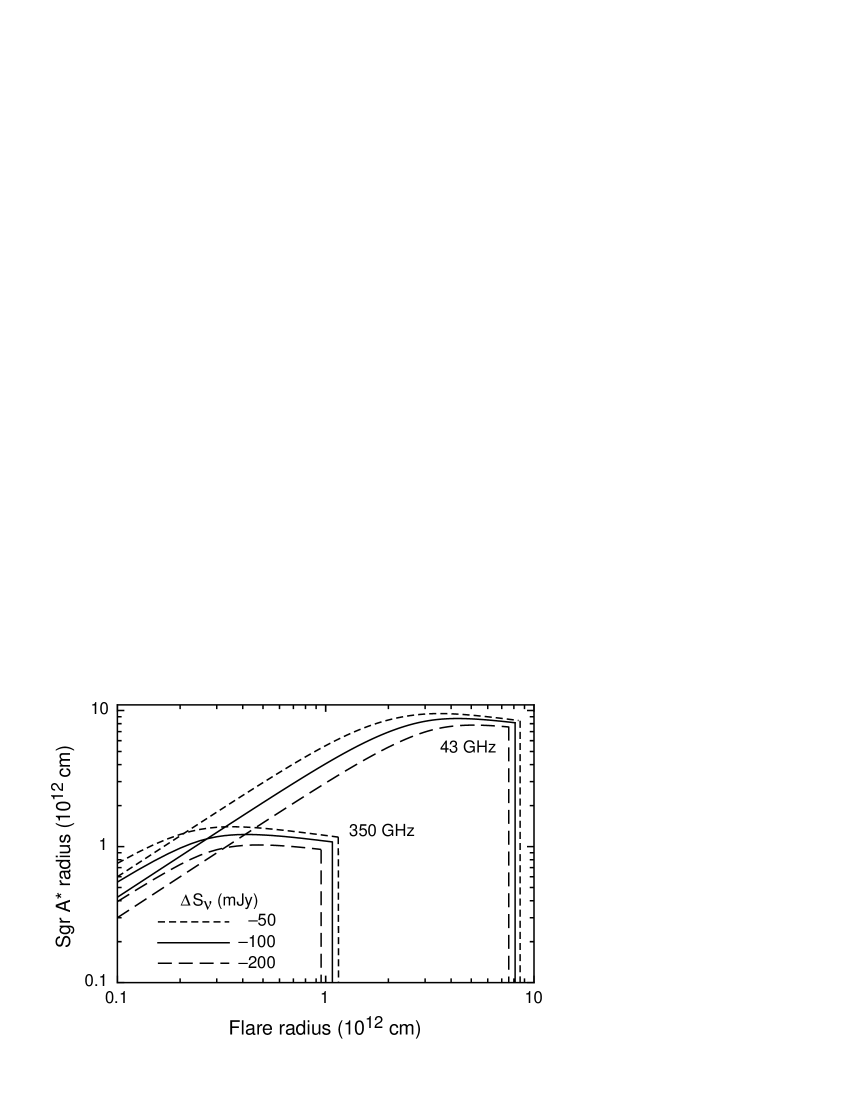
Having determined the properties of the flare source region, we can compute its obscuring effect on the radio–submm quiescent emission using (2). By way of illustration we adopt , 10 mJy flux of at 2.2 m, and quiescent fluxes and 1.8 Jy at and 43 GHz, respectively. At each frequency, for a given choice of quiescent source radius we compute the flare region radius that would produce a specified drop in the total flux. The results are plotted in Fig. 5 for flare-induced drops of 0.05, 0.1, and 0.2 Jy at 350 GHz (850m) and 43 GHz (7mm).
At 350 GHz, absorption of during an IR flare implies that both and cm. The latter is consistent with the size of Sgr A* inferred from VLBI measurements at 230 GHz, which found a major axis FWHM as (Doeleman et al., 2008) and in conjunction with lower frequency measurements (Bower et al., 2006) infer a wavelength dependence, implying a major axis FWHM of as at 350 GHz, equivalent to cm. While choices of smaller in principle produce similar absorption levels, the magnetic field strength scales as , and exceeds 100 G for cm.
The 43 GHz curves in Figure 5 imply that values of much below cm require unrealistically small size for Sgr A* at 43 GHz. The radius of a flare cm , on the other hand, implies that cm at 43 GHz. While this is several times smaller than the measured semi major axis, cm, the semi-minor axis is not yet determined and may be a few times less, so this discrepancy is not as large as may first appear.
This simple model shows that occultation of Sgr A* by an IR flare source can produce noticeable dips in the flux from Sgr A* at radio and sub-mm frequencies. The major uncertainties are the electron spectral index, which is used to infer the optical depth at radio and submm from the IR flux density, and the requirement that the IR flare region must overlie the radio emission. Note however that for a given IR flux density, a steeper electron spectrum implies greater optical depth at low frequencies. This latter would more naturally occur if the flare emission occurred in a magnetosphere of a disk-like flow or further out in the flow. One would expect that the geometry would not be favorable all of the time.
A recent model has considered time dependent model of flare emission from Sgr A* (Dodds-Eden et al., 2010). They argue that flares are generated from the dissipation of the magnetic field due to the reconnection of the field in the accretion disk (see also Yuan et al., 2009). This model predicts a dimming of flux at submm flux. Although their picture is quite consistent with some of the light curves presented here, more detailed observations are required to distinguish between these two models. In other words, the question is whether the occultation is to due to an absorbing blob of hot plasma against a background quiescent flux of Sgr A* or due to a decrease in the flux as a a consequence of the dissipation of the magnetic field due to reconnection of magnetic field lines. Future detailed modeling and observations with long time coverage should be able to address the difference between these two models.
Acknowledgments: This work is partially supported by the grant AST-0807400 from the NSF. We are grateful to D. Marrone, S. Hornstein and F. Baganoff for providing us with their data.
References
- Alexander (1997) Alexander, T. 1997, MNRAS 285, 891
- Bower et al. (2006) Bower, G. C., Goss, W. M., Falcke, H., Backer, D., and Lithwick, Y. 2006, ApJ, 648, L127
- Dodds-Eden et al. (2009) Dodds-Eden, K., Porquet, D., Trap, G., Quataert, E., Haubois, X., Gillessen, S. et al. 2009, ApJ, 698, 676
- Dodds-Eden et al. (2010) Dodds-Eden, K., Sharma, P., Quataert, E., Genzel, R. Gillessen, S., Eisenhauer, F. and Porquet, D. 2010, ApJ, submitted (ArXiv:1005.0389v1)
- Doeleman et al. (2008) Doeleman, S. S., Weintroub, J., Rogers, A. E. E., Plambeck, R., Freund, R., Tilanus, R. P. J. et al. 2008, Nature, 455, 70
- Eckart et al. (2006) Eckart, A., Schödel, R., Meyer, L., Trippe, S. Ott, T. and Genzel, R. 2006, A&A, 455, 1
- Eckart et al. (2008) Eckart, A., Schd̈el, R., Garciacute-Marin, M., Witzel, G., Weiss, A., Baganoff, F. K., Morris, M. R., Bertram, T. et al. 2008, A&A, 492, 337
- Ghez et al. (2008) Ghez, A. M., Salim, S., Weinberg, N. N., Lu, J. R., Do, T., et al. 2008, ApJ, 689, 1044
- Gillessen et al. (2009) Gillessen, S., Eisenhauer, F., Trippe, S., Alexander, T., Genzel, R., Martins, F. and Ott, T. 2009, ApJ, 692, 1075
- Hornstein et al. (2007) Hornstein, S. D., Matthews, K., Ghez, A. M., Lu, J. R., Morris, M. et al. 2007, ApJ, 667, 900
- Marrone et al. (2008) Marrone, D. P., Baganoff, F. K., Morris, M. R., Moran, J. M., Ghez, A. M. et al. 2008, ApJ, 682, 373
- Meyer et al. (2008) Meyer, L., Do, T., Ghez, A., Morris, M. R., Witzel, G., Eckart, A., et al. 2008, ApJ, 688, L17
- Reid & Brunthaler (2004) Reid, M. J. and Brunthaler, A. 2004, ApJ, 616, 872
- Rybicki & Lightman (1986) Rybicki, G. B. & Lightman, A. P. 1986, Radiative Processes in Astrophysics, Wiley-VCH
- Sabha et al. (2009) Sabha, N., Witzel, G., Eckart, A., Buchholz, R. M., Bremer, M. et al. 2009, A&A, 512, pA2
- Trap et al. (2010) Trap, G., Goldwurm, A., Dodds-Eden, K., Weiss, A., Terrier, R. et al. 2010, A&A, (submitted)
- van der Laan (1966) van der Laan, H. 1966, Nature, 211, 1131
- Yuan et al. (2009) Yuan, F., Lin, J., Wu, K., and Ho, L. C. 2009, MNRAS, 395, 2183
- Yusef-Zadeh et al. (2006a) Yusef-Zadeh, F., Roberts, D., Wardle, M., Heinke, C. O. and Bower, G. C. 2006a, ApJ, 650, 189
- Yusef-Zadeh et al. (2006b) Yusef-Zadeh, F., Bushouse, H., Dowell, C. D., Wardle, M., Roberts, D., Heinke, C., Bower, G. C., Vila-Vilaró, B., Shapiro, S., Goldwurm, A., Bélanger, G. 2006b, ApJ, 644, 198
- Yusef-Zadeh et al. (2008) Yusef-Zadeh, F. and Wardle, M. and Heinke, C. and Dowell, C. D. and Roberts, D. and Baganoff, F. K. and Cotton, W. 2008, ApJ, 682, 361
- Yusef-Zadeh et al. (2009) Yusef-Zadeh, F., Bushouse, H., Wardle, M., Heinke, C. et al. 2009, ApJ, 706, 348
- Yusef-Zadeh et al. (2010) Yusef-Zadeh, F. Wardle, M., Miller-Jones, D., Roberts, D., Porquet & D., and Grosso, N. 2010, ApJ(submitted)