Is (10580) really ?
Abstract
We analyse data for production published by the BABAR Collaboration, in the invariant-mass interval delimited by the and thresholds. In particular, we describe the (10580) enhancement, not as a resonance, but rather as a threshold phenomenon due to the opening of the decay channel and enhanced by the bound-state pole not far below this threshold. The same data provide evidence for the true resonance, which we find at 10.735 GeV with a width of 38 MeV. At higher energies, two more known resonances are observed by us in the data and classified. The vital role played in our analysis by the universal confinement frequency is again confirmed, via a comparison with the charmonium spectrum.
1Centro de Física Computacional,Departamento de Física,Universidade de Coimbra, P-3004-516 Coimbra, Portugal
2Centro de Física das Interacções Fundamentais,Instituto Superior Técnico,Universidade Técnica de Lisboa, Edifício Ciência,P-1049-001 Lisboa, Portugal
-
Key words Excited vector bottomonium resonances, electron-positron annihilation, open-bottom decays, threshold effects, universal confinement frequency
-
PACS 14.40.Pq, 13.25.Gv, 13.66.Bc, 14.40.Nd
1 Introduction
The higher bottomonium vector states, discovered more than two decades ago, are still today a puzzling topic of intensive research. In Refs. [1] and [2], the CUSB and CLEO Collaborations, respectively, presented the first results for the energy dependence of the ratio above the open-bottom threshold. Data of Ref. [1] were observed with the CUSB calorimetric detector operating at CESR (Cornell). The experimental analysis resulted in evidence for structures at MeV, MeV, and GeV, with total hadronic widths of MeV, MeV, and MeV, respectively. Structures at about 10.68 and 11.2 GeV were not included in the analysis of the CUSB Collaboration. Data of Ref. [2] were obtained from the CLEO magnetic detector, also operating at CESR. This experimental analysis resulted in evidence for structures at MeV, MeV, MeV, and MeV, with total hadronic widths of MeV, MeV, MeV, and MeV, respectively. A structure at about 11.2 GeV was not included in the analysis of the CLEO Collaboration.
Here, we study data on hadron production in electron-positron annihilation in the invariant-mass interval between the and thresholds, published by the BABAR Collaboration [3]. In their paper, BABAR concentrates on two of the resonances in the spectrum, using data obtained by the BABAR detector at the PEP-II storage ring, resulting in the Breit-Wigner parameters MeV (mass) and (width) for the , and MeV (mass) and (width) for the .
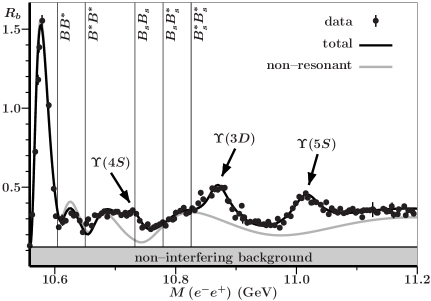
The experimental line shape of hadron production in annihilation in the invariant-mass interval between the and thresholds, as suggested by BABAR data [3], and the result of our theoretical analysis, to be discussed in the next sections, are shown in Fig. 1. The figure also depicts the non-interfering background, as well as the non-resonant contribution (solid grey curve). Threshold positions of the , , , , and channels are depicted by vertical solid lines in Fig. 1. Furthermore, the central masses of the , , and resonances are indicated.
2 The (10580) enhancement
From combined data, published by the BABAR Collaboration in Refs. [5, 3], we observed in Ref. [6] that for the enhancement just above the threshold a description in terms of a wave function with a dominant component is more adequate than assuming a pole in the scattering amplitude due to a supposed underlying state. Consequently, we are convinced that it does not represent the resonance, for the following reasons.
It is generally assumed that decay takes place via the creation of a light quark pair, or , in the system. However, at the creation of such a pair, there are many possible two-meson configurations that can be formed. Only one of these has the right quantum numbers to develop into a meson pair. But even if quantum numbers are in agreement with the formation of a pair, this does not necessarily mean that this decay will take place. It will only happen if a stable and a stable can be formed. Ideally, that would be at threshold, without any kinetic energy involved. However, the mechanism prevents decay at threshold due to a centrifugal barrier, which, we believe, is the reason that the signal peaks above threshold.
At higher energies, a competition mechanism sets in between configurations that may lead to and other ones, such as (or . The latter configurations may develop pairs of almost stable mesons, when the invariant mass approaches the threshold, which will inevitably deplete the signal from . One clearly sees from the BABAR data (Fig. 1) that the signal drops to nearly zero at the threshold. Actually, the signal itself also drops to almost zero, namely at the threshold, for the same reason.
Threshold enhancements have been described within the framework of the Resonance-Spectrum Expansion (RSE) in Ref. [7], from first principles, and were further studied in Ref. [6]. In the latter paper, it was shown that in electron-positron annihilation the coupling to OZI-allowed two-meson decay channels increases from threshold, peaks somewhat higher, and then drops again very fast. Also, structures similar to the have been identified [6].
In this respect, an important observation was published by the BES Collaboration in Ref. [8]. To our knowledge, BES was the first to discover that the (3770) cross section is built up by two different amplitudes, viz. a relatively broad signal and a rather narrow resonance. For the narrow state, which probably corresponds to the well-established (3770), BES measured a central resonance position of 3781.01.30.5 MeV and a width of 19.33.10.1 MeV (their solution no. 2). If the latter parameters are indeed confirmed, it would be yet another observation of a resonance width very different from the world average (83.92.4 MeV [4] in this case), after a similar result had been obtained by BABAR in Ref. [3], for resonances. Concerning the broader charmonium structure, the BES Collaboration indicated, for their solution no. 2, a central resonance position of 3762.611.80.5 MeV and a width of 49.932.10.1 MeV. The signal significance for the new enhancement is 7.6 (solution no. 2).
In Ref. [6] the latter broad structure was explained as the threshold enhancement. However, in the situation is very different from what one finds in . The threshold at 3.739 GeV comes out, in the harmonic-oscillator approximation of the RSE (HORSE), just 50 MeV below the confinement level at 3.789 GeV (see Table 3), viz. for the degenerate - pair. These states get their physical masses, which are measured in experiment, due to the interaction generated by the meson loops. The poles associated with the resonances repel each other in such a way that one is subject to a small mass shift, whereas the other shifts considerably. The higher-mass pole, mostly , acquires a central resonance position that is only a few MeV below the confinement level, where it is found as the (3770) resonance, while the lower-mass pole, mostly , comes out below the threshold, as the (3686) bound state.
In one has two confinement levels that are near the threshold at 10.558 GeV (see Table 3), namely the degenerate couple - pair 10.493 GeV, and the degenerate couple – at 10.873 GeV. The former couple gives rise to the (10355) and bound states below the threshold, due to the attraction generated by the meson loops. Recently, in data of BABAR [9], possible indications were observed for the and states, viz. at the masses 100985 and 104925 MeV [10], respectively. Hence, the central mass of the comes out just 1 MeV below the confinement level. The latter state has its -matrix pole only about 60 MeV below the threshold. Hence, it will certainly have influence on the size of the enhancement at 10.580 GeV.
The degenerate couple - again produces two resonances, one of which will have its central mass close to the confinement level at 10.873 GeV. The obvious candidate is the (10865). The other one, viz. the , will be shifted towards lower energies by the meson loops. We will argue here that that this is not the (10580). Actually, it would be a huge coincidence if a resonance pole come out exactly midway between two important threshods, viz. and , and moreover with an imaginary part such that the resonance peak also fits perfectly between the two.
More than two decades ago, it seemed quite obvious that the large enhancement just above the threshold should be associated with the . Indeed, the relativized quark model of Godfrey and Isgur [11], the most successful of the typical Coulomb-plus-linear type quarkonium models, predicted the state at 10.63 GeV, so just 50 MeV too high. In view of the — in those days — unpredictable threshold effects of the open-bottom decay channels, that was a rather accurate prediction. However, in the following we will argue that the resonance comes out about 160 MeV higher, viz. at 10.735 GeV.
3 spectrum in analogy with
In the recent past, we have found possible evidence for several higher charmonium states [12, 13, 14, 15, 16]. Our results are summarized in Table 3. The masses in the first column of Table 3 (HO) are determined by
| (1) |
where now , while the charm quark mass ( GeV) and oscillator frequency ( GeV) are taken from Ref. [17]. The HORSE quenched and masses are degenerate. Unquenching the states by inserting the open-charm meson-meson loops [18, 19], also for bound states below the threshold, results in a closed-form multichannel scattering amplitude, capable of describing scattering as well as also production cross sections, and suitable for a numerical search of its poles.
| HO | ||
|---|---|---|
| 3.789 | 3.773 (1D [4]) | 3.686 (2S [4]) |
| 4.169 | 4.153 (2D [4]) | 4.039 (3S [4]) |
| 4.549 | 4.56 (3D [14, 13]) | 4.421 (4S [4]) |
| 4.929 | 4.89 (4D [12, 16]) | 4.81 (5S [12, 16]) |
| 5.309 | 5.29 (5D [14]) | 5.13 (6S [14]) |
| 5.689 | 5.66 (6D [15]) | 5.44 (7S [15]) |
| 6.069 | – (7D) | 5.91 (8S [15]) |
We find then that the bare states turn into bound states below the threshold, or resonances thereabove. The states (third column of Table 3) have central masses some 100 to 200 MeV below the unquenched levels, whereas the states (second column of Table 3) undergo mass shifts of only a few MeV. These mass shifts largely depend on the precise positions of the open-charm threshold. Results for ( GeV [17]), in Eq. (1) are given in Table 3.
| quenched | ||
|---|---|---|
| 10.113 | 10.098 (1D [10]) | 10.023 (2S [4]) |
| 10.493 | 10.492 (2D [10]) | 10.355 (3S [4]) |
| 10.873 | 10.865 (3D [4]) | 10.735 (4S [20]) |
| 11.253 | – (4D) | 11.019 (5S [4]) |
We observe a spectrum which is very similar to the spectrum of Table 3, just shifted towards higher masses by about 6.3 GeV. However, our particle assignments are somewhat different from what one finds in most of the literature.
The experimental identification of the resonance at 10.845 GeV (CUSB) or 10.868 GeV (CLEO), and the resonance at 11.02 GeV (CUSB) or 11.019 GeV (CLEO), with the and , respectively, was apparently inspired by the predictions of Godfrey and Isgur [11] for those states, at 10.88 GeV and 11.10 GeV, respectively. However, we rather identify these resonances rather with the and states, respectively, on the basis of the level schemes in Tables 3 and 3 [18, 17].
4 Our analysis of the BABAR data
The BABAR data in Ref. [3] concern the ratio for all annihilation processes containing quarks. Our description of the BABAR data (see Fig. 1) consists of three parts:
-
1.
A non-interfering background.
-
2.
Treshold enhancements interfering with the resonances.
-
3.
The , and resonances.
The non-interfering background accounts for those reactions that do not contain open-bottom pairs. For its value we take a similar amount as suggested by BABAR in their analysis of the heavier two resonances [3].
Nonresonant threshold enhancements, indicated by the solid grey curve in Fig. 1, are determined by several different factors; in the first place, by the amount of available competing configurations. Hence, the threshold enhancement is much less pronounced than the one for . Another factor is the average distance of the pair at which pair production takes place. A smaller average distance implies that the maximum of the enhancement occurs for higher relative momenta of the open-bottom decay products. This phenomenon one may observe for the enhancement at the threshold, because pair production takes place at smaller interquark distances than and pair production. In this case, the maximum is never reached, since before that production takes over, and similarly so at the threshold. At even higher invariant masses, several other open-bottom decays become energetically allowed, which then results in a slowly rising nonresonant contribution (also see the solid grey curve in Fig. 4c).
The three resonances , , and are parametrized by Breit-Wigner (BW) amplitudes, which, because of relation (1), are linear in mass, and not quadratic as in the standard relativistic expressions. As a consequence, we found in Ref. [20] small deviations for the resonance pole positions, as compared to the findings of the BABAR Collaboration.
The resonances interfere with the nonresonating threshold-enhancement contributions, but not with the non-interfering background. We showed in Ref. [20] that the phases of the interferences between the resonant signals and the nonresonating threshold-enhancement contributions can be fully determined in the HORSE, without any freedom.
a 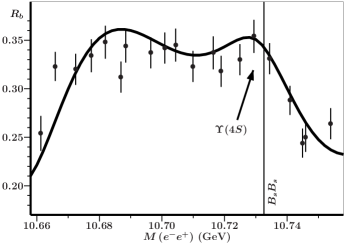
|
|---|
b 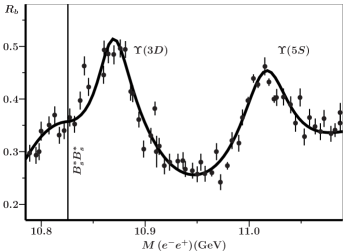
|
c 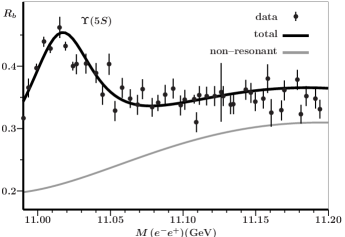
|
In Ref. [20], we found real and imaginary parts for the resonance pole positions of the (10860) and the (11020) in reasonable agreement with those obtained by BABAR (see Fig. 4b). However, we also found a resonant structure at 10.735 GeV, with a width of 38 MeV, which was not obtained in the BABAR analysis (see Fig. 4a). We associate the latter resonance with the (4S), as it also fits much more nicely in the level scheme of Table 3.
In Sect. 1, we mentioned a resonance at MeV, with a total hadronic width of MeV, observed by the CLEO Collaboration [2], which was classified as a presumable hybrid. Figure 4a clearly shows that also the BABAR data display an enhancement at that invariant mass. However, in our analysis its origin is the nonresonant threshold enhancement due to the channel, and not the presence of a resonance pole, as we will discuss in the following.
In Ref. [3], the BABAR Collaboration observed two plateaux in . The first one appears just below the , and is depicted in Fig. 4a. As shown through our theoretical curve, we do not associate the data with a plateau, but rather with the “back and shoulders” of an “elephant”. Also from Fig. 1 we seem to learn that neither the nonresonant contribution nor the resonance have a particularly flat behavior in the mass region delimited by the and thresholds. As for the nonresonant part, this mass interval constitutes a window for production, which signal in part carries the resonance. Furthermore, the tail of the resonance interferes with the nonresonant contribution, leading to the shallow dip in between the elephant’s back and shoulders.
However, the BABAR Collaboration also points at a second plateau, above the , which we have depicted in Fig. 4c. Here, we indeed observe a flat pattern for , which we assume to be the result of a slowly rising nonresonant contribution (solid grey curve) and the tail of the resonance.
5 Conclusions
Inspired by the level schemes of Tables 3 and 3, we have argued that the (4S) should be associated with the resonance at 10.735 GeV, rather than with the the large peak just above the threshold. The latter structure is, in our analysis, better described in terms of a wave function with a dominant component, enhanced by the nearby (2D) bound-state pole below the threshold. The vital role of the universal confinement frequency MeV in analysing hadronic data is once again supported by the results shown in Tables 3 and 3.
We are grateful for the precise measurements and data analyses of the BABAR Collaboration that made the present analysis possible. This work was supported in part by the Fundação para a Ciência e a Tecnologia of the Ministério da Ciência, Tecnologia e Ensino Superior of Portugal, under contract CERN/FP/83502/2008.
References
- 1 D. M. J. Lovelock et al. [CUSB Collaboration], Phys. Rev. Lett. 54, 377 (1985).
- 2 D. Besson et al. [CLEO Collaboration], Phys. Rev. Lett. 54, 381 (1985).
- 3 B. Aubert [BaBar Collaboration], Phys. Rev. Lett. 102, 012001 (2009).
- 4 K. Nakamura et al. [Particle Data Group Collaboration], J. Phys. G 37, 075021 (2010).
- 5 B. Aubert [BaBar Collaboration], Phys. Rev. D 72, 032005 (2005).
- 6 E. van Beveren and G. Rupp, Phys. Rev. D 80, 074001 (2009).
- 7 E. van Beveren and G. Rupp, Ann. Phys. 323, 1215 (2008).
- 8 S. K. Choi et al. [Belle Collaboration], Phys. Rev. Lett. 91, 262001 (2003).
- 9 B. Aubert et al. [BABAR Collaboration], Phys. Rev. D 78, 112002 (2008).
- 10 E. van Beveren and G. Rupp, arXiv:1009.4097.
- 11 S. Godfrey and N. Isgur, Phys. Rev. D 32, 189 (1985).
- 12 E. van Beveren, X. Liu, R. Coimbra, and G. Rupp, Europhys. Lett. 85, 61002 (2009).
- 13 E. van Beveren, G. Rupp and J. Segovia, Phys. Rev. Lett. 105, 102001 (2010).
- 14 E. van Beveren and G. Rupp, arXiv:0904.4351.
- 15 E. van Beveren and G. Rupp, arXiv:1004.4368.
- 16 E. van Beveren and G. Rupp, arXiv:1005.3490.
- 17 E. van Beveren, G. Rupp, T. A. Rijken, and C. Dullemond, Phys. Rev. D 27, 1527 (1983).
- 18 E. van Beveren, C. Dullemond, and G. Rupp, Phys. Rev. D 21, 772 (1980) [Erratum-ibid. D 22, 787 (1980)].
- 19 E. van Beveren and G. Rupp, chapter 4 in New Topics in Theoretical Physics, Horizons in World Physics, Vol. 258, pp 47-74 (2007), Edited by H. F. Arnoldus, T. F. George, Nova Science Publishers, ISBN 1600213553, 9781600213557.
- 20 E. van Beveren and G. Rupp, arXiv:0910.0967.