A CATALOG OF CH3OH MASER SOURCES IN MASSIVE STAR-FORMING REGIONS. II. MASERS IN NGC 6334F, G8.670.36, AND M17
Abstract
We present Very Large Array observations of the methanol maser transition at 44 GHz towards NGC 6334F, G8.670.36, and M17. These arcsecond resolution observations complete a previous, larger VLA survey of this maser transition in high-mass star-forming regions reported by Kurtz et al. We confirm the presence of 44 GHz methanol maser emission in all three sources, detecting eight distinct maser components in NGC 6334F, twelve components in G8.670.36 and one in M17.
1 Introduction
Maser emission from various molecular species is a well-established signpost of massive star formation. Masers of the hydroxyl (OH), water (H2O), and methanol (CH3OH) molecules are particularly prevalent, and numerous studies of these masers in star formation regions exist in the literature; see Fish (2007) for a recent review.
Methanol masers have sometimes proven difficult to interpret, yet they have also been fruitful tracers of phenomena within star formation regions (Ellingsen 2005, 2006). They appear in two distinct classes (I and II) which differ in their pumping mechanisms (Cragg et al. 1992; Menten 1991a, b) and, correspondingly, their locations within the star forming regions. Collisionally pumped class I masers are thought to be tracers of shocked gas and hence frequently of molecular outflows (e.g., Araya et al. 2010; Voronkov et al. 2010; Araya et al. 2009; Plambeck & Menten 1990). Class II masers — found in closer proximity to young stellar objects and pumped by their mid-infrared emission — show a variety of structures, including linear (Minier et al. 2000) and ring-like (Bartkiewicz et al. 2009) that provide information on the gas dynamics very close to the young stellar object (Moscadelli et al. 2002).
Methanol masers also have significant potential as tracers of magnetic field morphology and strength via their linear polarization (Wiesemeyer et al. 2004) and via the Zeeman effect. Zeeman splitting has been reported for both class I masers (Sarma & Momjian 2009) and class II masers (Vlemmings 2008; Surcis et al. 2009). Owing to their locations within the star-forming regions, class I masers should be better tracers of the magnetic field within the molecular core or clump, while class II masers should be better tracers of the circum-protostellar magnetic field.
Quite apart from their intrinsic scientific interest, masers also serve a valuable practical role by permitting the use of a cross-calibration technique first described by Reid & Menten (1990); see also the Appendix of Reid & Menten (1997). The lack of nearby phase calibrators is a significant problem for high frequency, high spatial resolution radio observations. When sufficiently strong masers are present within the field of view, they permit self-calibration on very short time scales. This can substantially alleviate the problems caused by the dearth of high frequency calibrators. Araya et al. (2009), for example, have used this technique with 44 GHz methanol masers to obtain high resolution 7 mm continuum images of the DR21(OH) massive star formation region.
Kurtz, Hofner, & Vargas-Álvarez (2004; hereafter KHV04) presented an arc-second resolution survey of 44 massive star formation regions in the 44 GHz class I CH3OH maser line. At the time of their observations, less than half of the 27 Very Large Array (VLA) antennas were equipped with Q-band (40-50 GHz) receivers. The relatively poor uv coverage that resulted proved problematic for imaging the fields observed, and for three sources — NGC 6334F, G8.670.36, and M17 — they were unable to uniquely determine the maser positions, although maser emission was clearly present. More recently, the Max-Planck Institut für Radioastronomie equipped the remaining VLA antennas with Q-band receivers, thus mitigating the uv coverage problems that plagued the KHV04 survey.
The goal of the present project is to complete the KHV04 survey by providing accurate positions and line parameters for the 44 GHz masers in NGC 6334F, G8.670.36, and M17. In Sect. 2 we describe the observations and the data reduction procedures. In Sect. 3 we present our results, and in Sect. 4 we provide a more detailed discussion of each source. A brief summary is given in Sect. 5.
2 Observations and Data Reduction
2.1 Very Large Array
NGC 6334F, G8.670.36, and M17 were observed with the Very Large Array (VLA) of the NRAO111The National Radio Astronomy Observatory is operated by Associated Universities Inc. under cooperative agreement with the National Science Foundation. on 2005 November 5. We observed the methanol maser transition with a rest frequency of 44 069.43 MHz. The array was in the D configuration, which provides an angular resolution of about 2 at 44 GHz (7 mm). The actual resolution depends on uv coverage, which varies from source-to-source; the precise resolution for each source is listed in Table 1. The absolute amplitude calibrator was J1331+305 (3C286) with an adopted flux density of 1.434 Jy at 44 069.43 MHz. The phase calibrators were J1700261 and J1733130 with bootstrapped flux densities of 0.710.03 Jy and 2.470.05 Jy, respectively.
We observed the right-hand circular polarization, using one IF and a 3.125 MHz (21 km s-1) bandwidth, providing 127 spectral line channels that were Hanning-smoothed on-line. The 24.4 kHz channel widths correspond to 0.17 km s-1. Referenced pointing was performed on the phase calibrators prior to observing the program sources. We observed in the fast-switching mode with 160-second cycles.
The data were edited, calibrated and imaged using standard procedures of the Astronomical Image Processing System (AIPS) of NRAO. After the initial external calibration, each source was imaged and inspected for maser emission. The brightest maser component was identified and the peak channel was self-calibrated, first in phase, and then a second iteration in phase and amplitude. These self-calibration solutions were applied to all channels, which were then imaged using weights intermediate between natural and uniform (with the ROBUST parameter set to 0) and CLEANed in an iterative fashion. For the initial iteration, clean boxes were assigned only to the strongest masers; for subsequent iterations additional clean boxes were added, as weaker masers became visible. A final image cube was made for each source, with clean boxes for all identified maser components, and CLEANed to a level of twice the theoretical rms.
The maser parameters (see Table 2) were extracted from the final image cubes using the AIPS tasks JMFIT, IMSTAT and ISPEC. The absolute flux calibration uncertainty is and we estimate the absolute positional uncertainty to be for all the masers, although the uncertainty of the Gaussian fit of stronger masers is smaller (Reid et al. 1988).”
2.2 Spitzer Space Telescope
3 Results
We confirm the presence of 44 GHz CH3OH maser emission in all three sources, detecting eight distinct maser components in NGC 6334F, twelve masers in G8.670.36 and one maser in M17.
The observed parameters of all detected masers are listed in Table 2. Column (1) gives the source name, while columns (2) and (3) give the J2000 peak position, determined from a two-dimensional Gaussian fit to the peak channel. Column (4) gives the peak flux density, also from the Gaussian fit. Column (5) gives the LSR-velocity of the peak channel, while column (6) provides the the FWZI (full width at zero intensity) at the 3 level. If multiple velocity components at the same sky position are present then we report the full velocity range, even if some intermediate channels fall below the 3 level. Column (7) gives the integrated line flux, calculated as Si Vi summed over channels above the 3 level.
4 Discussion of Individual Sources
4.1 NGC 6334F
NGC 6334F is a well-known UC HII region, lying within the NGC 6334 cloud complex, at a distance of 1.7 kpc (Neckel 1978). It is also known as NGC 6334I, where “I” is a roman numeral “one”, originating from far-infrared studies (e.g., Gezari 1982). We adopt the convention of Rodríguez et al. (1982), in which the letter “F” refers to the UC HII region.
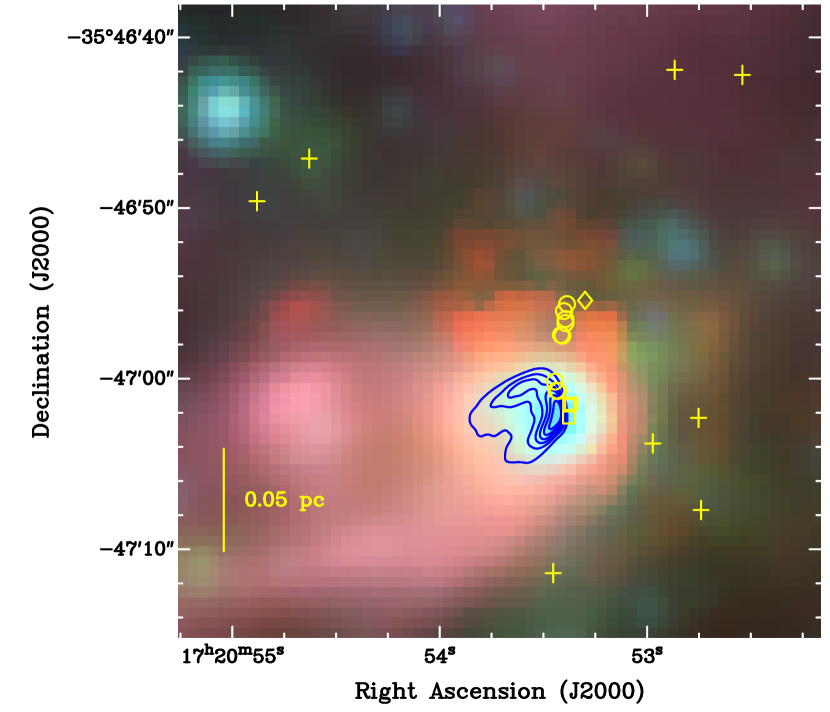
The eight 44 GHz class I masers detected within the one arcminute VLA primary beam indicate a higher level of maser activity than the majority of the sources in the KHV04 survey, which has a median of four maser features per field. Figure 1 shows the three-color Spitzer/GLIMPSE image of NGC 6434F and the location of the maser components. The eight masers are distributed over an area 0.25 pc 0.25 pc. As is typical for class I masers, these eight components do not appear to be associated with the UC HII region, other masers, or the IR emission. Nor do they coincide with thermal ammonia peaks or ammonia masers as reported by Beuther et al. (2005, 2007) or with the millimeter peaks reported by Hunter et al. (2006). The average projected distance from the masers to the geometric center of the UC HII region is 0.12 pc.
Neglecting the two northern-most masers, there is a southwest to northeast positional orientation of the remaining six masers. This orientation corresponds to the blue-shifted (southwest) and red-shifted (northeast) high velocity outflow mapped with the APEX 12 m telescope by Leurini et al. (2006). There is a weak tendency in the maser velocity structure in accordance with this pattern: the average velocity of the southwestern masers is km s-1 while the average for the northeastern masers is km s-1. We suggest that these six masers are related to the bipolar outflow reported by Leurini et al. (2006). We caution, however, that the trends in both position and velocity are not particularly strong.
4.2 G8.670.36
The UC HII region G8.670.36, at a distance of 4.8 kpc (Fish et al. 2003), was classified by Wood & Churchwell (1989) as having a core-halo morphology; i.e., a single compact peak surrounded by an extended, low-surface-brightness halo.
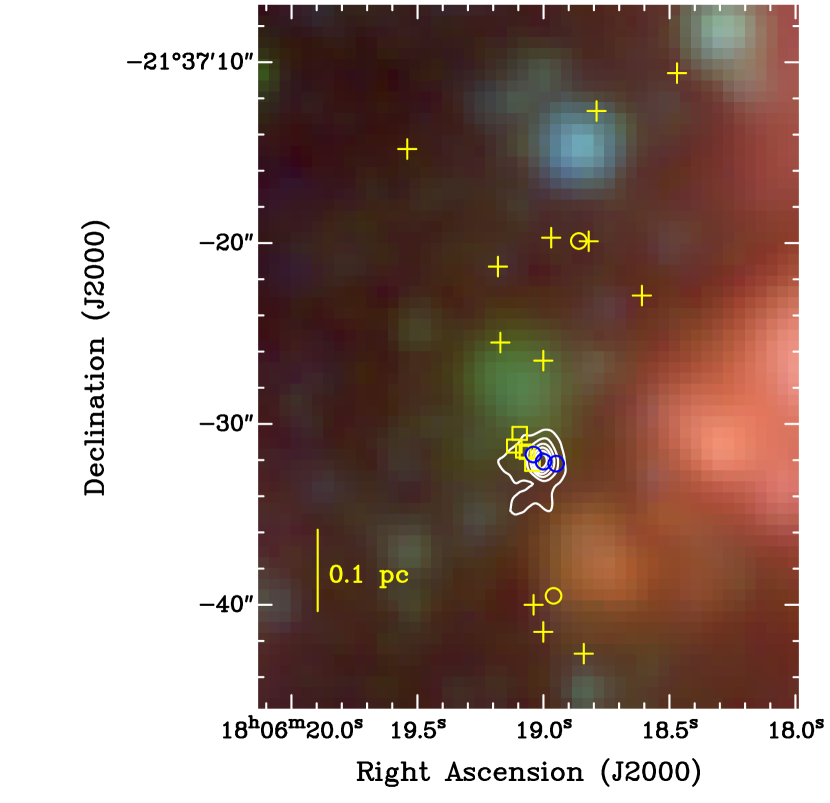
As in NGC 6334F, the relatively large number of masers detected in this field (12) indicates an unusually high level of maser activity. We identify two regions of maser activity in the field (see Fig. 2): one to the north and the other to the south of the UC HII region. No velocity trend with respect to position is seen. The strongest two masers in this field lie at the edge of an Extended Green Object (EGO; Cyganowski et al. 2008), consistent with the idea that EGOs trace molecular outflows from MYSOs and that class I methanol masers arise from the interaction of outflows with dense clumps of gas (Plambeck & Menten 1990). Cyganowski et al. (2008) did not catalog the G8.670.36 region because it lies outside their survey area ( and ). Although eight of the twelve masers lie at the edge of some infrared feature, four of the masers appear relatively isolated from the infrared emission; hence our data do not suggest a unique correlation of these masers with a particular set of gas conditions.
KHV04 report maser emission at from 33 to 37 km s-1, which is in close agreement with the velocity of HCO+ and H13CO+ emission (34.8 km s-1; Purcell et al. 2006). We detect maser emission in a velocity range of 33.6–39.9 km s-1.
The average projected distance from the masers to the geometric center of the UC HII region is 0.29 pc.
4.3 M17
The M17 region hosts, among other features, the cometary UC HII region UC-1 (e.g., Felli et al. 1980; Johnson et al. 1998). Distances reported for the M17 nebula have ranged from 2.2 kpc (Chini et al. 1980) to 1.3 kpc (Hanson et al. 1997). More recently, a distance of 1.6 kpc has been reported by Nielbock et al. (2001), which we adopt here.
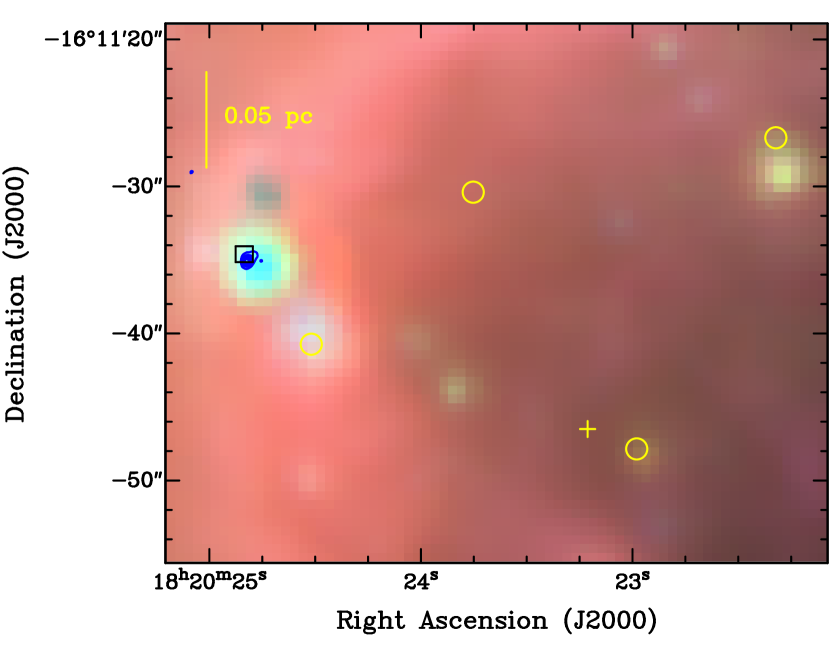
Unlike the previous two sources, M17 presents very limited 44 GHz maser activity with only a single maser component detected in the field, at a projected distance of 0.2 pc from the UC HII region (see Fig. 3). The maser properties are listed in Table 2; the 19.1 km s-1 velocity that we find is the same as found by KHV04.
5 Summary
Using the Very Large Array, we have observed 44 GHz class I methanol maser emission in the massive star-forming regions NGC 6334F, G8.670.36, and M17. Our principal result is to provide accurate maser positions and parameters, thus completing the catalog of KHV04.
In addition, we find that: (1) Two of the sources (NGC 6334F and G8.670.36) show significantly higher levels of maser activity than the typical survey source. (2) For all three sources the masers are well-separated from the HII region, with projected distances ranging from 0.1 to 0.3 pc. This is in good agreement with the KHV04 survey, which found a median separation of 0.2 pc for a subsample of 22 sources that had both HII regions and maser emission.
References
- Araya et al. (2010) Araya, E. D., Hofner, P., Goss, W. M., Kurtz, S., Richards, A. M. S., Linz, H., Olmi, L., & Sewiło, M. 2010, ApJ, 717, L133
- Araya et al. (2009) Araya, E. D., Kurtz, S., Hofner, P., & Linz, H. 2009, ApJ, 698, 1321
- Bartkiewicz et al. (2009) Bartkiewicz, A., Szymczak, M., van Langevelde, H. J., Richards, A. M. S., & Pihlström, Y. M. 2009, A&A, 502, 155
- Benjamin et al. (2003) Benjamin, R. A., et al. 2003, PASP, 115, 953
- Beuther et al. (2005) Beuther, H., Thorwirth, S., Zhang, Q., Hunter, T. R., Megeath, S. T., Walsh, A. J., & Menten, K. M. 2005, ApJ, 627, 834
- Beuther et al. (2007) Beuther, H., Walsh, A. J., Thorwirth, S., Zhang, Q., Hunter, T. R., Megeath, S. T., & Menten, K. M. 2007, A&A, 466, 989
- Brogan & Troland (2001) Brogan, C. L., & Troland, T. H. 2001, ApJ, 560, 821
- Brooks & Whiteoak (2001) Brooks, K. J., & Whiteoak, J. B. 2001, MNRAS, 320, 465
- Carral et al. (2002) Carral, P., Kurtz, S. E., Rodríguez, L. F., Menten, K., Cantó, J., & Arceo, R. 2002, AJ, 123, 2574
- Chini et al. (1980) Chini, R., Elsaesser, H., & Neckel, T. 1980, A&A, 91, 186
- Cragg et al. (1992) Cragg, D. M., Johns, K. P., Godfrey, P. D., & Brown, R. D. 1992, MNRAS, 259, 203
- Cyganowski et al. (2008) Cyganowski, C. J., et al. 2008, AJ, 136, 2391
- Ellingsen (2005) Ellingsen, S. P. 2005, MNRAS, 359, 1498
- Ellingsen (2006) —. 2006, ApJ, 638, 241
- Fazio et al. (2004) Fazio, G. G., et al. 2004, ApJS, 154, 10
- Felli et al. (1980) Felli, M., Johnston, K. J., & Churchwell, E. 1980, ApJ, 242, L157
- Fish (2007) Fish, V. L. 2007, in IAU Symposium, Vol. 242, IAU Symposium, ed. J. M. Chapman & W. A. Baan, 71–80
- Fish et al. (2003) Fish, V. L., Reid, M. J., Wilner, D. J., & Churchwell, E. 2003, ApJ, 587, 701
- Forster & Caswell (1989) Forster, J. R., & Caswell, J. L. 1989, A&A, 213, 339
- Gezari (1982) Gezari, D. Y. 1982, ApJ, 259, L29
- Hanson et al. (1997) Hanson, M. M., Howarth, I. D., & Conti, P. S. 1997, ApJ, 489, 698
- Hofner & Churchwell (1996) Hofner, P., & Churchwell, E. 1996, A&AS, 120, 283
- Hunter et al. (2006) Hunter, T. R., Brogan, C. L., Megeath, S. T., Menten, K. M., Beuther, H., & Thorwirth, S. 2006, ApJ, 649, 888
- Johnson et al. (1998) Johnson, C. O., De Pree, C. G., & Goss, W. M. 1998, ApJ, 500, 302
- Kurtz et al. (2004) Kurtz, S., Hofner, P., & Vargas-Álvarez, C. 2004, ApJS, 155, 149
- Leurini et al. (2006) Leurini, S., Schilke, P., Parise, B., Wyrowski, F., Güsten, R., & Philipp, S. 2006, A&A, 454, L83
- Menten (1991a) Menten, K. 1991a, in Astronomical Society of the Pacific Conference Series, Vol. 16, Atoms, Ions and Molecules: New Results in Spectral Line Astrophysics, ed. A. D. Haschick & P. T. P. Ho, 119
- Menten (1991b) Menten, K. M. 1991b, ApJ, 380, L75
- Minier et al. (2000) Minier, V., Booth, R. S., & Conway, J. E. 2000, A&A, 362, 1093
- Moscadelli et al. (2002) Moscadelli, L., Menten, K. M., Walmsley, C. M., & Reid, M. J. 2002, ApJ, 564, 813
- Neckel (1978) Neckel, T. 1978, A&A, 69, 51
- Nielbock et al. (2001) Nielbock, M., Chini, R., Jütte, M., & Manthey, E. 2001, A&A, 377, 273
- Plambeck & Menten (1990) Plambeck, R. L., & Menten, K. M. 1990, ApJ, 364, 555
- Purcell et al. (2006) Purcell, C. R., et al. 2006, MNRAS, 367, 553
- Reid & Menten (1990) Reid, M. J., & Menten, K. M. 1990, ApJ, 360, L51
- Reid & Menten (1997) —. 1997, ApJ, 476, 327
- Reid et al. (1988) Reid, M. J., Schneps, M. H., Moran, J. M., Gwinn, C. R., Genzel, R., Downes, D., & Roennaeng, B. 1988, ApJ, 330, 809
- Rodríguez et al. (1982) Rodríguez, L. F., Cantó, J., & Moran, J. M. 1982, ApJ, 255, 103
- Sarma & Momjian (2009) Sarma, A. P., & Momjian, E. 2009, ApJ, 705, L176
- Slysh et al. (1994) Slysh, V. I., Kalenskii, S. V., Valtts, I. E., & Otrupcek, R. 1994, MNRAS, 268, 464
- Surcis et al. (2009) Surcis, G., Vlemmings, W. H. T., Dodson, R., & van Langevelde, H. J. 2009, A&A, 506, 757
- Vlemmings (2008) Vlemmings, W. H. T. 2008, A&A, 484, 773
- Voronkov et al. (2010) Voronkov, M. A., Caswell, J. L., Britton, T. R., Green, J. A., Sobolev, A. M., & Ellingsen, S. P. 2010, MNRAS, 979
- Wiesemeyer et al. (2004) Wiesemeyer, H., Thum, C., & Walmsley, C. M. 2004, A&A, 428, 479
- Wood & Churchwell (1989) Wood, D. O. S., & Churchwell, E. 1989, ApJS, 69, 831
| Source | Pointing CenteraaUnits of right ascension are hours, minutes, and seconds, and units of declination are degrees, arcminutes, and arcseconds. | Central Velocity | Synthesized BeambbMajor axis minor axis; position angle of major axis. | Channel Map rms | |
|---|---|---|---|---|---|
| R.A.(J2000) | Dec(J2000) | (km s-1) | (mJy beam-1) | ||
| NGC 6334F | 17 20 54.00 | 47 00.0 | ; | 45 | |
| G8.670.36 | 18 06 19.20 | 37 30.0 | ; | 40 | |
| M17 | 18 20 24.40 | 11 32.0 | ; | 47 | |
| Source | Maser Peak PositionaaUnits of right ascension are hours, minutes, and seconds, and units of declination are degrees, arcminutes, and arcseconds. | VLSR | VbbA single number indicates the line width for . Two numbers indicates the velocity range when a single sky position has multiple components, even if some intermediate channels fall below 3. | |||
| R.A. (J2000) | Decl. (J2000) | (Jy) | (km s-1) | (km s-1) | (Jy km s-1) | |
| (1) | (2) | (3) | (4) | (5) | (6) | (7) |
| NGC 6334F | 17 20 52.54 | 46 42.2 | 1.3 | 1.5 | 1.1 | |
| 17 20 52.74 | 47 07.7 | 1.2 | to | 1.0 | ||
| 17 20 52.75 | 47 02.3 | 5.9 | 1.3 | 4.1 | ||
| 17 20 52.87 | 46 41.9 | 1.5 | to | 1.1 | ||
| 17 20 52.97 | 47 03.8 | 2.9 | to | 2.7 | ||
| 17 20 53.45 | 47 11.4 | 0.7 | 1.7 | 0.6 | ||
| 17 20 54.63 | 46 47.1 | 9.4 | to | 12.6 | ||
| 17 20 54.88 | 46 49.6 | 2.8 | 1.2 | 1.1 | ||
| G8.670.36 | 18 06 18.47 | 37 10.6 | 0.4 | 37.9 | 0.5 | 0.1 |
| 18 06 18.61 | 37 22.9 | 1.9 | 38.1 | 0.7 | 0.7 | |
| 18 06 18.79 | 37 12.7 | 1.3 | 37.7 | 1.3 | 0.9 | |
| 18 06 18.82 | 37 19.9 | 1.3 | 38.7 | 36.9 to 39.9 | 0.8 | |
| 18 06 18.84 | 37 42.7 | 1.4 | 34.8 | 1.2 | 0.7 | |
| 18 06 18.97 | 37 19.7 | 6.2 | 37.6 | 36.9 to 38.7 | 4.2 | |
| 18 06 19.00 | 37 41.5 | 7.9 | 35.1 | 1.3ccThese two masers are spatially blended; V and are approximate values. | 5.3ccThese two masers are spatially blended; V and are approximate values. | |
| 18 06 19.00 | 37 26.5 | 16.5 | 35.4 | 34.1 to 38.2 | 21.1 | |
| 18 06 19.04 | 37 40.0 | 9.3 | 33.6 | 1.8ccThese two masers are spatially blended; V and are approximate values. | 9.6ccThese two masers are spatially blended; V and are approximate values. | |
| 18 06 19.17 | 37 25.5 | 18.2 | 35.9 | 2.5 | 13.2 | |
| 18 06 19.18 | 37 21.3 | 1.4 | 33.8 | 2.2 | 1.1 | |
| 18 06 19.54 | 37 14.8 | 0.9 | 36.4 | 35.0 to 36.9 | 0.7 | |
| M17 | 18 20 23.21 | 16 11 46.5 | 9.0 | 19.1 | 0.7 | 0.5 |