An optical spectroscopic survey of the 3CR sample of radio galaxies with .
We present optical nuclear spectra for nine 3CR radio sources obtained with the Telescopio Nazionale Galileo, that complete our spectroscopic observations of the sample up to redshifts 0.3. We measure emission line luminosities and ratios, and derive a spectroscopic classification for these sources.
Key Words.:
galaxies: active, galaxies: jets, galaxies: elliptical and lenticular, cD, galaxies: nuclei1 Introduction
The 3CR catalog of radio sources represents a particularly well suited sample for a study of the physics of radio-loud AGN. Its selection criteria are unbiased with respect to optical properties and orientation, and it spans a relatively wide range in redshift and radio power. A vast suite of observations is already available for this sample, from multi-band HST imaging, to observations with Chandra, Spitzer and the VLA.
Quite surprisingly, however, the available optical spectroscopic data for the 3CR sample were sparse and incomplete. To fill this gap, we carried out a homogeneous and complete survey of optical spectroscopy, targeting the subsample of 113 3CR radio sources with z0.3, for which we can obtain uniform uninterrupted coverage of the key spectroscopic optical diagnostics. The observed sources include a significant number of powerful classical FR II RG, as well as the more common (at low redshift) FR Is (Fanaroff & Riley, 1974), spanning four orders of magnitude in radio luminosity, thus providing a broad representation of the spectroscopic properties of radio-loud AGN. The data were presented in Buttiglione et al. (2009) (hereafter Paper I) and discussed in Buttiglione et al. (2010) (hereafter Paper II).
However, nine sources of our sample (namely 3C 020, 3C 063, 3C 132, 3C 288, 3C 346, 3C 349, 3C 403.1, 3C 410, 3C 458) could not be observed due to scheduling problems and time constraints. Furthermore, the SDSS spectrum of 3C 270 presented in Paper I could not be used for its spectroscopic characterization, since the fiber was not positioned on the galaxy’s nucleus (Christian Leipski, private communication). In order to reach completeness of the spectroscopic survey we present the results of new TNG observations of nine missing sources, while we complemented our data with those obtained for 3C 270 by Ho et al. (1997).
The paper is organized as follows: in Sect. 2 we present the observational procedure and the data reduction, leading to the measurements of the emission line fluxes (Sect. 3). In Sect. 4 we derive a spectroscopic classification for these sources, updating the results derived in Paper II. A brief summary is given in Sect. 5.
Throughout, we have used km s-1 Mpc-1, and .
2 Observations and data reduction
The optical spectra of the nine missing 3CR sources were taken with the Telescopio Nazionale Galileo (TNG), a 3.58 m telescope located on the Roque de los Muchachos in La Palma Canary Island (Spain). The observations were made with the DOLORES (Device Optimized for the LOw RESolution) spectrograph. The detector used is a 2100x2100 pixels back-illuminated E2V4240, with a pixel size of 0252. The observations were carried out in service mode between September 2008 and July 2009. The chosen
long-slit width is 2 and it was aligned along the parallactic angle in order to minimize light losses due to atmospheric dispersion.
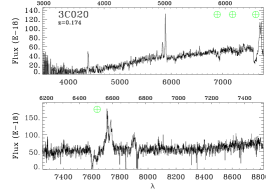
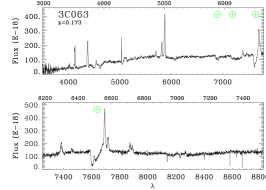
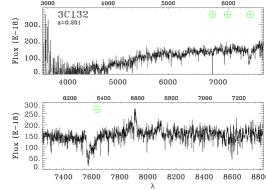
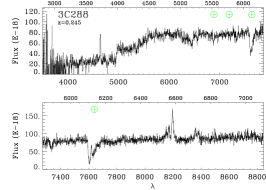
For each target we took one (or two) low resolution spectrum with the LR-B grism (3500-7700 Å) with a resolution of 20 Å and two high resolution spectra with the VHR-R (6100-7700 Å) or VHR-I (7250-8800 Å) grisms, depending on redshift, with a resolution of 5 Å. The exposure times increase with redshift, in order to compensate for the galaxies’ dimming. Exposures longer than 750 s were divided into two sub-exposures of 500 sec, obtained moving the target along the slit. The high resolution spectra have an exposure time twice the low resolution ones. The combination of the LR-B and VHR ranges of wavelengths enables us to cover the most prominent emission lines of the optical spectrum and in particular the key diagnostic lines H, [O III]4959,5007, [O I]6300,64, H, [N II]6548,84, [S II]6716,31. The high resolution spectra are a sort of zoom on the H region with the aim of resolving the H from the [N II] doublet, as well as the two lines of the [S II] doublet. Table LABEL:logoss provides the journal of observations and the main information on the sources.
The data analysis was performed as describer in Paper I, which should be refer to for further details. Summarizing the spectra were bias subtracted and flat fielded. When the spectra were split into two sub-exposures, they were subtracted to remove the sky background. The residual background was subtracted measuring the average on each pixel along the dispersion direction in spatial regions immediately surrounding the source spectrum. The data were then wavelength calibrated and corrected for optical distortions. Finally the spectra were extracted and summed over a region of 2 along the spatial direction and flux calibrated using spectrophotometric standard stars, observed immediately after each target.
The telluric absorption bands were usually left uncorrected except in the few cases in which an emission line of interest fell into these bands. In these cases we corrected the atmospheric absorptions using the associated standard stars as templates.
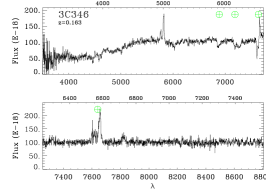
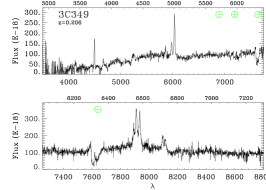
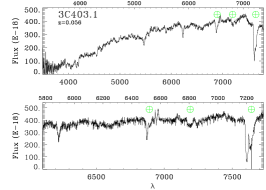
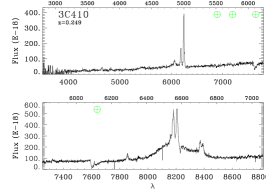
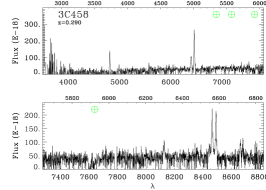
Fig. 1 shows, for all the observed targets, the low resolution spectrum (upper image) and the high resolution one (bottom image). The calibrated spectra are in units of erg cm-2 s-1 Å-1. The wavelengths (in Å units) are in the observer frame in the axes below the images while they are in the source frame in the axes above them.
3 Data analysis
We corrected the spectra for reddening due to the Galaxy (Burstein & Heiles, 1982, 1984) using the extinction law of Cardelli et al. (1989). The galactic extinction used for each object was taken from the NASA Extragalactic Database (NED) database and is listed in Table LABEL:bigtable. We also transform the spectra into rest frame wavelengths using the value of redshift from NED.
The contribution of stars to our spectra was subtracted using the best fit single stellar population (SSP) model taken from the Bruzual & Charlot (2003) library out of a grid of 33 single stellar population models, with a Salpeter Initial Mass Function, formed in an instantaneous burst. We excluded from the fit the spectral regions corresponding to emission lines, as well as other regions affected by telluric absorption, cosmic rays or other impurities. In 3C 410 the continuum is essentially featureless and it is likely to be dominated by non-stellar emission, a characteristic already seen in several 3CR objects. No starlight subtraction was performed for this object.
By using the specfit package in IRAF, we then measured line intensities fitting Gaussian profiles to H, [O III]4959,5007, [O I]6300,64, H, [N II]6548,84, and [S II]6716,31. Some constraints were adopted to reduce the number of free parameters: we required the widths and the velocity to be the same for all the lines. The integrated fluxes of each line were free to vary except for those with known ratios from atomic physics: i.e. the [O I]6300,64, [O III]4959,5007 and [N II]6548,84 doublets. Prominent broad H and H lines are visible in the spectrum of 3C 410. We then fit the line emission including a broad component. This is well reproduced by a gaussian profile, when allowing a small line asymmetry.
Table LABEL:bigtable summarizes the intensities of the main emission lines (de-reddened for Galactic absorption) relative to the intensity of the narrow component of H, for which we give flux and luminosity. To each line we associated its relative error, as a percentage. We placed upper limits at a 3 level to the undetected, but diagnostically important, emission lines by measuring the noise level in the regions surrounding the expected positions of the lines, and adopting as line width the instrumental resolution. In the case of 3C 346 the telluric correction is not sufficiently accurate to recover the flux of its H line, that falls in a deep transmission through of a telluric band. For 3C 410 we also give the flux of its broad H line.
4 Results
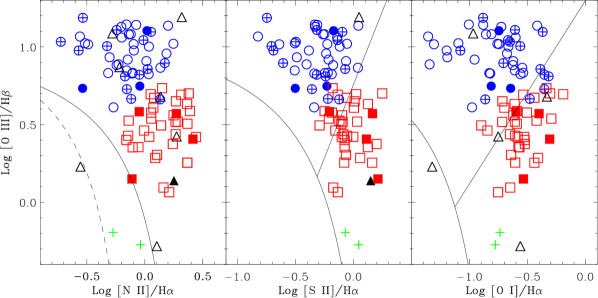
The data quality of the nine spectra considered here is such that we could measure all diagnostic lines with only three exceptions: [O I] in 3C 132, H in 3C 346 due to a telluric band, and H in 3C 458. We complemented our observations with the data for 3C 270 from Ho et al. (1997) that were obtained using a similar extraction aperture and spectral resolution. Following Paper II we used the Excitation Index (E.I.), defined as
E.I. = Log [O III]/H - 1/3 (Log [N II]H+ Log [S II]H+ Log [O I]H)
to derive an optical spectroscopic classification of the eight sources where all six diagnostic lines could be measured. Defining as LEG the sources with E.I. 0.95, four of them are LEG and four are HEG (see Table 3). For 3C 132 we lack the measurement of its [O I] line; however, this source is located well within the region of LEG in the diagnostic diagrams, see Fig. 2, where it is represented by the filled triangle. Conversely, 3C 346, without a H flux estimate, could not be classified based on the emission line ratios; similarly we cannot derive a classification from the diagrams comparing lines and radio luminosity since its location in Fig. 3 (the filled triangle in the left panel) is between the relations defined by LEG and HEG. Instead 3C 458 can be defined as HEG, although the H line cannot be measured, from the lower limit (E.I. ) derived for this source.
Including 3C 410 there are now 19 3CR radio-galaxies with broad lines. In agreement with our previous findings, also 3C 410 is a HEG from the point of view of its narrow line ratios. The four newly discovered HEG are of high total
| Name | Coordinates J2000 | z | Obs. Date | Low Res. | High Res. | Notes | ||||
| n | Texp | HR | n | Texp | ||||||
| 3C 020 | 00 43 09.27 | +52 03 36.66 | 0.174 | 22Sep08 | 1 | 750 | HRI | 2 | 750 | |
| 3C 063 | 02 20 53.82 | –01 57 54.08 | 0.175 | 23Sep08 | 1 | 750 | HRI | 2 | 750 | |
| 3C 132 | 04 56 43.40 | +22 49 21.62 | 0.214 | 23Oct08 | 2 | 500 | HRI | 2 | 1000 | |
| 3C 288 | 13 38 50.00 | +38 51 10.70 | 0.246 | 18Jan09 | 2 | 500 | HRI | 2 | 1000 | |
| 3C 346 | 16 43 48.69 | +17 15 48.09 | 0.161 | 01Sep08 | 1 | 750 | HRI | 2 | 750 | i |
| 3C 349 | 16 59 28.84 | +47 02 56.80 | 0.205 | 30Aug08 | 2 | 500 | HRI | 2 | 1000 | |
| 3C 403.1 | 19 52 30.58 | –01 17 19.68 | 0.055 | 22Sep08 | 1 | 500 | HRR | 2 | 500 | |
| 3C 410 | 20 20 06.56 | +29 42 14.20 | 0.249 | 23Sep08 | 2 | 500 | HRI | 2 | 1000 | f,g |
| 3C 458 | 23 12 54.40 | +05 16 46.00 | 0.289 | 29Lug09 | 2 | 500 | HRI | 2 | 1000 | |
Column description: (1) 3C name of the source; (2) and (3) J2000 coordinates (right ascension and declination); (4) redshift; (5) UT night of observation; (6) number of low resolution spectra; (7) exposure time for each low resolution spectrum; (8) high resolution grism used; (9) number of high resolution spectra; (10) exposure time for each high resolution spectrum. (11): (f) broad components; (g) no starlight subtraction; (i) telluric correction.
| Name | Redshift | E(B-V) | L(H) | F(H) | H | [O III]5007 | [O I]6300 | [N II]6584 | [S II]6716 | [S II]6731 | F(H) broad |
| 3C 020 | 0.175 | 0.407 | 41.37 | -14.55 ( 4) | 0.26 (10) | 1.48 ( 2) | 0.15 (17) | 0.91 (3) | 0.33 ( 1) | 0.26 ( 5) | |
| 3C 063 | 0.173 | 0.027 | 41.54 | -14.38 ( 5) | 0.23 ( 4) | 1.22 ( 1) | 0.23 ( 3) | 0.29 (2) | 0.18 ( 4) | 0.13 ( 5) | |
| 3C 132 | 0.201 | 0.482 | 41.37 | -14.75 ( 1) | 0.90 ( 5) | 1.24 ( 2) | 0.20 | 1.78 (1) | 0.67 ( 2) | 0.73 ( 2) | |
| 3C 288 | 0.245 | 0.007 | 40.86 | -15.40 ( 6) | 0.58 (17) | 0.62 (16) | 0.40 (13) | 1.87 (3) | 0.85 ( 7) | 0.60 ( 9) | |
| 3C 346 | 0.163 | 0.067 | 41.24a | -14.62a ( 1) | 0.20a (10) | 1.00a ( 2) | 0.14a (14) | 0.84a ( 4) | 0.13a (11) | 0.13a (11) | |
| 3C 349 | 0.206 | 0.031 | 41.50 | -14.58 ( 2) | 0.40 ( 6) | 1.54 ( 2) | 0.25 (13) | 0.90 (2) | 0.34 ( 5) | 0.28 ( 8) | |
| 3C 403.1 | 0.056 | 0.234 | 39.99 | -14.87 (15) | 0.53 (13) | 0.75 ( 7) | 0.29 (17) | 0.78 (6) | 0.90 ( 3) | 0.72 (11) | |
| 3C 410 | 0.249 | 0.050 | 41.86 | -14.40 ( 8) | 0.12 (13) | 1.46 ( 1) | 0.18 ( 9) | 1.04 (1) | 0.37 ( 3) | 0.30 ( 3) | -13.47 (1) |
| 3C 458.0 | 0.289 | 0.082 | 41.58 | -14.84 ( 4) | 0.45 | 2.85 ( 3) | 0.33 (14) | 0.91 ( 3) | 0.36 ( 4) | 0.31 ( 8) | |
| 3C 270 | 0.007 | 0.018 | 39.26 | -13.80 | 0.20 | 0.51 | 0.49 | 2.60 | 0.72 | 0.57 |
Column description: (1) source name; (2) redshift; (3) Galactic absorption; (4) logarithm of the luminosity of the H narrow line, in erg s-1; (5) logarithm of the H flux in erg cm-2 s-1; (6 through 11) de-reddened flux ratios of the key diagnostic lines with respect to H. The values in parentheses report the errors (in percentage) of each line; (12) logarithm of the flux of the H broad component, when visible. Notes: (a) for 3C 346 no measurement of H is possible and we give instead the [O III] luminosity, referring the flux ratios to this line. Data for 3C 270 are taken from Ho et al. (1997) and corrected for Galactic reddening.
radio-power, Log [], and with a FR II morphology, a result that applies to all object of this spectroscopic sub-class.
The number of LEG with high radio luminosity, Log [], and a FR II morphology is significantly increased by the new observations (with the additions of 3C 132, 3C 288, and 3C 349), from six to nine objects, confirming the relevance of this subclass.
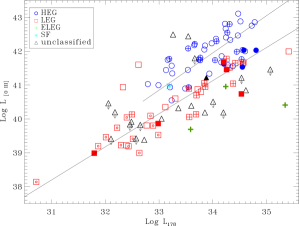
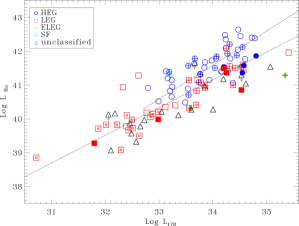
In Paper II we derived the best fit correlation for the link between line luminosity with radio power, considering separately the sub-populations of HEG and LEG. Including the new sources we find:
Log = 1.10 Log + 4.54 (for HEG) and
Log = 0.98 Log + 7.86 (for LEG).
Considering instead the H line we have
Log = 1.01 Log + 7.35 (for HEG) and
Log = 0.82 Log + 13.31 (for LEG).
The slopes of the correlations are only marginally reduced with respect to the values reported in Paper I, by 0.05 and 0.01 for HEG and LEG respectively, for both lines. The errors in the slopes are also marginally reduced to 0.10 (0.09) for the relation between and Log for HEG (LEG).
| Name | redshift | Emission lines | Radio emission | Host magnitude | Classification | ||||
|---|---|---|---|---|---|---|---|---|---|
| H | [O III] | L178 | Pcore | MH | FR | spec | Method | ||
| 3C 020 | 0.174 | 41.37 | 41.54 | 34.55 | 30.44 | -24.64∗ | 2 | HEG | E.I. |
| 3C 063 | 0.175 | 41.54 | 41.63 | 34.21 | 31.12 | – | HEG | E.I. | |
| 3C 132 | 0.214 | 41.37 | 41.46 | 34.25 | 31.58 | -26.00 | 2 | LEG | D.D. |
| 3C 270 | 0.007 | 39.26 | 38.96 | 31.79 | 29.57 | -25.01 | 1 | LEG | E.I. |
| 3C 288 | 0.246 | 40.86 | 40.65 | 34.53 | 31.73 | -26.10∗ | 2 | LEG | E.I. |
| 3C 346 | 0.161 | – | 41.24 | 33.88 | 32.18 | -25.84 | 2 | – | |
| 3C 349 | 0.205 | 41.50 | 41.69 | 34.20 | 31.35 | -24.82∗ | 2 | LEG | E.I. |
| 3C 403.1 | 0.055 | 39.99 | 39.86 | 32.98 | – | -24.36 | LEG | E.I. | |
| 3C 410 | 0.248 | 41.86 | 42.02 | 34.80 | 33.43 | – | 2 | BLO | E.I. |
| 3C 458 | 0.289 | 41.58 | 42.03 | 34.58 | 30.88 | – | 2 | HEG | E.I. |
Column description: (1) 3CR name; (2) redshift from Spinrad et al. (1985); (3) and (4) logarithm of H and [O III]5007 luminosities [erg s-1]; (5) radio luminosity at 178 MHz [erg s-1 Hz-1] from Spinrad et al. (1985); (6) radio core power at 5 GHz [erg s-1 Hz-1] from Baldi & Capetti (2009); (7) host H magnitude from 2MASS (Skrutskie et al., 2006) (or from HST (Donzelli et al., 2007) for the objects marked with a ∗); (8): morphological FR type; (9) spectroscopic classification into High Excitation Galaxy (HEG); Low Excitation Galaxy (LEG); Broad Line Object (BLO); (–) unclassified. Column (10) classification method: E.I. - excitation index; D.D. - diagnostic diagrams.
5 Summary
We presented optical spectroscopic data of nine 3CR radio sources, needed to complete our survey of this catalogue with redshift 0.3, and measured emission lines luminosities and ratios. These data enabled us to derive an optical spectroscopic classification for all but one galaxy. The relationships between spectroscopic and radio properties found from our previous works, are confirmed by the analysis of the now complete sample.
Acknowledgements.
SB and ACe acknowledge the Italian MIUR for financial support. ACa acknowledges COFIN-INAF-2006 grant financial support. This research has made use of the NASA/IPAC Extragalactic Database (NED) which is operated by the Jet Propulsion Laboratory. California institute of Technology, under contract with the National Aeronautics and Space Administration. This research has made use of NASA’s Astrophysics Data System (ADS).References
- Baldi & Capetti (2009) Baldi, R. D. & Capetti, A. 2009, A&A, 508, 603
- Bruzual & Charlot (2003) Bruzual, G. & Charlot, S. 2003, MNRAS, 344, 1000
- Burstein & Heiles (1982) Burstein, D. & Heiles, C. 1982, AJ, 87, 1165
- Burstein & Heiles (1984) Burstein, D. & Heiles, C. 1984, ApJS, 54, 33
- Buttiglione et al. (2009) Buttiglione, S., Capetti, A., Celotti, A., et al. 2009, A&A, 495, 1033 (Paper I)
- Buttiglione et al. (2010) Buttiglione, S., Capetti, A., Celotti, A., et al. 2010, A&A, 509, A6 (Paper II)
- Cardelli et al. (1989) Cardelli, J. A., Clayton, G. C., & Mathis, J. S. 1989, ApJ, 345, 245
- Donzelli et al. (2007) Donzelli, C. J., Chiaberge, M., Macchetto, F. D., et al. 2007, ApJ, 667, 780
- Fanaroff & Riley (1974) Fanaroff, B. L. & Riley, J. M. 1974, MNRAS, 167, 31P
- Ho et al. (1997) Ho, L. C., Filippenko, A. V., & Sargent, W. L. W. 1997, ApJS, 112, 315
- Skrutskie et al. (2006) Skrutskie, M. F., Cutri, R. M., Stiening, R., et al. 2006, AJ, 131, 1163
- Spinrad et al. (1985) Spinrad, H., Marr, J., Aguilar, L., & Djorgovski, S. 1985, PASP, 97, 932
Appendix A Additional material
In the following two tables we provide the data for the whole 3CR sub-sample of radio galaxies with combining the results presented here with those of Paper I and Paper II. This is additional material with respect to the article published in Astronomy & Astrophysics.
| Name | Redshift | E(B-V) | L(H) | F(H) | H | [O III]5007 | [O I]6364 | [N II]6584 | [S II]6716 | [S II]6731 | F(H) broad |
|---|---|---|---|---|---|---|---|---|---|---|---|
| 3C 015.0 | 0.073 | 0.022 | 40.40 | -14.70 ( 2) | 0.32 (20) | 1.58 ( 4) | 0.29 ( 8) | 2.06 ( 1) | 0.32 ( 8) | 0.41 ( 8) | |
| 3C 017.0 | 0.220 | 0.023 | 41.88 | -14.27 ( 1) | 0.24 ( 8) | 1.28 ( 1) | 0.44 ( 1) | 0.70 ( 1) | 0.23 ( 1) | 0.21 ( 2) | -13.87 |
| 3C 018.0 | 0.188 | 0.158 | 41.93 | -14.06 ( 1) | 0.33 ( 1) | 4.17 ( 1) | 0.43 ( 3) | 1.13 ( 1) | 0.38 ( 2) | 0.42 ( 1) | -13.03 |
| 3C 020.0 | 0.175 | 0.407 | 41.37 | -14.55 ( 4) | 0.26 (10) | 1.48 ( 2) | 0.15 (17) | 0.91 (3) | 0.33 ( 1) | 0.26 ( 5) | |
| 3C 028.0 | 0.195 | 0.058 | 41.51 | -14.52 ( 2) | 0.53 (15) | 0.28 (20) | 0.17 (10) | 0.92 ( 3) | 0.55 (10) | – | |
| 3C 029.0 | 0.045 | 0.036 | 40.06 | -14.60 ( 6) | 0.24 (25) | 1.07 ( 2) | 0.19 (16) | 1.85 ( 1) | 0.50 ( 6) | 0.52 ( 4) | |
| 3C 031.0 | 0.017 | 0.001 | 39.83 | -13.96 ( 1) | 0.15 ( 8) | 0.43 ( 2) | 0.14 (12) | 0.99 ( 1) | 0.37 ( 1) | 0.32 ( 1) | |
| 3C 033.0 | 0.060 | 0.028 | 41.63 | -13.29 ( 1) | 0.31 ( 1) | 3.55 ( 1) | 0.25 ( 1) | 0.63 ( 1) | 0.39 ( 1) | 0.33 ( 1) | |
| 3C 033.1 | 0.181 | 0.633 | 41.85 | -14.11 ( 1) | 0.22 ( 5) | 2.80 ( 1) | 0.25 ( 1) | 0.57 ( 1) | 0.27 ( 1) | 0.21 ( 1) | -13.26 |
| 3C 035.0 | 0.067 | 0.141 | 40.22 | -14.81 ( 1) | 1.27 | 0.62 (23) | 0.46 ( 5) | 0.77 ( 2) | 0.62 (15) | – | |
| 3C 040.0 | 0.019 | 0.041 | 39.08 | -14.79 (11) | 0.32 (32) | 1.38 ( 6) | 0.24 (28) | 2.32 ( 1) | 0.81 (10) | 0.52 | |
| 3C 052.0 | 0.285 | 0.232 | 40.64 | -15.76 | – | – | – | – | – | – | |
| 3C 061.1 | 0.184 | 0.176 | 42.05 | -13.92 ( 1) | 0.25 ( 4) | 2.63 ( 1) | 0.08 (10) | 0.31 ( 1) | 0.16 ( 1) | 0.15 ( 3) | |
| 3C 063.0 | 0.173 | 0.027 | 41.54 | -14.38 ( 5) | 0.23 ( 4) | 1.22 ( 1) | 0.23 ( 3) | 0.29 (2) | 0.18 ( 4) | 0.13 ( 5) | |
| 3C 066B | 0.022 | 0.080 | 40.11 | -13.90 ( 4) | 0.22 ( 7) | 0.87 ( 1) | 0.26 (16) | 2.45 ( 1) | 0.56 ( 9) | – | |
| 3C 075N | 0.023 | 0.180 | 39.58 | -14.50 ( 1) | 2.20 | 2.20 | 0.42 ( 2) | 2.48( 1) | 0.69 | 0.37 ( 1) | |
| 3C 076.1 | 0.033 | 0.138 | 39.89 | -14.50 ( 2) | 0.85 | 0.92 | 0.18 | 1.57 ( 1) | 0.33 ( 4) | 0.54 ( 1) | |
| 3C 078.0 | 0.029 | 0.173 | 39.73 | -14.53 ( 3) | 0.18 (30) | 0.48 (16) | 0.18 (13) | 1.88 ( 2) | – | – | |
| 3C 079.0 | 0.256 | 0.127 | 42.39 | -13.91 ( 1) | 0.29 ( 3) | 2.97 ( 1) | 0.05 ( 2) | 0.32 ( 1) | 0.12 ( 3) | 0.11 ( 7) | |
| 3C 083.1 | 0.027 | 0.164 | 39.40 | -14.83 (14) | 0.72 | 1.25 | – | 1.35 ( 3) | – | – | |
| 3C 084.0 | 0.018 | 0.163 | 41.28 | -12.55 ( 1) | 0.42 ( 1) | 2.09 ( 1) | 0.64 ( 1) | 1.12 ( 1) | 0.54 ( 1) | 0.51 ( 1) | |
| 3C 088.0 | 0.030 | 0.126 | 39.98 | -14.33 ( 1) | 0.29 (11) | 1.44 ( 2) | 0.50 ( 3) | 2.39 ( 1) | 0.97 ( 1) | 0.79 ( 3) | |
| 3C 089.0 | 0.139 | 0.134 | 40.28 | -15.42 (11) | 1.86 | 1.69 | 1.26 | 1.43 ( 7) | – | – | |
| 3C 093.1 | 0.243 | 0.389 | 42.35 | -13.89 ( 1) | 0.28 ( 4) | 2.08 ( 1) | 0.28 ( 3) | 1.36 ( 1) | 0.54 ( 1) | 0.55 ( 1) | |
| 3C 098.0 | 0.030 | 0.229 | 40.52 | -13.79 ( 1) | 0.25 ( 3) | 3.01 ( 1) | 0.15 ( 3) | 0.76 ( 1) | 0.34 (10) | 0.23 ( 7) | |
| 3C 105.0 | 0.089 | 0.480 | 40.89 | -14.39 ( 3) | 0.26 (28) | 3.59 ( 1) | 0.38 ( 5) | 1.59 ( 1) | 0.55 ( 4) | 0.55 ( 1) | |
| 3C 111.0 | 0.049 | 1.647 | 42.44a | -12.28a (1) | – | 1.00a( 1) | 0.04a (10) | – | 0.03a ( 7) | 0.03a ( 9 ) | -11.64 |
| 3C 123.0 | 0.218 | 0.981 | 41.96 | -14.18 ( 1) | 0.61 (32) | 1.09 (18) | 0.25 (32) | 2.34 ( 1) | 0.48 ( 1) | 0.35 ( 1) | |
| 3C 129.0 | 0.022 | 1.058 | 39.81 | -14.20 ( 1) | 0.99 | 1.10 | 0.61 ( 1) | 1.51 ( 1) | 0.50 ( 1) | 0.50 (20) | |
| 3C 129.1 | 0.022 | 1.131 | 39.83 | -14.21 | – | – | – | – | – | – | |
| 3C 130.0 | 0.032 | 1.309 | 40.17 | -14.19 | – | – | – | – | – | – | |
| 3C 132.0 | 0.201 | 0.482 | 41.37 | -14.75 ( 1) | 0.90 ( 5) | 1.24 ( 2) | 0.20 | 1.78 (1) | 0.67 ( 2) | 0.73 ( 2) | |
| 3C 133.0 | 0.278 | 0.949 | 42.41 | -13.97 ( 1) | 0.32 ( 1) | 2.26 ( 1) | 0.25 ( 9) | 0.70 ( 1) | 0.17 ( 1) | 0.14 ( 1) | |
| 3C 135.0 | 0.125 | 0.115 | 41.52 | -14.09 ( 1) | 0.33 ( 3) | 3.40 ( 1) | 0.18 ( 2) | 0.80 ( 1) | 0.30 ( 1) | 0.30 ( 3) | |
| 3C 136.1 | 0.064 | 0.762 | 41.41 | -13.57 ( 1) | 0.14 ( 1) | 1.08 ( 1) | 0.05 ( 1) | 0.59 ( 1) | 0.20 ( 1) | 0.20 ( 3) | |
| 3C 153.0 | 0.277 | 0.162 | 41.60 | -14.77 ( 3) | 0.23 (15) | 1.07 ( 3) | 0.36 ( 7) | 1.21 ( 3) | 0.54 ( 8) | 0.33 (13) | |
| 3C 165.0 | 0.296 | 0.174 | 41.44 | -15.00 (15) | 0.44 (15) | 1.68 ( 4) | 0.31 (32) | 1.14 (27) | 0.32 (27) | 0.33 (27) | |
| 3C 166.0 | 0.245 | 0.211 | 41.51 | -14.75 ( 3) | 0.42 ( 6) | 1.40 ( 2) | 0.38 ( 7) | 0.73 ( 4) | 0.41 (16) | 0.34 (24) | |
| 3C 171.0 | 0.238 | 0.054 | 42.45 | -13.78 ( 1) | 0.36 ( 1) | 2.73 ( 1) | 0.24 ( 2) | 0.57 ( 1) | 0.38 ( 6) | 0.29 ( 2) | |
| 3C 173.1 | 0.292 | 0.044 | 41.05 | -15.38 ( 7) | 0.23 | 0.63 (12) | 0.24 (28) | 2.04 ( 3) | 0.24 (29) | 0.31 (24) | |
| 3C 180.0 | 0.220 | 0.098 | 41.79 | -14.36 ( 1) | 0.25 ( 4) | 3.53 ( 1) | 0.10 (28) | 0.69 ( 1) | 0.28 ( 3) | 0.19 ( 5) | |
| 3C 184.1 | 0.118 | 0.032 | 41.79 | -13.77 ( 3) | 0.29 ( 4) | 2.71 ( 1) | 0.08 ( 7) | 0.27 ( 8) | 0.11 ( 1) | 0.09 ( 3) | -13.99 |
| 3C 192.0 | 0.060 | 0.054 | 40.95 | -13.97 ( 1) | 0.30 ( 1) | 2.48 ( 1) | 0.11 ( 3) | 0.71 ( 1) | 0.35 ( 1) | 0.26 ( 1) | |
| 3C 196.1 | 0.198 | 0.065 | 41.56 | -14.48 ( 2) | 0.22 (10) | 0.91 ( 3) | 0.20 (15) | 1.19 ( 1) | 0.52 ( 1) | 0.49 ( 1) | |
| 3C 197.1 | 0.128 | 0.041 | 40.69 | -14.93 ( 3) | 0.37 (11) | 1.69 ( 2) | 0.33 ( 8) | 0.76 ( 4) | 0.29 (11) | 0.31 ( 9) | -13.95 |
| 3C 198.0 | 0.082 | 0.026 | 41.31 | -13.89 ( 1) | 0.27 ( 1) | 0.46 ( 1) | 0.05 ( 9) | 0.28 ( 1) | – | – | |
| 3C 213.1 | 0.194 | 0.028 | 41.01 | -15.02 ( 3) | 0.21 (14) | 1.13 ( 3) | 0.46 ( 6) | 1.41 ( 2) | 0.38 (10) | 0.28 (12) | |
| 3C 219.0 | 0.175 | 0.018 | 41.55 | -14.38 ( 2) | 0.25 (10) | 1.67 ( 1) | 0.44 ( 3) | 0.90 ( 1) | 0.24 ( 6) | 0.24 ( 7) | -13.87 |
| 3C 223.0 | 0.137 | 0.012 | 41.68 | -14.01 ( 1) | 0.23 ( 5) | 3.09 ( 1) | 0.19 ( 3) | 0.63 ( 1) | 0.25 ( 3) | 0.21 ( 3) | |
| 3C 223.1 | 0.107 | 0.017 | 41.16 | -14.30 ( 1) | 0.28 ( 7) | 2.63 ( 1) | 0.06 (15) | 0.81 ( 1) | 0.22 ( 4) | 0.19 ( 5) | |
| 3C 227.0 | 0.086 | 0.026 | 41.08 | -14.17 ( 2) | 0.44 ( 1) | 4.73 ( 1) | 0.22 (13) | 0.19 ( 4) | 0.16 ( 5) | 0.16 (11) | -12.52 |
| 3C 234.0 | 0.185 | 0.019 | 42.64 | -13.33 ( 1) | 0.25 ( 2) | 2.96 ( 1) | 0.04 ( 8) | 0.28 ( 1) | 0.08 ( 3) | 0.07 ( 1) | -13.29 |
| 3C 236.0 | 0.099 | 0.011 | 41.13 | -14.25 ( 1) | 0.22 ( 4) | 0.57 ( 2) | 0.30 ( 3) | 0.69 ( 1) | 0.49 ( 2) | 0.35 ( 3) | |
| 3C 258.0 | 0.165 | 0.020 | 40.96 | -14.90 (23) | 0.11 (24) | 0.17 (15) | 0.47 | 2.14 | – | – | |
| 3C 264.0 | 0.022 | 0.023 | 39.68 | -14.35 ( 1) | 0.27 ( 7) | 0.33 (10) | 0.22 ( 9) | 1.45 ( 1) | 0.33 ( 8) | 0.33 (22) | |
| 3C 270.0 | 0.007 | 0.018 | 39.26 | -13.80 (–) | 0.20 (–) | 0.51 (–) | 0.49 (–) | 2.60 (–) | 0.72 (–) | 0.57 (–) | |
| 3C 272.1 | 0.004 | 0.040 | 38.92 | -13.57 ( 1) | 0.10 ( 3) | 0.19 ( 4) | 0.23 ( 6) | 1.28 ( 1) | 0.52 ( 1) | 0.34 ( 1) | |
| 3C 273.0 | 0.158 | 0.021 | – | – | – | – | – | – | – | – | -11.51 |
| 3C 274.0 | 0.004 | 0.022 | 39.50 | -13.11 ( 1) | 0.17 ( 1) | 0.31 ( 1) | 0.36 ( 1) | 2.32 ( 1) | 0.68 ( 1) | 0.77 ( 1) | |
| 3C 277.3 | 0.086 | 0.012 | 40.83 | -14.43 ( 1) | 0.19 ( 9) | 1.29 ( 1) | 0.29 ( 5) | 0.79 ( 3) | 0.32 ( 1) | 0.28 ( 5) | |
| 3C 284.0 | 0.239 | 0.016 | 41.41 | -14.82 ( 7) | 0.20 (12) | 1.52 ( 1) | 0.24 | 0.61 (11) | 0.45 | 0.41 | |
| 3C 285.0 | 0.079 | 0.017 | 40.66 | -14.52 ( 1) | 0.19 ( 6) | 0.78 ( 1) | 0.10 (10) | 0.54 ( 2) | 0.27 ( 4) | 0.19 ( 6) | |
| 3C 287.1 | 0.216 | 0.025 | 41.50 | -14.62 ( 3) | 0.27 ( 9) | 1.71 ( 1) | 0.48 ( 4) | 0.68 ( 4) | 0.29 ( 7) | 0.29 ( 7) | -13.85 |
| 3C 288.0 | 0.245 | 0.007 | 40.86 | -15.40 ( 6) | 0.58 (17) | 0.62 (16) | 0.40 (13) | 1.87 (3) | 0.85 ( 7) | 0.60 ( 9) | |
| 3C 293.0 | 0.045 | 0.017 | 40.18 | -14.49 ( 3) | 0.19 (17) | 0.42 (10) | 0.26 ( 3) | 0.88 ( 1) | 0.66 ( 2) | 0.66 (10) | |
| 3C 296.0 | 0.025 | 0.025 | 39.87 | -14.28 ( 1) | 0.30 (12) | 0.81 ( 2) | 0.22 (23) | 1.84 ( 1) | 0.43 ( 2) | 0.38 (10) | |
| 3C 300.0 | 0.272 | 0.035 | 41.78 | -14.58 ( 2) | 0.25 ( 9) | 1.71 ( 1) | 0.15 (13) | 0.48 ( 4) | 0.33 ( 4) | 0.23 ( 4) | |
| 3C 303.0 | 0.141 | 0.019 | 41.33 | -14.39 ( 1) | 0.35 ( 4) | 2.55 ( 1) | 0.41 ( 2) | 1.06 ( 1) | 0.46 ( 2) | 0.39 ( 3) | -13.46 |
| 3C 303.1 | 0.269 | 0.036 | 42.10 | -14.24 ( 1) | 0.26 ( 2) | 2.07 ( 1) | 0.24 ( 3) | 1.03 ( 1) | 0.38 ( 2) | 0.48 ( 1) | |
| 3C 305.0 | 0.042 | 0.026 | 40.92 | -13.68 ( 1) | 0.12 ( 4) | 1.30 ( 1) | 0.17 ( 7) | 1.77 ( 1) | 0.48 ( 1) | 0.40 ( 1) | |
| 3C 310.0 | 0.054 | 0.042 | 40.32 | -14.50 ( 1) | 0.23 ( 7) | 0.54 ( 3) | 0.30 ( 4) | 1.74 ( 1) | 0.84 ( 1) | 0.74 ( 2) | |
| 3C 314.1 | 0.120 | 0.020 | 40.31 | -15.25 ( 4) | 0.37 (16) | 0.24 (24) | 0.18 (23) | 0.53 ( 7) | 0.52 ( 8) | 0.33 (13) | |
| 3C 315.0 | 0.108 | 0.062 | 41.15 | -14.32 ( 1) | 0.20 ( 4) | 0.53 ( 1) | 0.25 ( 2) | 0.72 ( 1) | 0.51 ( 1) | 0.37 ( 2) | |
| 3C 317.0 | 0.034 | 0.037 | 40.35 | -14.08 ( 1) | 0.30 ( 5) | 1.00 ( 2) | 0.25 ( 5) | 1.92 ( 1) | 0.58 ( 1) | 0.49 ( 1) | |
| 3C 318.1 | 0.044 | 0.035 | 39.95 | -14.70 ( 4) | 0.58 | 0.26 (32) | 0.21 (19) | 1.02 ( 3) | 0.29 ( 9) | 0.16 (13) | |
| 3C 319.0 | 0.189 | 0.012 | 41.16 | -14.84 ( 7) | 0.13 | 0.10 | 0.27 | 0.30 ( 6) | 0.15 (25) | 0.14 | |
| 3C 321.0 | 0.097 | 0.044 | 40.50 | -14.87 ( 2) | 0.30 (11) | 2.58 ( 1) | 0.06 (28) | 0.50 ( 3) | 0.18 ( 8) | 0.15 (11) | |
| 3C 323.1 | 0.264 | 0.042 | 42.21 | -14.12 ( 1) | 0.26 (11) | 3.93 ( 1) | 0.13 (20) | 0.29 (32) | 0.10 (11) | 0.08 (21) | -12.37 |
| 3C 326.0 | 0.090 | 0.053 | 40.28 | -15.02 ( 5) | 0.23 | 1.31 ( 4) | 0.37 (13) | 1.93 ( 3) | 0.41 (12) | 0.50 (11) | |
| 3C 327.0 | 0.104 | 0.089 | 41.73 | -13.70 ( 1) | 0.27 ( 4) | 3.20 ( 1) | 0.14 ( 1) | 0.73 ( 1) | 0.30 ( 1) | 0.24 ( 1) | |
| 3C 332.0 | 0.151 | 0.024 | 41.31 | -14.47 ( 2) | 0.28 ( 8) | 3.14 ( 1) | 0.21 ( 9) | 0.97 ( 1) | 0.37 ( 6) | 0.36 ( 7) | -12.77 |
| 3C 338.0 | 0.032 | 0.012 | 40.25 | -14.11 ( 1) | 0.18 (19) | 0.21 ( 6) | 0.18 ( 2) | 1.63 ( 1) | 0.41 ( 1) | 0.33 ( 1) | |
| 3C 346.0 | 0.163 | 0.067 | 41.24a | -14.62a ( 1) | 0.20a (10) | 1.00a ( 2) | 0.14a (14) | 0.84a ( 4) | 0.13a (11) | 0.13a (11) | |
| 3C 348.0 | 0.154 | 0.094 | 41.29 | -14.51 ( 1) | 0.25 ( 5) | 0.13 ( 9) | 0.27 ( 5) | 1.27 ( 1) | – | – | |
| 3C 349.0 | 0.206 | 0.031 | 41.50 | -14.58 ( 2) | 0.40 ( 6) | 1.54 ( 2) | 0.25 (13) | 0.90 (2) | 0.34 ( 5) | 0.28 ( 8) | |
| 3C 353.0 | 0.030 | 0.439 | 40.42 | -13.90 ( 1) | 0.20 (17) | 0.53 ( 7) | 0.30 ( 2) | 1.09 ( 1) | 0.56 ( 1) | 0.43 ( 1) | |
| 3C 357.0 | 0.166 | 0.045 | 40.92 | -14.96 ( 3) | 0.23 (16) | 1.08 ( 4) | 0.46 ( 7) | 1.37 ( 4) | – | – | |
| 3C 371.0 | 0.050 | 0.036 | 40.94 | -13.82 ( 1) | 0.29 (10) | 1.01 ( 4) | 0.51 ( 2) | 1.14 ( 1) | 0.32 ( 3) | 0.29 ( 1) | |
| 3C 379.1 | 0.256 | 0.062 | 41.41 | -14.89 ( 6) | 0.31 ( 6) | 2.80 ( 1) | 0.21 (19) | 1.54 ( 5) | 0.30 (13) | 0.28 (14) | |
| 3C 381.0 | 0.161 | 0.053 | 41.79 | -14.05 ( 1) | 0.31 ( 2) | 3.83 ( 1) | 0.11 ( 9) | 0.53 ( 1) | – | – | |
| 3C 382.0 | 0.058 | 0.070 | 41.39 | -13.51 ( 1) | 0.31 ( 1) | 2.45 ( 1) | 0.20 ( 6) | 1.49 ( 1) | 0.12 ( 8) | 0.13 ( 9) | -11.61 |
| 3C 386.0 | 0.017 | 0.335 | 40.17 | -13.63 ( 1) | 1.08 | 1.08 | 0.10 (17) | 0.57 ( 1) | 0.11 ( 7) | 0.08 (10) | |
| 3C 388.0 | 0.091 | 0.080 | 40.83 | -14.47 ( 2) | 0.23 (14) | 0.74 ( 3) | 0.26 (13) | 2.33 ( 1) | 0.41 ( 1) | 0.37 ( 1) | |
| 3C 390.3 | 0.056 | 0.071 | 41.57 | -13.29 ( 1) | 0.32 ( 1) | 3.24 ( 1) | 0.27 ( 1) | 0.47 ( 1) | 0.10 ( 1) | 0.10 ( 1) | -11.60 |
| 3C 401.0 | 0.201 | 0.059 | 41.01 | -15.05 ( 3) | 0.30 (15) | 1.10 ( 5) | 0.24 (16) | 1.77 ( 2) | 0.46 ( 9) | 0.34 (14) | |
| 3C 402.0 | 0.024 | 0.121 | 39.08 | -15.03 ( 3) | 1.95 | 2.19 | 0.37 (13) | 2.97 ( 1) | 0.44 | 0.97 | |
| 3C 403.0 | 0.059 | 0.187 | 41.20 | -13.71 ( 1) | 0.25 ( 3) | 3.54 ( 1) | 0.13 ( 3) | 0.84 ( 1) | 0.25 ( 1) | 0.24 ( 2) | |
| 3C 403.1 | 0.056 | 0.234 | 39.99 | -14.87 (15) | 0.53 (13) | 0.75 ( 7) | 0.29 (17) | 0.78 (6) | 0.90 ( 3) | 0.72 (11) | |
| 3C 410.0 | 0.249 | 0.050 | 41.86 | -14.40 ( 8) | 0.12 (13) | 1.46 ( 1) | 0.18 ( 9) | 1.04 (1) | 0.37 ( 3) | 0.30 ( 3) | -13.47 (1) |
| 3C 424.0 | 0.127 | 0.096 | 41.07 | -14.55 ( 1) | 0.24 ( 6) | 0.54 ( 3) | 0.27 ( 5) | 0.79 ( 1) | 0.44 ( 3) | 0.40 (12) | |
| 3C 430.0 | 0.054 | 0.630 | 40.12 | -14.72 ( 3) | 1.09 | 1.61 ( 9) | 0.33 (20) | 1.43 ( 1) | 0.37 ( 8) | 0.40 ( 4) | |
| 3C 433.0 | 0.102 | 0.145 | 41.40 | -14.01 ( 1) | 0.19 ( 4) | 1.88 ( 1) | 0.22 ( 3) | 1.09 ( 1) | 0.46 ( 2) | 0.30 ( 1) | |
| 3C 436.0 | 0.214 | 0.089 | 41.07 | -15.06 (10) | 0.20 (22) | 3.09 ( 1) | – | 2.08 ( 9) | 0.63 (19) | 0.49 (18) | |
| 3C 438.0 | 0.290 | 0.358 | 41.55 | -14.87 ( 1) | 0.54 | 0.82 | 0.67 | 1.61 ( 1) | 0.66 | 0.46 (28) | |
| 3C 442.0 | 0.026 | 0.065 | 39.78 | -14.40 ( 1) | 0.08 (24) | 0.27 ( 7) | 0.19 ( 8) | 1.84 ( 1) | 0.35 ( 5) | 0.45 ( 1) | |
| 3C 445.0 | 0.056 | 0.083 | 42.50a | -12.37a ( 1) | – | 1.00a ( 1) | 0.04a ( 6) | – | 0.02a (10) | 0.02a (10) | -12.03 |
| 3C 449.0 | 0.017 | 0.167 | 39.71 | -14.09 ( 1) | 0.10 (23) | 0.30 (24) | 0.13 ( 9) | 1.38 ( 1) | 0.29 ( 7) | 0.22 ( 1) | |
| 3C 452.0 | 0.081 | 0.137 | 41.16 | -14.05 ( 1) | 0.23 ( 5) | 1.53 ( 1) | 0.27 ( 2) | 1.08 ( 1) | 0.36 ( 1) | 0.29 ( 1) | |
| 3C 456.0 | 0.233 | 0.038 | 42.48 | -13.72 ( 1) | 0.32 ( 1) | 2.15 ( 1) | 0.15 ( 2) | 0.78 ( 1) | 0.22 ( 1) | 0.24 ( 1) | |
| 3C 458.0 | 0.289 | 0.082 | 41.58 | -14.84 ( 4) | 0.45 | 2.85 ( 3) | 0.33 (14) | 0.91 ( 3) | 0.36 ( 4) | 0.31 ( 8) | |
| 3C 459.0 | 0.220 | 0.066 | 42.13 | -14.02 ( 1) | 0.18 ( 6) | 0.82 ( 1) | 0.14 ( 1) | 1.36 ( 1) | 0.45 ( 1) | 0.30 ( 1) | -13.83 |
| 3C 459.0 | 0.220 | 0.066 | 42.17 | -13.97 ( 1) | 0.16 ( 6) | 0.73 ( 1) | 0.12 ( 1) | 1.77 ( 1) | 0.35 ( 1) | 0.33 ( 1) | |
| 3C 460.0 | 0.269 | 0.092 | 42.09 | -14.25 ( 3) | 0.25 ( 3) | 0.49 ( 7) | 0.39 ( 4) | 1.23 ( 2) | 0.60 ( 1) | 0.54 ( 4) | |
| 3C 465.0 | 0.030 | 0.069 | 40.15 | -14.17 ( 1) | 0.17 (27) | 0.46 ( 6) | 0.26 ( 9) | 2.77 ( 1) | 0.47 ( 1) | 0.32 ( 1) |
Column description: (1) source name; (2) redshift; (3) Galactic absorption;
(4) logarithm of the luminosity of the H narrow line, in erg s-1;
(5) logarithm of the H flux in erg cm-2 s-1; (6 through 11)
de-reddened flux ratios of the key diagnostic lines with respect to H.
The values in parentheses report the errors (in percentage) of each line.
Missing values marked with ‘–’ correspond to lines outside the coverage of
the spectra or severely affected by telluric bands. When no lines are visible
we only give the upper limit for H; (12) logarithm of the flux of the H broad component, when visible.
Notes: (a) for 3C 111, 3C 346, and 3C 445,
no narrow H measurement is possible and we give instead the [O III]
luminosity, referring the flux ratios to this line. No narrow lines are
visible in 3C 273 and we only report its broad H flux. Data for 3C 270 are
taken from Ho et al. (1997) and corrected for Galactic reddening.
| Name | redshift | Emission lines | Radio emission | Host magnitude | Classification | ||||
| H | [O III] | L178 | Pcore | MH | FR | spec | Method | ||
| 3C 015 | 0.073 | 40.40 | 40.60 | 33.30 | 31.64 | -25.29 | LEG | E.I. | |
| 3C 017 | 0.2198 | 41.88 | 41.99 | 34.44 | 32.94 | -24.81∗ | 2 | BLO | E.I. |
| 3C 018 | 0.188 | 41.93 | 42.55 | 34.27 | 32.00 | – | 2 | BLO | E.I. |
| 3C 020 | 0.174 | 41.37 | 41.54 | 34.55 | 30.44 | -24.64∗ | 2 | HEG | E.I. |
| 3C 028 | 0.1952 | 41.51 | 40.96 | 34.24 | 29.33 | – | ELEG | E.I. | |
| 3C 029 | 0.0448 | 40.06 | 40.09 | 32.84 | 30.63 | -25.44 | 1 | LEG | E.I. |
| 3C 031 | 0.0167 | 39.83 | 39.46 | 32.01 | 29.75 | -25.51 | 1 | LEG | E.I. |
| 3C 033 | 0.0596 | 41.63 | 42.18 | 33.65 | 30.36 | -24.75 | 2 | HEG | E.I. |
| 3C 033.1 | 0.1809 | 41.85 | 42.30 | 34.07 | 31.19 | -24.47∗ | 2 | BLO | E.I. |
| 3C 035 | 0.0670 | 40.22 | 40.01 | 33.05 | 30.36 | -25.17 | 2 | – | |
| 3C 040 | 0.0185 | 39.08 | 39.22 | 32.29 | 30.66 | – | 1 | LEG | E.I. |
| 3C 052 | 0.2854 | 40.64 | – | 34.53 | 31.29 | -26.74∗ | 2 | – | |
| 3C 061.1 | 0.184 | 42.05 | 42.47 | 34.47 | 30.49 | -23.50∗ | 2 | HEG | E.I. |
| 3C 063 | 0.175 | 41.54 | 41.63 | 34.21 | 31.12 | – | HEG | E.I. | |
| 3C 066B | 0.0215 | 40.11 | 40.05 | 32.40 | 30.27 | -26.25∗ | 1 | LEG | E.I. |
| 3C 075N | 0.0232 | 39.58 | 39.92 | 32.49 | 29.67 | -24.51∗ | 1 | – | |
| 3C 076.1 | 0.0324 | 39.89 | 39.85 | 32.46 | 29.37 | -24.08∗ | 1 | – | |
| 3C 078 | 0.0286 | 39.73 | 39.41 | 32.51 | 31.25 | -26.16 | 1 | LEG | D.D. |
| 3C 079 | 0.2559 | 42.39 | 42.86 | 34.78 | 31.39 | -25.27 | 2 | HEG | E.I. |
| 3C 083.1 | 0.0255 | 39.40 | 39.50 | 32.57 | 29.48 | -26.70∗ | 1 | – | |
| 3C 084 | 0.0176 | 41.28 | 41.60 | 32.62 | 32.46 | -25.99 | LEG | E.I. | |
| 3C 088 | 0.0302 | 39.98 | 40.14 | 32.49 | 30.57 | -24.81 | 2 | LEG | E.I. |
| 3C 089 | 0.1386 | 40.28 | 40.51 | 34.01 | 31.39 | -26.22 | 1 | – | |
| 3C 093.1 | 0.2430 | 42.35 | 42.67 | 34.24 | – | – | HEG | E.I. | |
| 3C 098 | 0.0304 | 40.52 | 41.00 | 32.99 | 29.87 | -24.38 | 2 | HEG | E.I. |
| 3C 105 | 0.089 | 40.89 | 41.45 | 33.54 | 30.46 | -24.31 | 2 | HEG | E.I. |
| 3C 111 | 0.0485 | – | 42.44 | 33.54 | 31.77 | -25.07 | 2 | BLO | O.R. |
| 3C 123 | 0.2177 | 41.96 | 42.00 | 35.41 | 32.00 | -26.58∗ | LEG | E.I. | |
| 3C 129 | 0.0208 | 39.81 | 39.85 | 32.65 | 29.51 | -25.11 | 1 | – | |
| 3C 129.1 | 0.0222 | 39.83 | – | 32.06 | 28.53 | -25.61 | 1 | – | |
| 3C 130 | 0.1090 | 40.17 | – | 33.66 | 30.94 | -28.45 | 1 | – | |
| 3C 132 | 0.214 | 41.37 | 41.46 | 34.25 | 31.58 | -26.00 | 2 | LEG | D.D. |
| 3C 133 | 0.2775 | 42.41 | 42.76 | 34.72 | 32.53 | -25.36∗ | 2 | HEG | E.I. |
| 3C 135 | 0.1253 | 41.52 | 42.05 | 33.84 | 30.31 | -24.47 | 2 | HEG | E.I. |
| 3C 136.1 | 0.064 | 41.41 | 41.44 | 33.13 | 29.16 | -25.17 | 2 | HEG | E.I. |
| 3C 153 | 0.2769 | 41.60 | 41.63 | 34.56 | 29.94 | -25.60∗ | 2 | LEG | E.I. |
| 3C 165 | 0.2957 | 41.44 | 41.67 | 34.57 | 31.30 | -25.80∗ | 2 | LEG | E.I. |
| 3C 166 | 0.2449 | 41.51 | 41.66 | 34.42 | 32.92 | -25.32∗ | 2 | LEG | E.I. |
| 3C 171 | 0.2384 | 42.45 | 42.89 | 34.51 | 30.55 | -24.73∗ | 2 | HEG | E.I. |
| 3C 173.1 | 0.2921 | 41.05 | 40.85 | 34.61 | 31.39 | -26.48 | 2 | LEG | O.R. |
| 3C 180 | 0.22 | 41.79 | 42.34 | 34.32 | – | -24.94 | 2 | HEG | E.I. |
| 3C 184.1 | 0.1182 | 41.79 | 42.23 | 33.66 | 30.37 | -24.22∗ | 2 | BLO | E.I. |
| 3C 192 | 0.0598 | 40.95 | 41.34 | 33.25 | 29.82 | -24.68 | 2 | HEG | E.I. |
| 3C 196.1 | 0.198 | 41.56 | 41.52 | 34.31 | 31.82 | -25.47 | 2 | LEG | E.I. |
| 3C 197.1 | 0.1301 | 40.69 | 40.92 | 33.55 | 30.43 | -24.94 | 2 | BLO | E.I. |
| 3C 198 | 0.0815 | 41.31 | 40.97 | 33.19 | – | -23.62∗ | SF | D.D. | |
| 3C 213.1 | 0.194 | 41.01 | 41.06 | 33.84 | 31.15 | -25.02∗ | 2 | LEG | E.I. |
| 3C 219 | 0.1744 | 41.55 | 41.77 | 34.53 | 31.69 | -25.70 | 2 | BLO | E.I. |
| 3C 223 | 0.1368 | 41.68 | 42.17 | 33.85 | 30.70 | -24.74 | 2 | HEG | E.I. |
| 3C 223.1 | 0.107 | 41.16 | 41.58 | 33.23 | 30.36 | -24.95 | 2 | HEG | E.I. |
| 3C 227 | 0.0861 | 41.08 | 41.75 | 33.74 | 30.58 | -24.90 | 2 | BLO | E.I. |
| 3C 234 | 0.1848 | 42.64 | 43.11 | 34.47 | 32.04 | -26.09 | 2 | HEG | E.I. |
| 3C 236 | 0.1005 | 41.13 | 40.89 | 33.56 | 31.62 | -25.34 | 2 | LEG | E.I. |
| 3C 258 | 0.165 | 40.96 | 40.19 | 33.85 | – | – | – | ||
| 3C 264 | 0.0217 | 39.68 | 39.20 | 32.43 | 30.32 | -25.09 | 1 | LEG | E.I. |
| 3C 270 | 0.007 | 39.26 | 38.96 | 31.79 | 29.57 | -25.01 | 1 | LEG | E.I. |
| 3C 272.1 | 0.0035 | 38.92 | 38.20 | 30.72 | 28.68 | -24.43 | 1 | LEG | E.I. |
| 3C 273 | 0.1583 | – | – | 34.62 | 33.65 | – | BLO | ||
| 3C 274 | 0.0044 | 39.50 | 38.99 | 32.63 | 30.21 | -25.28 | 1 | LEG | E.I. |
| Continued on Next Page | |||||||||
| Name | redshift | Emission lines | Radio emission | Host magnitude | Classification | ||||
|---|---|---|---|---|---|---|---|---|---|
| H | [O III] | L178 | Pcore | MH | FR | Class | Method | ||
| 3C 277.3 | 0.0857 | 40.83 | 40.94 | 33.21 | 30.34 | -24.87 | 2 | HEG | E.I. |
| 3C 284 | 0.2394 | 41.41 | 41.59 | 34.28 | 30.44 | -25.57 | 2 | HEG | D.D. |
| 3C 285 | 0.0794 | 40.66 | 40.55 | 33.23 | 30.03 | -24.53 | 2 | HEG | E.I. |
| 3C 287.1 | 0.2159 | 41.50 | 41.73 | 34.04 | 32.71 | -25.72 | 2 | BLO | E.I. |
| 3C 288 | 0.246 | 40.86 | 40.65 | 34.53 | 31.73 | -26.10∗ | 2 | LEG | E.I. |
| 3C 293 | 0.0450 | 40.18 | 39.80 | 32.77 | 30.67 | -25.33 | LEG | E.I. | |
| 3C 296 | 0.0240 | 39.87 | 39.78 | 32.22 | 29.99 | -26.04 | 1 | LEG | E.I. |
| 3C 300 | 0.27 | 41.78 | 42.01 | 34.60 | 31.27 | -24.92 | 2 | HEG | E.I. |
| 3C 303 | 0.141 | 41.33 | 41.74 | 33.77 | 31.94 | -25.35 | 2 | BLO | E.I. |
| 3C 303.1 | 0.267 | 42.10 | 42.42 | 34.25 | 31.04 | – | 2 | HEG | E.I. |
| 3C 305 | 0.0416 | 40.92 | 41.03 | 32.79 | 30.07 | -25.26 | 2 | HEG | E.I. |
| 3C 310 | 0.0535 | 40.32 | 40.05 | 33.56 | 30.72 | -25.02∗ | 2 | LEG | E.I. |
| 3C 314.1 | 0.1197 | 40.31 | 39.69 | 33.59 | 29.56 | – | ELEG | E.I. | |
| 3C 315 | 0.1083 | 41.15 | 40.87 | 33.72 | 31.64 | -24.74∗ | LEG | E.I. | |
| 3C 317 | 0.0345 | 40.35 | 40.35 | 33.12 | 31.02 | -26.04 | LEG | E.I. | |
| 3C 318.1 | 0.0453 | 39.95 | 39.36 | 32.72 | 29.12 | -25.70 | – | ||
| 3C 319 | 0.192 | 41.16 | 40.16 | 34.20 | 31.49 | -24.41∗ | 2 | – | |
| 3C 321 | 0.096 | 40.50 | 40.91 | 33.49 | 30.89 | -25.52 | 2 | HEG | E.I. |
| 3C 323.1 | 0.264 | 42.21 | 42.80 | 34.31 | 31.89 | -26.74 | 2 | BLO | E.I. |
| 3C 326 | 0.0895 | 40.28 | 40.40 | 33.60 | 30.45 | -24.33 | 2 | LEG | O.R. |
| 3C 327 | 0.1041 | 41.73 | 42.24 | 33.98 | 30.99 | – | 2 | HEG | E.I. |
| 3C 332 | 0.1517 | 41.31 | 41.81 | 33.77 | 30.79 | -25.38 | 2 | BLO | E.I. |
| 3C 338 | 0.0303 | 40.25 | 39.57 | 32.99 | 30.34 | -26.21∗ | 1 | LEG | E.I. |
| 3C 346 | 0.161 | – | 41.24 | 33.88 | 32.18 | -25.84 | 2 | – | |
| 3C 348 | 0.154 | 41.29 | 40.40 | 35.35 | 30.80 | – | ELEG | D.D. | |
| 3C 349 | 0.205 | 41.50 | 41.69 | 34.20 | 31.35 | -24.82∗ | 2 | LEG | E.I. |
| 3C 353 | 0.0304 | 40.42 | 40.14 | 33.69 | 30.61 | -24.77 | 2 | LEG | E.I. |
| 3C 357 | 0.1662 | 40.92 | 40.95 | 33.86 | 30.63 | -25.83∗ | 2 | LEG | D.D. |
| 3C 371 | 0.0500 | 40.94 | 40.94 | 32.33 | 31.85 | -25.36 | LEG | E.I. | |
| 3C 379.1 | 0.256 | 41.41 | 41.86 | 34.16 | 30.90 | -25.69 | 2 | HEG | E.I. |
| 3C 381 | 0.1605 | 41.79 | 42.37 | 34.06 | 30.63 | -24.81 | 2 | HEG | D.D. |
| 3C 382 | 0.0578 | 41.39 | 41.78 | 33.19 | 31.22 | -26.03 | 2 | BLO | E.I. |
| 3C 386 | 0.0170 | 40.17 | 40.20 | 32.18 | 28.95 | -24.57 | – | ||
| 3C 388 | 0.091 | 40.83 | 40.70 | 33.70 | 31.15 | -26.20 | 2 | LEG | E.I. |
| 3C 390.3 | 0.0561 | 41.57 | 42.08 | 33.54 | 31.46 | -24.84 | 2 | BLO | E.I. |
| 3C 401 | 0.2010 | 41.01 | 41.05 | 34.38 | 31.67 | -25.03∗ | 2 | LEG | E.I. |
| 3C 402 | 0.0239 | 39.08 | 39.42 | 32.11 | 29.79 | -24.77∗ | 1 | – | |
| 3C 403 | 0.0590 | 41.20 | 41.75 | 33.16 | 29.96 | -25.27 | 2 | HEG | E.I. |
| 3C 403.1 | 0.055 | 39.99 | 39.86 | 32.98 | – | -24.36 | LEG | E.I. | |
| 3C 410 | 0.248 | 41.86 | 42.02 | 34.80 | 33.43 | – | 2 | BLO | E.I. |
| 3C 424 | 0.127 | 41.07 | 40.80 | 33.78 | 30.87 | -23.96∗ | LEG | E.I. | |
| 3C 430 | 0.0541 | 40.12 | 40.33 | 33.36 | 30.06 | -25.28 | 2 | LEG | O.R. |
| 3C 433 | 0.1016 | 41.40 | 41.67 | 34.16 | 30.11 | -25.79∗ | HEG | E.I. | |
| 3C 436 | 0.2145 | 41.07 | 41.56 | 34.37 | 31.39 | -25.50 | 2 | HEG | D.D. |
| 3C 438 | 0.290 | 41.55 | 41.46 | 35.07 | 31.65 | -26.57 | 1 | – | |
| 3C 442 | 0.0263 | 39.78 | 39.21 | 32.39 | 28.49 | – | LEG | E.I. | |
| 3C 445 | 0.0562 | – | 42.50 | 33.26 | 31.42 | – | 2 | BLO | O.R. |
| 3C 449 | 0.0171 | 39.71 | 39.19 | 31.87 | 29.38 | -24.80∗ | 1 | LEG | E.I. |
| 3C 452 | 0.0811 | 41.16 | 41.34 | 33.94 | 31.34 | -24.92 | 2 | HEG | E.I. |
| 3C 456 | 0.2330 | 42.48 | 42.81 | 34.23 | 31.57 | – | 2 | HEG | E.I. |
| 3C 458 | 0.289 | 41.58 | 42.03 | 34.58 | 30.88 | – | 2 | HEG | E.I. |
| 3C 459 | 0.2199 | 42.17 | 42.03 | 34.55 | 33.20 | -25.34∗ | 2 | BLO | E.I. |
| 3C 460 | 0.268 | 42.09 | 41.78 | 34.25 | 31.52 | – | 2 | LEG | E.I. |
| 3C 465 | 0.0303 | 40.15 | 39.81 | 32.89 | 30.74 | -26.44∗ | 1 | LEG | E.I. |
Column description: (1) 3CR name; (2) redshift from Spinrad et al. (1985); (3) and (4) logarithm of H and [O III]5007 luminosities [erg s-1] from Buttiglione et al. (2009); (5) radio luminosity at 178 MHz [erg s-1 Hz-1] from Spinrad et al. (1985); (6) radio core power at 5 GHz [erg s-1 Hz-1] from Baldi & Capetti (2009); (7) host H magnitude from 2MASS (Skrutskie et al. 2006) (or from HST (Donzelli et al. 2007) for the objects marked with a ∗); (8): morphological FR type; (9) spectroscopic classification into High Excitation Galaxy (HEG); Low Excitation Galaxy (LEG); Broad Line Object (BLO); Extremely Low Excitation Galaxy (ELEG); (SF) starforming galaxy; (–) unclassified. Column (10) classification method: E.I. - excitation index; D.D. - diagnostic diagrams; O.R. - emission line radio correlation.