Polarization-preserving confocal microscope for optical experiments
in a dilution refrigerator with high magnetic field
Abstract
We present the design and operation of a fiber-based cryogenic confocal microscope. It is designed as a compact cold-finger that fits inside the bore of a superconducting magnet, and which is a modular unit that can be easily swapped between use in a dilution refrigerator and other cryostats. We aimed at application in quantum optical experiments with electron spins in semiconductors and the design has been optimized for driving with, and detection of optical fields with well-defined polarizations. This was implemented with optical access via a polarization maintaining fiber together with Voigt geometry at the cold finger, which circumvents Faraday rotations in the optical components in high magnetic fields. Our unit is versatile for use in experiments that measure photoluminescence, reflection, or transmission, as we demonstrate with a quantum optical experiment with an ensemble of donor-bound electrons in a thin GaAs film.
I Introduction
Fundamental research on quantum coherence in solid state is currently strongly driven by the goal to implement quantum information tasks Awschalom et al. (2002); Zoller et al. (2005); Southwell (2008). Electron and hole spins in semiconductors are here of special interest since these material systems give access to realizing compact devices where quantum correlations between coherence of spins and optical signal fields can be established. However, optical manipulation and detection of spins is a challenging task since experiments demand a combination of conflicting requirements such as cryogenic temperatures, high optical intensities, high magnetic fields, and precise control of the optical polarizations.
In recent years research in this direction nevertheless developed into a very active field that showed many impressive results, in particular with localized spins in quantum dots or spins bound to donor sites Fu et al. (2005); Atatüre et al. (2007); Fu et al. (2008); Press et al. (2008); Berezovsky et al. (2008); Greilich et al. (2009); Xu et al. (2009); Brunner et al. (2009); Latta et al. (2009). Most of these experiments were carried out at temperatures of a few Kelvin. Lower temperatures were till now typically not useful since spin states can be prepared via optical pumping, and the coherence of localized spins is in all III-V and most II-VI semiconductors limited by hyperfine coupling to fluctuating nuclear spins. We anticipate, however, that dephasing by nuclear spins can be removed with controlled dynamical nuclear polarization effects Xu et al. (2009); Latta et al. (2009) or with spin echo techniques Clark et al. (2009). If such techniques are fully exploited, optical experiments at milliKelvin temperatures become of interest, since freezing out the phonons at energies of the Zeeman splitting of electron or hole spins will be important for exploring the ultimate limit of controlling spin coherence in solid state. We report here the design and operation of a fiber-based confocal microscope in a dilution refrigerator that is suited for this research. This instrument also has relevance for related quantum optical studies with spin coherence of quantum Hall states van der Wal and Sladkov (2009); Imamoglu (2000), or optical studies of the Kondo effect Türeci et al. (2009); Kleemans et al. (2010); Latta and et al. (2010).
When designing optical experiments in a dilution refrigerator one has to deal with a number of restrictions. (i) The sample space is typically inside a series of heat shields that forbid free-space optical access to the sample. The sample volume can be reached with optical fibers, but this requires a method to couple light from the fiber to the sample. (ii) The limited sample volume requires compact solutions which can withstand cryogenic temperatures and high magnetic fields. (iii) Using high optical intensities is in conflict with the need to maintain low power dissipation. High intensity at low optical power can obviously be realized with tight focussing, but this requires a microscope with good performance in the sample volume. (iv) If the experiments require well-defined polarizations, one needs to deal with the fact that in high fields most optical components will cause a substantial Faraday rotation of the polarization.
To address all these constraints we build on an earlier design of a fiber-based confocal microscope for use at 4.2 Kelvin Hogele et al. (2008). Our key innovations are that we circumvent Faraday rotations by using a polarization maintaining fiber and by using a compact cryogenic microscope with all propagation through free-space elements in a direction that is orthogonal to the magnetic field. In addition, we make the approach suited for application at milliKelvin temperatures and we report how we deal with stronger constraints for the heat load from various functions, as for example the wiring to piezo motors that drive the microscope focussing.
We demonstrate application of the microscope on an ensemble of donor-bound electrons in a thin GaAs film. We performed optical spectroscopy of spin-selective transitions of the donor-bound electron states to donor-bound trion states, both via photoluminescence and in direct transmission experiments. We also directly demonstrate a quantum optical effect, known as electromagnetically induced transparency, with this material system.
II Microscope design and operation
II.1 Modular compact microscope unit
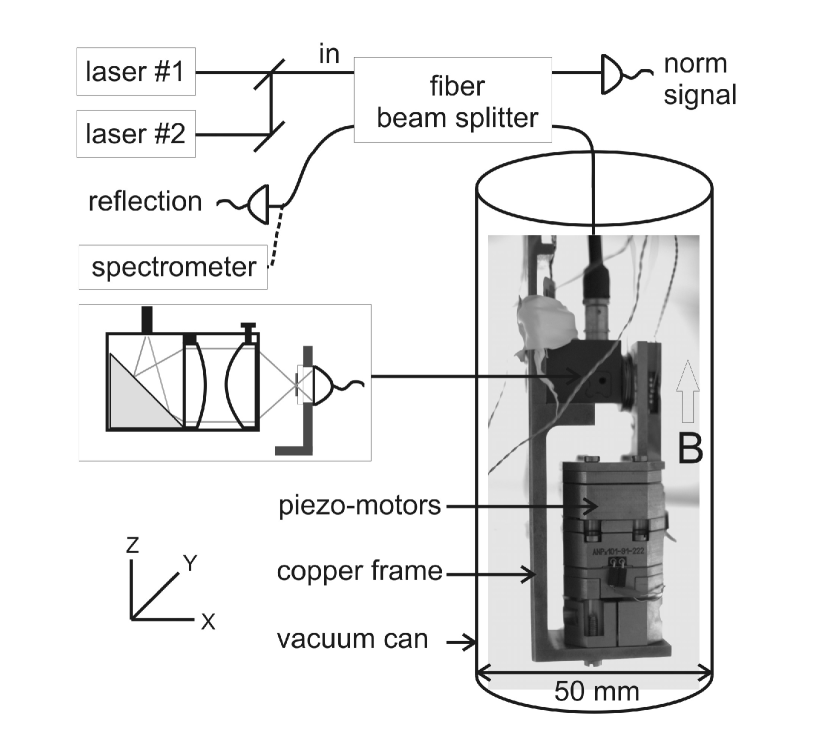
We designed the confocal microscope as a compact cold-finger that fits inside the bore of a superconducting magnet, and which is a modular unit that can be easily swapped between use in a dilution refrigerator (Leiden Cryogenics DRS1000) and a helium bath cryostat. Both systems are equipped with a superconducting magnet (Cryogenics Ltd.), with a bore that yields a cylindrical sample space of 60 mm diameter (for the dilution refrigerator this concerns a 78 mm bore with a series of heat shields around the sample volume). In both cryostats the magnetic field is applied along the vertical direction (defined as -direction).
II.2 Polarization maintaining fiber
For delivering light into the sample volume we use a single-mode polarization-maintaining PANDA-type fiber Purchased and data sheet from Schäfter und Kirchhoff (Germany) (PMF) with . Its mode-field diameter is and the cut-off wavelength is . Operation of the PMF is based on built-in stress that induces a linear birefringence (different index of refraction, and ) for two TEM propagation modes with orthogonal linear polarizations. Linear light coupled into one of these two modes does not couple into the other mode during propagation. We apply this for delivering fields with polarization parallel (defined as V polarization) and orthogonal (defined as H polarization) to the magnetic field.
Using a PMF has the advantage that we can deliver well-defined polarizations that remain pure in the field range -9 T to +9 T. This removes the need for in-situ polarization analysis for calibrating and pre-compensating Faraday rotations and other effects that influence the polarizations Hogele et al. (2008). In addition, the polarizations remain pure when the fiber is subject to stress from bending and thermal gradients, and the polarization purity is thereby also more resilient against mechanical vibrations.
To evaluate whether the PMF will indeed suppress all Faraday rotations in fields up to 9 T we need to compare the stress induced birefringence to the Faraday effect. This can be quantified by comparing the associated beat length and rotation length, respectively. If linearly polarized light is coupled into the PMF but not along one of the TEM eigenmodes, its polarization will undergo periodic unitary transformation due to the difference between and . The period of transformation is the linear birefringence length (the smaller , the better the polarization maintaining properties of the fiber). For the fiber in use Purchased and data sheet from Schäfter und Kirchhoff (Germany) . The Faraday effect occurs when an optical fiber is a subject to magnetic field along its optical axis. It then shows circular birefringence and its strength is characterized by the Verdet constant. This yields a circular birefringence rotation length for a magnetic field and with the Verdet constant of the fiber Purchased and data sheet from Schäfter und Kirchhoff (Germany) . Our fiber thus has and we therefore expect that linear polarization of light coupled into one of the fiber TEM eigenmodes will not be affected by magnetic field. We do check that this is indeed the case by using polarization selective optical transitions of donor-bound electrons as a polarization probe (further discussed in Sec. III).
The single-mode nature of the PMF is useful for experiments where two co-propagating fields should drive the same system. The beam overlap for these two fields will then be ideal in the sample volume.
II.3 Confocal microscope in Voigt geometry
To focus light from the fiber in the sample volume we use a compact home-built microscope objective, based on two aspheric lenses. The approach is similar to the system used by A. Högele Hogele et al. (2008) et al., but we incorporated changes that avoid circular birefringence that occurs when light propagates through lens material in high fields. This can rotate linear polarizations by several degrees in lens material in a magnetic field Munin et al. (1992) (typical values for the Verdet constant of materials Valev et al. (2008); Robinson (1964) as BK7 and Corning glass are 1–10 ). Before light is collimated and focused its propagation direction is diverted by means of a surface mirror (dielectric prism, Thorlabs MRA05-E02) after which its -vector is orthogonal to the direction of the magnetic field and this eliminates the magnetic field induced rotation of the polarization.
Another advantage of this approach is that it gives access to optical experiments in Voigt geometry (light propagation direction orthogonal to the magnetic field direction). In this geometry, light with V polarization can drive atomic -transitions (no change in angular momentum), and light with H polarization can drive atomic -transitions (a change in angular momentum of ). Thus, this yields that for the typical optical selection rules of electron spins in semiconductors, transitions that start from the electron spin-up or spin-down state can be addressed selectively with two orthogonal linear polarizations. Another advantage is that one of these two fields can be easily blocked by polarization filtering before the two co-propagating modes reach a detector (as required for several resonant-Raman control schemes Duan et al. (2001)). Such a filter with high extinction ratio can be realized before any propagation through glass material as a metal nanowire-grid polarizer on a transparent substrate Wang et al. (2006).
The first lens of the microscope objective collimates the light from the fiber. We use an aspheric lens (Thorlabs 350430) with focal length , numerical aperture and clear aperture . After collimating, light is focused by a second aspheric lens (Thorlabs 350140) with focal distance , and clear aperture . Since we do not have perfect matching between the fiber and the collimating lens, the numerical aperture of the full objective system will be less than that of the focusing lens, resulting in . Using this we can estimate the theoretical value for the spot diameter to be .
The prism mirror and the collimating lens are firmly glued into a DuPont Vespel-SP1 housing. This material was chosen (instead of copper for example) since its thermal expansion is smaller, and also lies closer to that of the lenses. The focusing lens is fixed inside a separate Vespel-SP1 frame and then fitted into the housing of the objective. This allows for removing the focusing lens from the objective while aligning the fiber with respect to the collimating lens. In addition, the focussing lens has a certain positioning freedom (along the propagation direction, about ). This can be used to fit in a plastic thin-film retardation plate, which can be used if one wishes to transform the linear polarizations into circular polarizations.
II.4 Focussing mechanics and wiring to the piezo motors
For positioning the sample in the focus of the objective we use a three-axes -translation stage on the cold finger in the form of slip-stick piezo-motors (Attocube, model ANP101). This gives a travel range of in all three directions. Both the piezo stack and the objective are fixed on a home-built copper frame (Fig. 1).
Applying such piezo motors in a dilution refrigerator is not straightforward since the wires to the motors should have a resistance of at most. In the dilution refrigerator the length of the wires exceeds a few meters, such that wires with low resistivity must be used. This, however, creates an unacceptable heat load on the mixing chamber with most types of wiring. We circumvented this problem by using coaxial lines with low DC resistance values. This works very well since the need for the low resistance values is partly driven by the need for high bandwidth for getting triangular control pulses (100 V) with a fast edge to the piezo-motors without much smoothing.
We implemented this by installing a set of 7 of multi-purpose coaxial lines to the mixing chamber (Micro-Coax, semi-rigid model UT 85-B-SS, 60 GHz bandwidth, stainless steel outer conductor, silver-plated BeCu inner conductor, 0.5 DC resistance). These have an excellent trade-off between low electrical resistance and low thermal conductance at low temperatures. The piezo-motors use 3 of these coaxial lines.
Realizing a low heat load on the mixing chamber still requires to heat-sink the inner conductor of the coaxial lines at several stages between room temperature and base temperature. We use home-built heat sinks at 4.2 K, the 1K-pot (1.5 K), the still (600 mK), the cold plate (100 mK) and at the mixing chamber. The heat sinks are made with sapphire substrates in a copper housing unit (Fig. 2), since sapphire combines high electrical resistance with good thermal conductivity at low temperatures. We gold-plated one of the surfaces of the sapphire. The non-plated sapphire surface is then glued onto a copper plane in the housing unit with thin stycast. Two SMA connectors are then mounted on this unit, and we solder the inner conductors on opposite sides of the gold plated sapphire surface. Our units show more than sufficient bandwidth (a few MHz) for the piezo-motor application, but this can be increased by engineering the sapphire plates as microwave strip lines. After installing these coaxial lines we did not observe an effect on the cooling power of the dilution refrigerator (base temperature well below 20 mK), and we achieved driving of the piezo-motors via these coaxial lines without any problems.
II.5 Optical detection and cooling down procedure
For optical detection in transmission experiments we use a photodiode (Hamamatsu, , 5106) on the -shaped copper sample holder that is mounted on the piezo-motor stack (Fig. 1). The sample can be mounted in front of the photodiode. The detection of signals from reflection and photoluminescence experiments is discussed below.
The use of the photodiode on the cold finger shows in practice the risk that it breaks while cooling down the system. Most likely, this is because thermal shrinking causes a crack in the plastic laminate of the diode that also breaks the semiconductor chip underneath. To avoid this, we cool down with He contact gas at a pressure which does not exceed . This enforces the system to cool very slowly (in about 6 hours). With this approach, our photodiodes survive in 9 out of 10 cases.
II.6 Focal plane positioning and spot size
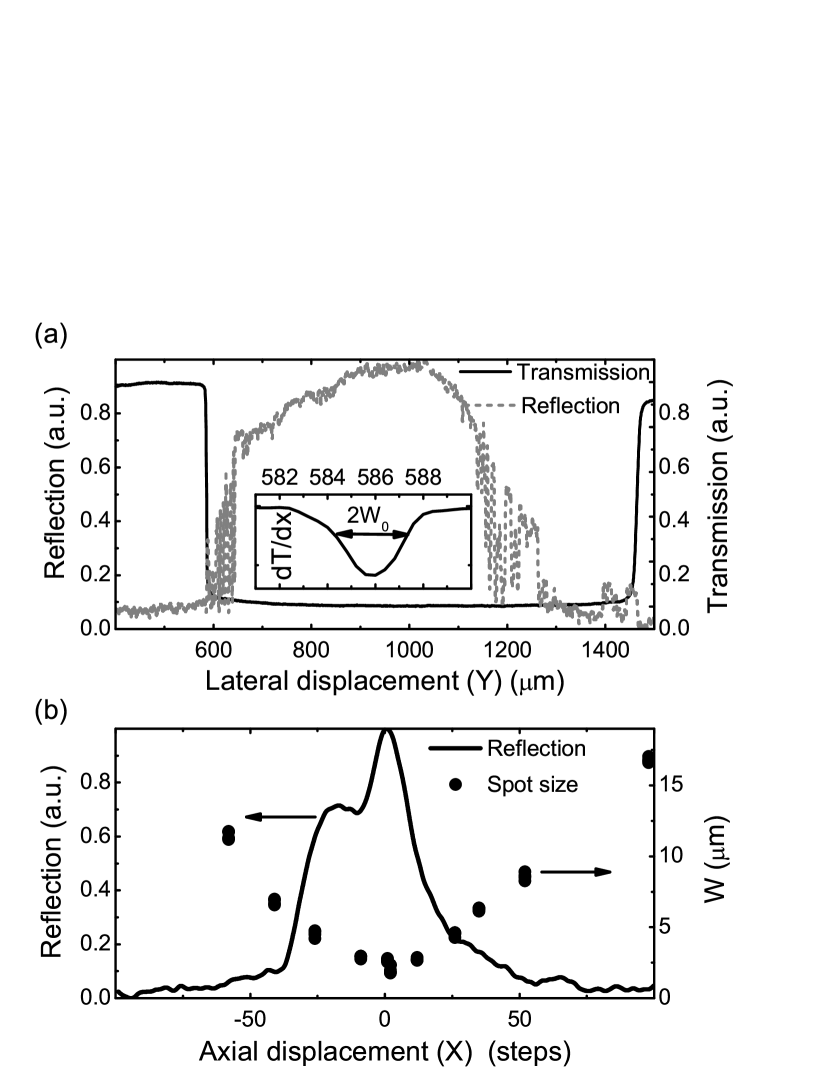
Since we do not have direct free optical access to the system, it is necessary to design a procedure for positioning and focussing that rely on using the transmitted and reflected signal only. For positioning in the plane orthogonal to the optical axis, we use the trivial approach with high-contrast markers on the sample that can be detected in the transmission signal. For positioning the sample plane in the focal point of the objective (along -axis), we use the fact that the output of the fiber and the objective unit together constitute a confocal microscope. We use this in a procedure with a fiber-coupled diode laser (Thorlabs LPS-785-FC) operated below the lasing threshold (incoherent light for avoiding interferences in the back-reflected signal). The light is delivered into the sample volume via the optical fiber, with a fiber-based beam splitter (OZ optics) in its path (Fig. 1). This allows for measuring the reflected signal while the position of the sample surface is scanned along the -axis through the focus of the objective.
A typical focal plane scan is shown in Fig. 3(b). As expected, the reflected signal reaches a maximum when the sample plane is positioned exactly in the focus of the objective and drops smoothly while going out of focus. In contrast to the previously reported microscopes Hogele et al. (2008) we observe not a single Lorentzian reflection profile but a superposition of two Lorentzians, which indicates a small misalignment within the confocal microscope. This is most likely due to a non-uniaxial arrangement of the lenses with respect to the optical axis of the fiber that results from a small misalignment of the prism mirror. We did not correct this for the data presented here since we have the prism mirror firmly glued in the objective housing, and it did not compromise the experiments we present below.
To determine the spot size we use the knife-edge technique, where we fix the axial position (along the -axis) of the microscope at different locations on the reflection curve (Fig. 3(b)) and perform a lateral scan (-direction) across the sample. A typical scan, taken with the sample plane in focus, is shown in the Fig. 3(a). The solid black curve is the transmitted signal and the dashed gray curve is the reflected signal. As expected, a high signal level in reflection corresponds to low signal level in transmission since we use here an -GaAs sample that is opaque for the used wavelength, on a transparent substrate. Light that is reflected from the sample surface is efficiently collected back into the fiber because of the confocal geometry. The reflection profile is also influenced by the morphology of the sample surface, which is not uniform due to fabrication imperfections. It is, however, always possible to find a spot on the sample with a clean reflection profile.
Since we know the size of the sample we can calculate the lateral (-axis) step size of the piezo-motors (which depends on temperature and mechanical load). From the slope of the transmission signal when scanning across a sharp edge we can determine the spot size of the beam (inset of the Fig. 3(a)). We define the spot size on the surface of the sample as the radius of a Gaussian beam (waist when in focus). The black dots in the Fig. 3(b) are results for after fitting the knife-edge profile with a Gaussian function.
The measured beam waist was found to be , which is almost four times larger than our theoretical estimate for the diffraction limited spot size. This is related to the small misalignment, since the aspheric lenses are highly optimized for realizing a small focus exactly on the optical access, and with correcting the alignment this type of objective at low temperatures can yield a spot size that is well within a factor 2 from the diffraction limit Hogele et al. (2008). The larger spot was compromising the efficiency of collecting light in our photoluminescence experiments, but it did not compromise our transmission experiments (further discussed below). In the transmission experiments we also work at least a small amount out of focus in order to eliminate interference effects that occur when working in focus. These then result from the Fabry-Perot cavity that is formed between the sample surface and the facet of the fiber output.
III Characterization of performance
A characterization of the focussing protocol and the spot size was already included in the previous section. In this section we focus on the polarization purity and achieving a low heat load and good heat-sinking on the cold finger.
III.1 Polarization purity
In order to characterize the polarization preserving properties of the setup we used the optical transitions of donor-bound electrons ( system) to a donor-bound trion state (the lowest level of the complex) in a strong magnetic field. Our sample was a thin GaAs epilayer with Si doping at very low concentration (further discussed below). The relevant level scheme with transitions labeled and is presented in Fig. 4(a). The states and are the spin-up and spin-down state of the electron in the system, which is localized at the donor site in a Hydrogen-like orbital. These two states are Zeeman-split by the applied magnetic field. The optical transitions and are to the lowest energy level of the system (state , well separated from the next level ), which has two electrons in a singlet state and a spin-down hole with localized at the donor site Clark et al. (2009). The optical selection rules of this system have been characterized very well Karasyuk et al. (1994) and show a strong polarization dependence. For the system, H-polarized light couples to the transition (with a change in angular momentum of ) but not to the transition. In contrast, V-polarized light couples to the transition (and not to ), since this is a transition without a change in angular momentum.
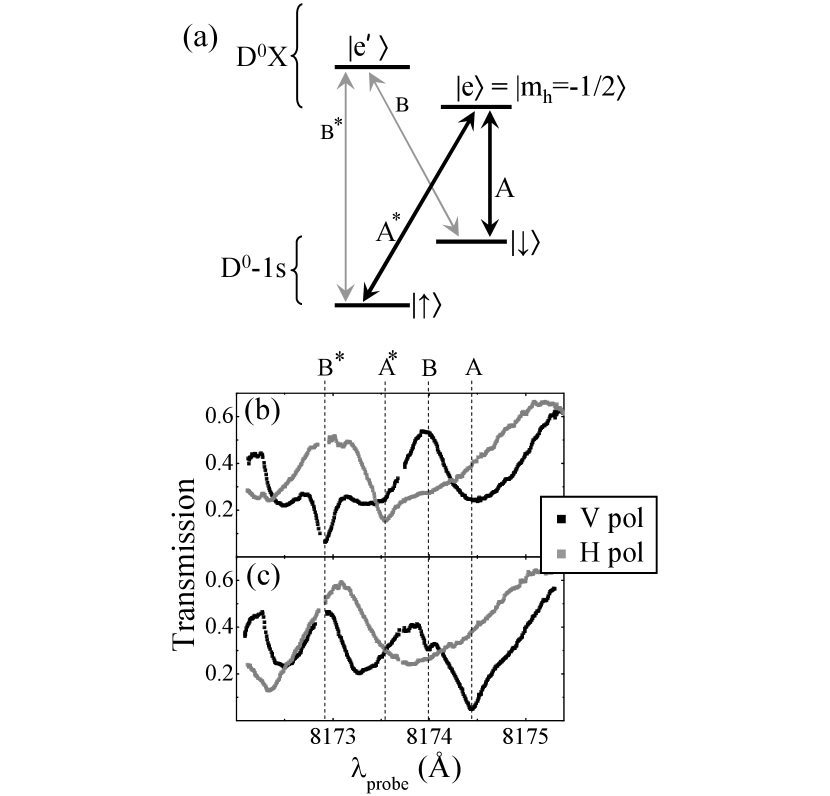
For performing this test we took scanning-probe transmission spectra with tunable CW Ti:sapphire lasers (Coherent MBR-110, linewidth below 1 MHz) around the resonances (Fig. 4(b,c)). These spectra are results of pump-assisted transmission spectroscopy. This approach is needed for avoiding bleaching of transitions due to optical pumping by the probe, and it is also useful for identifying whether spectral lines are from transitions that start from or from . For further explanation it is best to focus on a typical result (Fig. 4(c)): Here, we fixed the pump laser on the frequency of the transition with H polarization, while we scan the probe laser frequency with V polarization and study its transmission. We then observe that the absorption of the transition is strongly enhanced by the pump (compare to absorption by in Fig. 4(b)). These results appear with respect to a background signal with slower modulation of the transmission that is due to a Fabry-Perot effect in the sample (further discussed below). In these experiments we use a chopper in the probe beam and lock-in techniques for separating the detected signal from the pump and probe beam.
The strong polarization dependence of the absorption lines and in the transmission spectra in Fig. 4(b,c) demonstrates that the linear polarizations H and V are indeed well preserved in our setup. We performed such experiments with magnetic fields in the range from to 9 T, and the effective polarization selectivity did not show a dependence on . We analyzed that in our experiments the characterization of the polarization purity is in fact limited by the accuracy of the polarization preparation on the optical table, and the alignment of the H and V mode of the PMF fiber output with respect to the direction of the magnetic field. Characterizing this with all instrumentation at room temperature showed that the error from coupling light purely into one of the eigenmodes of the PMF is at the level of 1 part in 100. In our experiment this was sufficiently low, evidenced by the fact that an attempt to pump transition with H-polarized light did not induce any changes in the transmission spectrum from such pump-assisted spectroscopy.
For characterizing the polarizations we could not implement the approach of A. Högele et al. Hogele et al. (2008) with cryogenic polarizing beam splitters near the sample volume. Our sample space is too small, and it would also be difficult to deal with Faraday rotations in the beam splitter cube itself.
III.2 Heat load and heat-sinking of optical power
With our unit installed in the dilution refrigerator, we could cool down to milliKelvin temperatures without any problems, and running the optical experiments with typical conditions did not show excessive heating. In particular, in the next section we discuss experiments in which we drive the transition with optical Rabi frequencies up to GHz. We performed this with a spot size as large as 200 , where this driving corresponds to an optical heat load of 20 . This is well below the cooling power of our dilution refrigerator at 100 mK.
Obviously, the semiconductor material in the focus of the optical fields can be at a much higher temperature than the mixing chamber material. We indeed found that it is crucial to thoroughly heat-sink our -GaAs epilayers. The only experiments where we could avoid this heating used -GaAs epilayers that were directly attached to a sapphire substrate with binding by van der Waals forces, and a good thermal contact between the sapphire and the cold finger. These samples were prepared by first using an epitaxial lift-off technique Yablonovitch et al. (1987) for removing the GaAs epilayers from the original GaAs wafer. This was followed by transferring the epilayer to a wedged sapphire substrate.
While we thus successfully operated this unit at sub-Kelvin temperatures, the experimental data did not show features that differed from the 4.2 K data. For the experiments on system that we present below, this could be expected. The optical transitions at 4.2 K show an inhomogeneous linewidth of 6 GHz, which is not expected to narrow at lower temperatures. Also, the electron spin dephasing time for the system is limited by hyperfine coupling to fluctuating nuclear spins, and this mechanism is temperature independent in the range 10 mK to 4.2 K. Our attempts to suppress these fluctuations via dynamical nuclear polarization (DNP) only showed a very small improvement of the dephasing time till now, since the optically induced DNP effects appeared to be very weak in our experiments Sladkov et al. (2010). For the discussion of applications of our system we therefore focus on data taken at 4.2 K.
IV Application: Spectroscopy and EIT with -GaAs
In order to demonstrate the versatility of our setup we performed an optical study of the coherent properties of an ensemble of systems in GaAs. This system was already introduced in Sec. III.1. We present here data from epitaxially grown films of GaAs with Si doping at . At such low concentrations the wavefunction of the neighboring donors do not overlap, which yields an ensemble of non-interacting systems.
To study the coherent properties of such ensembles we first find the spectral position of the relevant optical transitions Bogardus and Bebb (1968) with photoluminescence and transmission spectroscopy. We then resolve the fine spectra of the Zeeman-split levels Karasyuk et al. (1994) with the pump-assisted transmission spectroscopy. After identifying the - system in this manner, we could demonstrate electromagnetically induced transparency Fleischhauer et al. (2005) (EIT) with this medium, which is a quantum optical effect that uses the spin coherence.
IV.1 Photoluminescence
We performed photoluminescence experiments to identify the spectral region where emission by the donor-bound excitons occurs. We brought excitation light (wavelength ) to the sample with a fiber-based beam splitter in the optical path (Fig. 1). The reflection channel of the beam splitter is coupled to a PI Acton spectrometer, equipped with a nitrogen cooled CCD camera. The light at the excitation wavelength was suppressed by passing the reflected signal through a bandpass filter ). The sample surface was positioned in the focus of the confocal microscope in order to maximize efficiency of the luminescence collection.
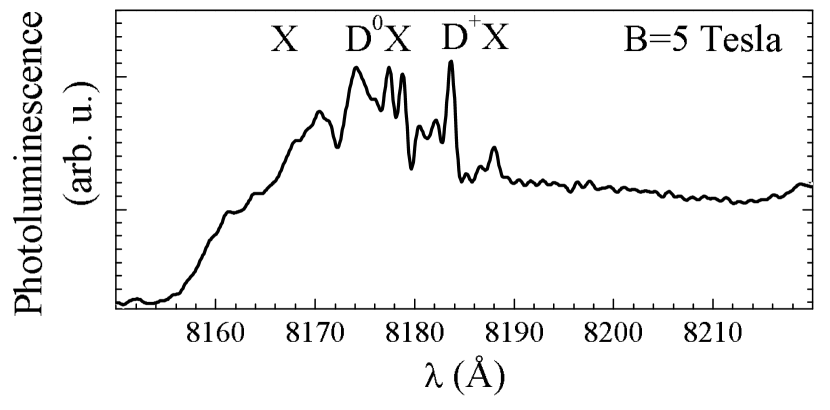
A typical photoluminescence spectrum taken at is shown in Fig. 5. The spectrum is dominated by three structured peaks, which result from emission by free excitons (), excitons bound to neutral donor sites (), and excitons bound to ionized donor sites in the sample’s depletion layer near the surface (). The fine structure due to the Zeeman splitting of the electron and hole spins of the () and () bound excitons is observed, but does not provide sufficient information for identifying all the transitions due to the highly unequal oscillator strengths Fu et al. (2005).
IV.2 Transmission spectroscopy
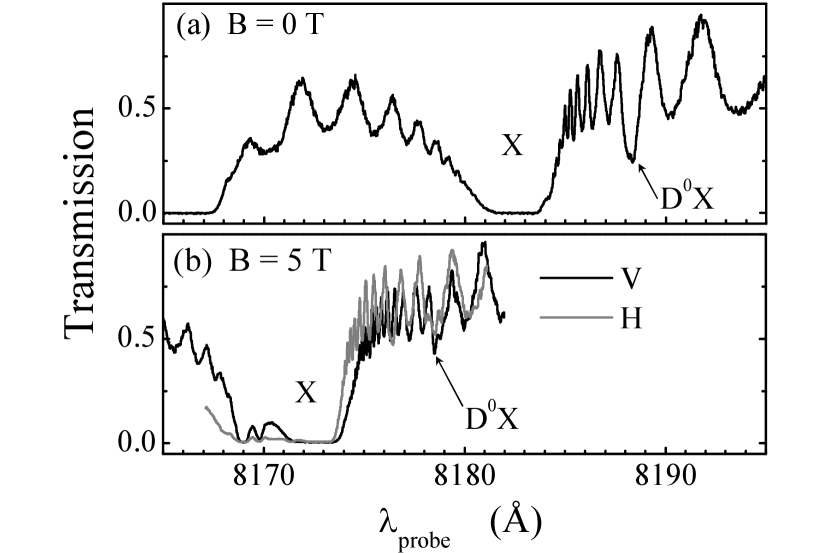
While photoluminescence is useful for initial characterization of a material and for finding the main spectral features, a more detailed characterization of the systems requires transmission spectroscopy with tunable CW lasers. A few results of this approach were already presented in Fig. 4 and discussed in Sec. III.1. Before performing such pump-assisted transmission spectroscopy on the systems, we first take scans with a single laser over a much larger wavelength region for finding the lines. Figure 6(a,b) show such transmission spectra taken with H and V-polarized probe light. These results show a strong free-exciton absorption band (labeled ), and weaker resonances. The oscillating background that is superimposed on the transmission spectra is due to a Fabry-Perot effect in the GaAs film, and its chirped wavelength dependence is due to the wavelength-dependent refractive index associated with the strong free exciton absorption. After locating the lines, we zoom in on this region for identifying the and transitions with the pump-assisted spectroscopy, as presented in Fig. 4(b,c).
IV.3 Electromagnetically induced transparency with donor-bound electrons
We identified the and transitions because it was our goal to investigate whether these could be used for implementing electromagnetically induced transparency (EIT) with electron spin coherence in a semiconductor. EIT is the phenomenon that an absorbing optical transition becomes transparent because destructive quantum interference with another driven optical transition prohibits populating the optically excited state Fleischhauer et al. (2005). This phenomenon lies at the heart of various quantum-optical control schemes that have been designed for preparing nonlocal entanglement between spins, quantum communication, and applying strong optical nonlinearities Duan et al. (2001); Fleischhauer et al. (2005).
EIT can occur with three-level systems as formed by the states , and (Fig. 4(a)), for which it is then essential that the two low-energy spin states can have a long-lived quantum coherence and that one can selectively address the two optical transitions. An ensemble of these systems can become transparent for a probe field that drives one of the transitions (in our case ) when this meets the condition for a two-photon Raman resonance with an applied control field (in our case driving of transition ). Under these conditions the systems are trapped in a dark state which is in the ideal case , where and are the Rabi transition frequencies of the control and probe field Fleischhauer et al. (2005); Wang et al. (2007). Photoluminescence studies on GaAs already showed that optical control can prepare systems in this dark state Fu et al. (2005).
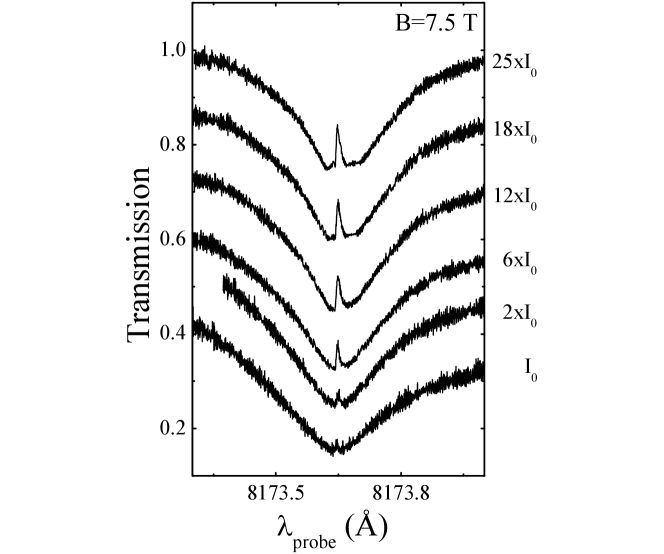
We could demonstrate EIT, and typical results are presented in Fig. 7. For these results we fixed the control laser on resonance with the transition (V polarization), while the probe laser is scanned across the transition (H polarization) and we measure its transmission. When the control and probe field meet the condition for two-photon Raman resonance (the difference in photon energy exactly matches the spin splitting), a narrow peak with enhanced transmission appears inside the broader absorption dip. This is the fingerprint of EIT. In Fig. 7 we present traces for various intensities of the control field. We observe a wider and higher EIT peak for stronger driving with the control field, in agreement with theory for EIT.
EIT relies on quantum coherence between the electron spin states, and in systems with a very long electron spin dephasing time EIT can fully suppress absorption. The EIT peak then reaches up to ideal transmission. The EIT peaks in Fig. 7 are clearly lower, even in the trace for the strongest control field. From fitting these EIT traces to the established theory Fleischhauer et al. (2005) we derive that the value for our system is about 2 ns, and this compromises the EIT peak height. This value is consistent with earlier work Fu et al. (2005); Clark et al. (2009) that showed that electron spin dephasing results from hyperfine coupling between each electron spin and fluctuating nuclear spins (the systems have a nm Bohr radius). Our EIT studies also showed weak signatures of dynamical nuclear polarization (DNP) which confirmed the role of nuclear spin fluctuations. We anticipate that can be enhanced with controlled DNP effects that suppress the nuclear spin fluctuations. A longer account of this EIT study can be found in Ref. Sladkov et al. (2010).
V Summary
We presented the realization of a fiber-based confocal microscope that can be used in a dilution refrigerator (base temperature well below 20 mK) with high magnetic field. Faraday rotations in optical materials were circumvented by using a polarization maintaining fiber and by having the light propagation in the sample volume in a direction orthogonal to the applied magnetic field. This also gives access to performing experiments in Voigt geometry, which has several advantages. With experiments on an ensemble of donor-bound electrons in GaAs we confirmed the ability to focus optical control fields with a small spot on any desired point of a sample. We also confirmed that pure linear polarizations can be delivered to the sample, and that this instrument can perform optical experiments at milliKelvin temperatures without excessive heating.
VI Acknowledgements
We thank B. Wolfs, A. Slachter, M. Schenkel, J. Sloot and A. Onur for contributions, and J. De Hosson and D. Vainchtein for lending of a spectrometer. Financial support by the Dutch NWO and FOM, and the German programs DFG-SPP 1285, BMBF nanoQUIT and Research school of Ruhr-Universität Bochum is acknowledged.
References
- Awschalom et al. (2002) D. D. Awschalom, D. Loss, and N. Samarth, Semiconductor Spintronics and Quantum Computation (Springer Verlag, Berlin, 2002).
- Zoller et al. (2005) P. Zoller, T. Beth, D. Binosi, R. Blatt1, H. Briegel, D. Bruss, T. Calarco, J. Cirac, D. Deutsch, E. J., et al., Eur. Phys. J. D 36 (2005).
- Southwell (2008) K. Southwell, Nature 453, 1003 (2008).
- Fu et al. (2005) K.-M. Fu, C. Santori, C. Stanley, M. Holland, and Y. Yamamoto, Physical Review Letters 95, 1 (2005).
- Atatüre et al. (2007) M. Atatüre, J. Dreiser, A. Badolato, and A. Imamoglu, Nature Physics 3, 101 (2007).
- Fu et al. (2008) K.-M. C. Fu, S. M. Clark, C. Santori, C. R. Stanley, M. C. Holland, and Y. Yamamoto, Nature Physics 4, 780 (2008).
- Press et al. (2008) D. Press, T. D. Ladd, B. Zhang, and Y. Yamamoto, Nature 456, 218 (2008).
- Berezovsky et al. (2008) J. Berezovsky, M. H. Mikkelsen, N. G. Stoltz, L. A. Coldren, and D. D. Awschalom, Science 320, 349 (2008).
- Greilich et al. (2009) A. Greilich, S. E. Economou, S. Spatzek, D. R. Yakovlev, D. Reuter, A. D. Wieck, T. L. Reinecke, and M. Bayer, Nature Physics 5, 262 (2009).
- Xu et al. (2009) X. Xu, W. Yao, B. Sun, D. G. Steel, D. Gammon, A. S. Bracker, and L. J. Sham, Nature 459, 1105 (2009).
- Brunner et al. (2009) D. Brunner, B. D. Gerardot, P. A. Dalgarno, G. Wüst, K. Karrai, N. G. Stoltz, P. M. Petroff, and R. J. Warburton, Science 325, 70 (2009).
- Latta et al. (2009) C. Latta, A. Hogele, Y. Zhao, A. N. Vamivakas, P. Maletinsky, M. Kroner, J. Dreiser, I. Carusotto, A. Badolato, D. Schuh, et al., Nature Physics 5, 758 (2009).
- Clark et al. (2009) S. Clark, K.-M. Fu, Q. Zhang, T. Ladd, C. Stanley, and Y. Yamamoto, Physical Review Letters 102, 3 (2009).
- van der Wal and Sladkov (2009) C. H. van der Wal and M. Sladkov, Solid State Sciences 11, 935 (2009).
- Imamoglu (2000) A. Imamoglu, Optics Communications 179, 179 (2000).
- Türeci et al. (2009) H. Türeci, M. Hanl, M. Claassen, A. Weichselbaum, T. Hecht, B. Braunecker, A. Govorov, L. Glazman, J. von Delft, and A. Imamoglu, arXiv (2009).
- Kleemans et al. (2010) N. A. J. M. Kleemans, J. van Bree, A. O. Govorov, J. G. Keizer, G. J. Hamhuis, R. Notzel, A. U. Silov, and P. M. Koenraad, Nature Physics 6, 534 (2010).
- Latta and et al. (2010) C. Latta and et al., to be published (2010).
- Hogele et al. (2008) A. Hogele, S. Seidl, M. Kroner, K. Karrai, C. Schulhauser, O. Sqalli, J. Scrimgeour, and R. J. Warburton, Review of scientific instruments 79, 023709 (2008).
- Purchased and data sheet from Schäfter und Kirchhoff (Germany) Purchased and data sheet from Schäfter und Kirchhoff (Germany), (http://www.sukhamburg.de).
- Munin et al. (1992) E. Munin, J. Roversi, and A. Villaverde, Journal of Physics D: Applied Physics 25, 1635 (1992).
- Valev et al. (2008) V. K. Valev, J. Wouters, and T. Verbiest, American Journal of Physics 76, 626 (2008).
- Robinson (1964) C. C. Robinson, Applied Optics 3, 1163 (1964).
- Duan et al. (2001) L. M. Duan, M. D. Lukin, J. I. Cirac, and P. Zoller, Nature 414, 413 (2001).
- Wang et al. (2006) J. J. Wang, L. Chen, X. Liu, P. Sciortino, F. Liu, F. Walters, and X. Deng, Applied Physics Letters 89, 141105 (2006).
- Karasyuk et al. (1994) V. Karasyuk, D. Beckett, M. Nissen, A. Villemaire, T. Steiner, and M. Thewalt, Physical Review B 49, 16381 (1994).
- Yablonovitch et al. (1987) E. Yablonovitch, T. Gmitter, J. Harbison, and R. Bhat, Applied Physics Letters 51, 2222 (1987).
- Sladkov et al. (2010) M. Sladkov, A. U. Chaubal, M. P. Bakker, A. R. Onur, D. Reuter, A. D. Wieck, and C. H. van Der Wal, Phys. Rev. B 82, 1121308(R) (2010).
- Bogardus and Bebb (1968) E. Bogardus and H. Bebb, Physical Review 176, 993 (1968).
- Fleischhauer et al. (2005) M. Fleischhauer, A. Imamoglu, and J. Marangos, Reviews of Modern Physics 77, 633 (2005).
- Wang et al. (2007) T. Wang, R. Rajapakse, and S. Yelin, Optics Communications 272, 154 (2007).