Behavior of test particles in the plasma sheath upon local bias and plasma switching
Abstract
Equilibrating gravitation by electric forces, microparticles can be confined in the plasma sheath above suitably biased local electrodes. Their position depends on the detailed structure of the plasma sheath and on the charge that the particles acquire in the surrounding plasma, that is by the electron and ion currents towards it. Bias switching experiments reveal how the charge and equilibrium position of the microparticle change upon altered sheath conditions. We observe similar particle behaviors also in the afterglow of the discharge for a persisting bias voltage on the electrode: damped oscillation into a new equilibrium or (accelerated) fall according to the bias.
pacs:
52.27.Lw, 52.80.Pi, 52.65.Rr, 52.40.KhI Introduction
At the powered electrode of an asymmetric rf-discharge, self biasing gives rise to a large potential drop, wide plasma sheath and strong electric fields. In contrast, the plasma sheath in front of grounded or additionally biased electrodes is less pronounced and thinner. The properties of such sheaths are, nevertheless, of fundamental interest in view of plasma processing of surfaces Boufendi and Bouchoule (2002); Kersten et al. (2005) and plasma chemistry. Ostrikov et al. (2001) Selective biasing of the substrate can be used to optimize the electron and ion impact energies and directions. Lieberman and Lichtenberg (2005)
Monitoring plasma characteristics in the sheaths is challenging, since common diagnostics, such as Langmuir-probes usually fail. This is because the macroscopic tip of a Langmuir-probe significantly alters the local plasma characteristics and cannot resolve density and potential gradients in the narrow sheath with adequate precision. In order to overcome these limitations, alternative diagnostics like optical spectroscopy Czarnetzki et al. (1999, 2005) or microparticles as probes Annaratone et al. (2003); Basner et al. (2009) are used. Those provide an efficient, nearly non-invasive tool for the local diagnostic of the plasma parameters. In view of their practical use, a calibration is necessary to discern their own charge dynamics from their capability to reflect the properties of the surrounding plasma.
Upon immersion in a plasma, microparticles get charged by electrons and ions that accumulate on their surface. Since the electron mobility exceeds those of the ions, the particle charge is in general negative, depending on the local conditions of the surrounding plasma. Albeit, it has been stressed that under certain conditions, such as in a discharge afterglow, microparticles in the bulk plasma can even acquire positive charges. Couëdel et al. (2006) While the plasma is operational, particle recharging takes place on longer time scale than the almost instantaneous reaction of the plasma to slightly modified external conditions. Then, the particle charge constantly remains in equilibrium with the surrounding electrons and ions. Drastic changes in the operating conditions, however, may perturb the time scale ordering and hinder an equilibration of the particle charge.
In this work, we investigate microparticles which are captured in the plasma sheath and their reaction to changes in the operating conditions of the plasma. Thereby, we focus on switching off the plasma while the lower discharge electrode is grounded or additionally biased as well as changing the bias voltage during operation of the plasma. The experimental results are discussed in view of a theoretical model that combines basic equations with input data from particle-in-cell (PIC) simulations.
II Experimental setup
The PULVA-INP setup Thieme et al. (2008) consists of an asymmetric, capacitively coupled rf-plasma in argon, working at neutral gas pressures from 0.1 Pa to 100 Pa. The rf-power () is supplied by the upper, powered electrode at a frequency of and amplitudes up to 1000 V. In dependence on the external parameters and , the obtained characteristics for the pristine argon plasma are electron densities , electron energies and plasma potentials with respect to the ground of . Tatanova et al. (2006) The overall plasma characteristics are monitored by Langmuir probe and plasma monitor measurements.
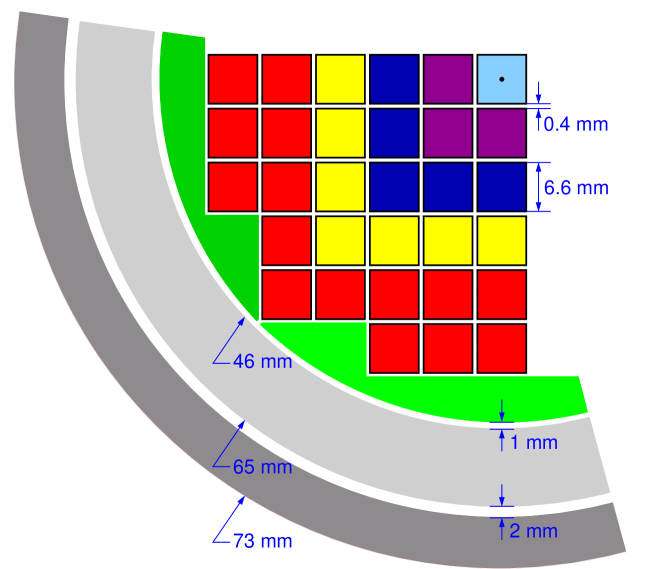
The key feature of the experimental setup is the lower, so called ‘adaptive’ electrode (AE). It consists of 101 square electrode segments (pixels) with a linear extension of each, separated by thin () isolating gaps (see Fig. 1). In addition, four larger segments fit the pixel geometry to the surrounding ring and ground shield. All 105 electrode pixels can be biased individually or in groups by an external dc-voltage of up to . The selective application of bias voltages to some pixels allows for studying spatial and temporal changes of the plasma sheath.Annaratone et al. (2003); Thieme et al. (2008) The small extension of the pixels as compared to the remaining grounded electrode guarantees that the applied bias only locally influences the plasma sheath but leaves the overall discharge conditions unaltered.
All experiments in this work refer to a plasma operating power and neutral gas pressure unless stated differently. The microparticles used as probes are melamine-formaldehyde (MF) spheres with diameter . With a mass density of for MF this results in a particle mass of . Illuminated by a laser fan (532 nm), their positions are recorded by a fast CCD camera (up to 2000 frames per second).
III Results and Discussion
In this work we report on three different experiments. Each one describes a particular way in which the equilibrium conditions for a levitating particle in the plasma sheath are perturbed. The initial position of the particle is determined by an equilibrium between gravitational and electrostatic forces. Neutral drag and thermophoresis effects are negligible. The effect of ion drag forces will be discussed in the experiments for which it is relevant.
III.1 Plasma afterglow – unbiased AE
In this experiment we start from an initial configuration where the MF-particle is trapped above the unbiased center pixel by a confining potential of on the surrounding pixels of the AE. At , the sheath width is about and the equilibrium position . Switching off the plasma, the electrostatic force no longer compensates gravity and the particle drops onto the AE. As compared to a freely falling particle, the drop is markedly retarded (see Fig. 2).

Along with the residual electric field, which decays over some , also the directed ion current towards the AE vanishes and ion drag can be neglected. The only forces relevant on the time scale of the fall (ms) are gravitation and neutral drag force . Here the damping constant depends on the local density of the background gas, which we assume to be constant in time. Then the equation of motion for the particle reads . The solution of this equation, subject to the initial conditions and is given by
| (1) |
where we introduced the normalized time . Depending on the argon gas pressure, the values of obtained by a least squares fit of (1) to the experimental data are in the range of to . This so called the Epstein friction coefficient Epstein (1924) can be related to the neutral gas pressure by
| (2) |
where is the thermal velocity of the argon gas atoms and is a parameter in the order of accounting for how the gas atoms are deflected from the particle surface. Nakamura and Ishihara (2008) Assuming a diffuse reflection, we obtain a theoretical value of for at room temperature, which is in good accordance with the values determined by the measurement. Furthermore, to describe our experimental data it is not necessary to adapt to the decaying neutral gas density in the discharge afterglow, as discussed in Ref. Couëdel et al., 2006. Within our accuracy a constant value of is sufficient.
Due to the vanishing electric field this experiment does not provide any information on the value or variation of the particle charge. In order to obtain information on this aspect, we have to resort to a slightly modified setup, retaining a static dc-bias at some pixels of the AE.
III.2 Plasma afterglow – biased AE
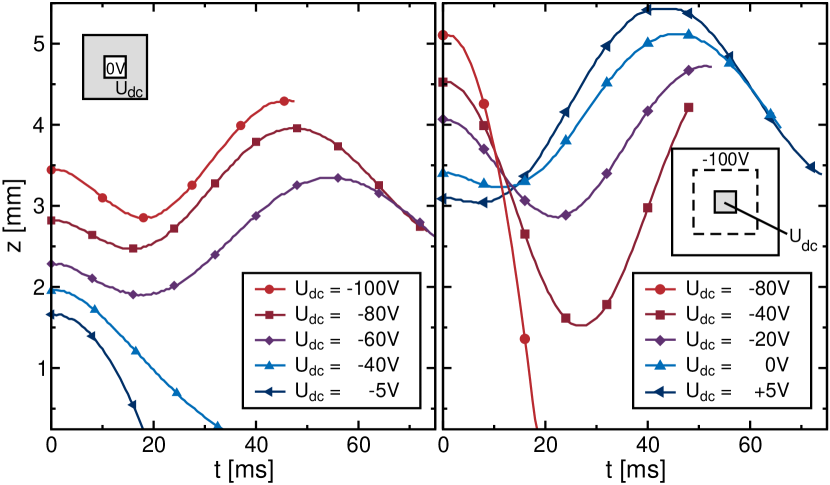
Extending the previous experiment, we start from various bias configurations of the AE by which we initially trap a particle. Clearly, the biased pixels locally warp the plasma sheath. Thus, the equilibrium positions (and presumably also the charges) of the particles differ for each case. The configurations for which the results are given in Fig. 3 differ in the number of biased pixels – for the left and for the right panel, respectively. The applied bias voltages exhaust the available range provided by the AE, resulting in weak to strong confinement. For weak confinement () we recover in the left panel of Fig. 3 the falling behavior observed in the previous experiment. Only for stronger negative bias () the persisting electric field is strong enough to keep the particle hovering above the AE. Note that the lengths of the recorded time intervals are limited by the particle horizontally leaving the camera focus. Their levitating state persists over several seconds. The particle trajectories in the right panel of Fig. 3 are shifted to markedly larger distances from the AE. This reflects the more pronounced widening of the plasma sheath by the larger area of strongly biased pixels. As long as the surrounding pixels are on a sufficiently negative bias, the particle levitation even persists for a moderate positive voltage on the center pixel. For a large negative bias (), however, switching off the plasma causes an abrupt drop of the particle, which is even accelerated as compared to a free fall.
In order to explain the observed behavior, a first idea would be to assume that on the observed time scales the plasma has completely decayed, i.e. all electrons and ions have already recombined. Then, the particle trajectory corresponds to the motion of a charged sphere between two parallel plates, that are the powered electrode and the AE. Using the superposition principle, we may calculate the electrostatic force acting on the particle in two steps. First, the self-force for a charged particle between two parallel, grounded planes is calculated analytically by means of an infinite series of image charges Jackson (1998) (see Appendix A). This contribution is, however, negligible for distances . Second, we numerically solve the boundary value problem and calculate the potential due to the biased electrode pixels. To this end, we reduce the simulation volume to a two-dimensional, cylindrically symmetric domain by smearing out the individual pixels to rings, and use routines from FISHPACK. Adams et al. In vertical direction the simulation volume covers the whole range between both electrodes. Radially, the simulation domain is such large that the boundaries do not affect the results near the center of the discharge. At we used vanishing radial field boundary conditions.
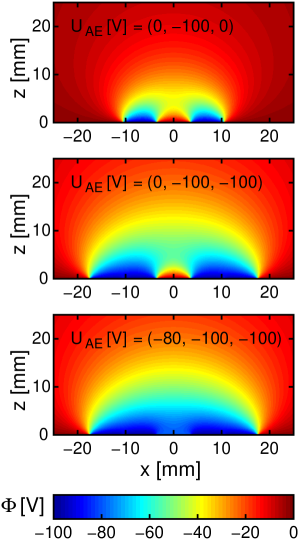
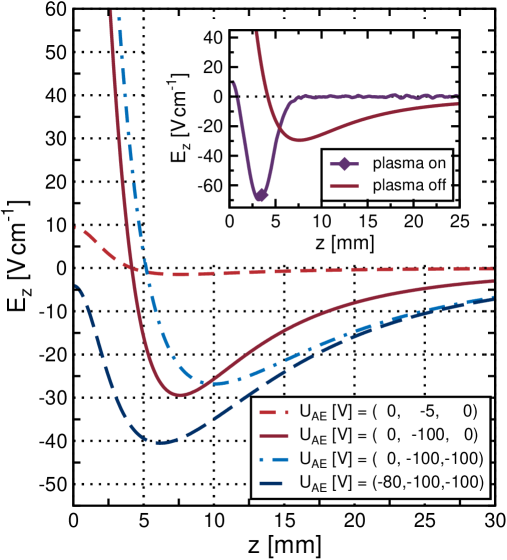
Due to rotational symmetry, the biasing of outer lying pixels influences the electrostatic potential above the center pixel to the point of generating a region with negative potential at finite (left panel of Fig. 4). Above an unbiased center pixel this gives rise to a potential structure with a minimum at . For strong negative biasing of the center pixel, , the potential along the symmetry axis monotonically increases with . The sign change of the electric field at implies that a negatively charged particle may only remain hovering for since there gravity and electrostatic force are antiparallel (right panel of Fig. 4). As compared to the case of operating plasma, the electric field after the switching off is markedly reduced (inset of the right panel of Fig. 4). Therefore, keeping up the force equilibrium requires an increasing of the particle charge. Whether the particle remains hovering or drops down onto the AE depends on its ability to acquire enough negative charges on a sufficiently short time scale. For systems with markedly higher operating pressures the relevant stages of a plasma decay have been identified by Couëdel et al. Couëdel et al. (2006), focussing on the bulk properties. The properties of the sheath in the afterglow of a pulsed inductively coupled rf-plasma in hydrogen have been addressed by Osiac et al. Osiac et al. (2007) For the locally biased plasma sheath the following aspect comes into play. After the switching off the periodic flooding of the sheath with electrons during each rf-period ceases, but electrons and ions continuously diffuse from the bulk into the sheath. Here, the flow of both species is controlled by the applied local bias voltages. The charge equilibrium in the sheath will vary only slightly as long as enough electrons and ions from the bulk enter the sheath to compensate losses at the wall. A particle adapts its charge to the altered electron- and ion density in surrounding on time scales of some .Matyash and Schneider (2006) Since this time scale is faster than the changes of the plasma sheath in the discharge afterglow, the particle charge constantly remains in equilibrium with the charge densities in its surrounding. In order to explain the accelerated fall for consider that due to the strong negative bias no electrons at all will be able to penetrate into the sheath above the center pixel anymore. Therefore, the exclusive presence of ions in the surroundings of the particle will drastically reduce its negative charge. One might even have to consider a positive recharging since gravity and ion drag force Barnes et al. (1992); Vladimirov and Tsytovich (1998); Vladimirov and Cramer (2000) are too weak to account for the observed behavior alone. The individual contributions to the total force causing the accelerated fall will be analyzed for the bias switching experiment in the next section.
III.3 Persisting plasma – bias switching

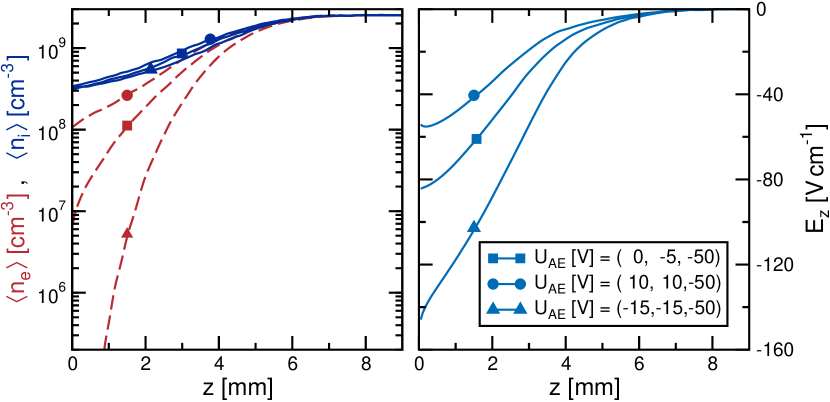
While switching off the plasma certainly alters the equilibrium conditions for the particle drastically, the changes in densities and fields occur on a moderate time scale. This is in contrast to the situation where the AE-pixel biasing is switched during operation of the plasma. Here, the local plasma sheath adapts within rf-cycles to the new biasing configuration and thus has an instantaneous impact on the charge and force equilibrium of the particle. In principle, a particle may be trapped into a stable equilibrium position for all indicated biasing configurations in Fig. 5, provided that the relaxation is performed smoothly. Upon an abrupt change from an initial configuration, however, the particle drops onto the AE outside a rather narrow region of bias variations (see inset of Fig. 5). This holds for either positive or negative voltages. Interestingly, again a strong negative bias leads to an acceleration of the particle towards the AE which is not explicable solely by gravity. For moderate changes in the biasing configuration the particle reaches its new equilibrium position through a damped oscillatory motion.
In order to describe the different behaviors quantitatively, we performed a PIC-simulation of the plasma discharge. Special emphasis is put on the local modifications of the plasma sheath by the AE-pixels. Details on the simulation can be found in Appendix B.
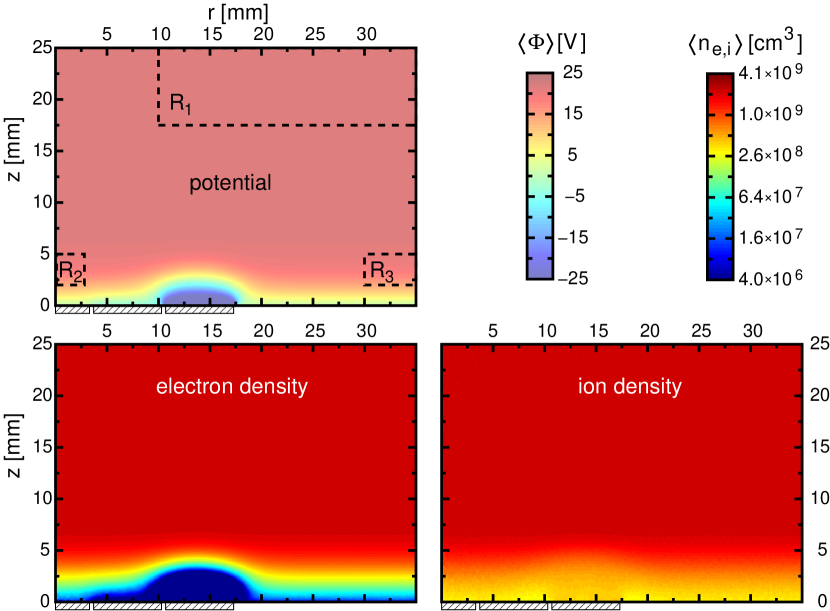
The initial AE-configuration in Fig. 5 only marginally disturbs the plasma sheath above the center pixel. Its primary purpose is to keep the particle in the camera focus. As can be seen from the simulation results in Fig. 6, both the electron and ion densities near the symmetry axis agree with those in the unperturbed sheath far away from the biased pixels. In this respect, the results for in Fig. 7 are representative for an unperturbed sheath. While the two-dimensional color plots in Fig. 6 provide a general overview of the sheath structure above the AE-pixels, Fig. 7 allows for a quantitative analysis on the symmetry axis. The time-averaged electron density is markedly reduced as compared to the ion density. Electrons may overcome the potential barrier of the plasma potential and enter the sheath only during a short fraction of an rf-period. This occurs, when the potential on the powered electrode is sufficiently negative to supply enough kinetic energy to the electrons. Upon additional negative biasing of an AE-pixel, the necessary energy for crossing the sheath increases. This results in a further reduction of the electron density since for most electrons the sheath becomes impenetrable. Having lost their kinetic energy already after some part of the sheath, they remain trapped in the plasma. Hence, above the negatively biased pixel, parts of the sheath may be completely deprived of electrons. Because of the continuity equation and acceleration of the ions towards the AE, their (time-averaged) density also decreases in the sheath. Their larger mass makes them less susceptible to further acceleration by additional biasing and therefore all ion densities nearly coincide. In contrast to switching off the plasma, which leads to wider final potential structures and weaker fields, a negative bias may drastically enhance the electric field in the sheath. This enhancement results from the dominance of the increased potential difference over the effect of sheath widening.
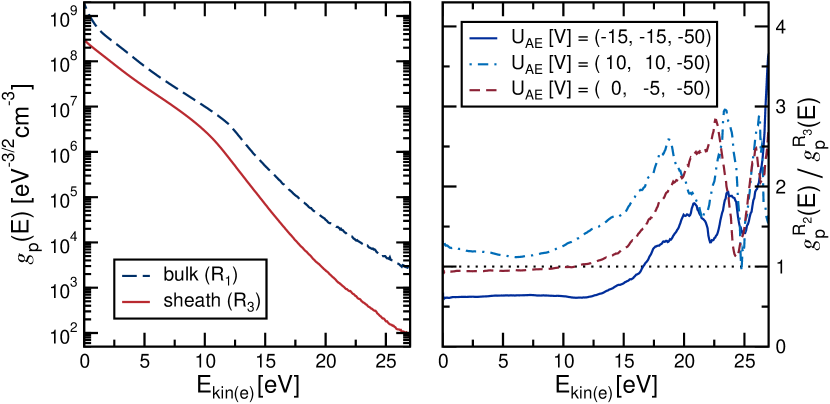
The density profile does not contain any information on the energy of the electrons in the sheath. Therefore, we calculate the electron energy probability distribution .Lieberman and Lichtenberg (2005) In Fig. 8 is given for three regions of the discharge, representing bulk, unperturbed sheath and sheath above a biased electrode pixel. The scales used in Fig. 8 are chosen such that a Maxwellian distribution results in a straight line. Then the electron temperature is proportional to the inverse slope and the crossing with the ordinate gives the species density. The obtained for the bulk closely resembles a bi-Maxwellian distribution with a larger fraction of cold and and a smaller fraction of higher energetic electrons. The latter one is due to those electrons that oscillate between the electrodes of the discharge. In the sheath, the density is reduced for all energies, but most pronounced in the high energy tail. This is due to the retardation caused by the potential difference the electrons encounter when crossing the sheath. As compared to the unperturbed sheath, above the center pixel clearly reflects the influence of the additional AE-biasing (right panel of Fig. 8). For energies up to the plasma potential, the density reduction (enhancement) for negative (positive) bias is uniform for all energies. The strong fluctuations at larger energies are due to poor statistics since only a tiny fraction of all electrons have energies in this range. Irrespective of the biasing on the center pixel, the confinement potential on the third shell of pixels increases the density in the high energy tail as compared to the unperturbed sheath through a channeling effect.

Explaining the accelerated fall of the particle quantitatively requires a careful analysis of all relevant forces. In order to extract the total force on the particle from the experimental trajectory, we performed a polynomial fit to the measured data (inset of Fig. 5) and calculated its second derivative. Due to the limited number of data points, the curvature data depend slightly on the order of the used polynomial, but they agree within 5% in the relevant time interval. Combining trajectory and time dependent force data, the total force on the particle is given as a function of distance above the AE in the upper panel of Fig. 9. Gravity is responsible for only about 10% of the observed particle acceleration. Also the ion drag force, which presumably becomes enhanced by the negative pixel biasing, contributes to the acceleration. It is given by
| (3) |
where , , are the ion mass, density and drift velocity. Accounting for the thermal motion of the ions, we define the effective velocity , where is the thermal ion velocity. In (3), the two contributions to the ion drag force correspond to momentum transfer due to collection of ions (index ) and Coulomb scattering (index ). The radii in the associated cross sections are given by Lieberman and Lichtenberg (2005)
| (4) |
where is the potential of the dust particle, and the permittivity of vacuum. The divergence of the Coulomb scattering cross section is circumvented by using a suitable cutoff beyond which passing ions are neglected Lieberman and Lichtenberg (2005); Barnes et al. (1992); Vladimirov and Cramer (2000); Khrapak et al. (2002). The shielding effect of the plasma suggests Vladimirov and Cramer (2000) to use the electron Debye length as cutoff, leading to the approximate Coulomb logarithm . Treating the dust particle as a spherical capacitor, its potential and charge are related by with .
Evaluating (3) requires knowledge about ion density and velocities in the sheath. These quantities are directly accessible by PIC and are shown in the lower panel of Fig. 9. Alternatively, the sheath parameters can be estimated from Child’s law Lieberman and Lichtenberg (2005). The large dc-bias applied to the AE pixel locally dominates the characteristics of the sheath and masks the rf-character of the global discharge there. Low pressure should permit the neglect of ion collisions in the sheath and due to the additional bias the sheath potential is much larger than the electron temperature. Yet, within Child’s law the sheath width is less than half the width of the PIC solution, with similar density and velocity profiles on this reduced scale. We attribute this discrepancy to the failure of Child’s law to account for the local disturbance of the plasma conditions by the pixel biasing. Using the PIC data, we may calculate the two contributions to the ion drag force for different particle charges (see upper right panel of Fig. 9). The bias switching instantaneously enlarges the sheath and thus the initial particle position is already deep inside the sheath. Irrespective of the particle charge, the collection radius in this region essentially coincides with the particle radius. Only extremely high charges can compensate the high ion velocity resulting in a noticeable second term under the square root in (4). The proportionality of the Coulomb scattering radius to the particle charge often results in a dominance of over . In the relevant region, however, the high values of result in a small prefactor and and become comparable for . Summing up both contributions, the resulting ion drag force for is given in the upper left panel of Fig. 9. Due to the quadratic dependence of on and , the curves for smaller are marginal on this scale. In order to explain the remaining difference to the measured total force, the only explanation seems to be a positive recharging of the particle. The resulting electric field forces for selected positive charges are given in left panel of Fig. 9. An explanation of the observed behavior requires a gradual charging to during the fall. Crucial for this recharging procedure are: (i) absence of any electrons in the vicinity of the particle during the whole rf-cycle, which is guaranteed by the large negative pixel biasing; (ii) instantaneous sheath widening and location of the particle deep inside the widened sheath. Then the accelerated ions may acquire high enough energies to reach the particle surface, even for a positively charged particle.
IV Conclusions
In this work we studied the behavior of a microparticle in the plasma sheath upon abrupt changes of the local plasma conditions. Thereto, we combine experimental studies with theoretical modeling and numerical simulations. Local perturbations of the plasma sheath in front of biased segments of the ’adaptive electrode’ are monitored by the behavior of microparticles. Hereby, special emphasis is put on the particle dynamics upon bias switching and in the afterglow of the discharge. Relaxation into a new equilibrium position is a markedly slower process than the adaption of the particle charge to the local electron and ion densities. Whether a particle remains hovering above a biased segment or drops down depends on the charge equilibrium imposed by the altered plasma conditions in its vicinity. Slight changes of the plasma conditions initiate a damped oscillation of the particle into a new equilibrium position. Drastically increasing the negative bias of a pixel, locally the sheath may be deprived completely of electrons. This out-of-equilibrium situation may disturb the particle’s charge balance to the point of a positive recharging. The resulting downward force might explain the observed additional acceleration. Gravity and ion drag force alone are too weak to account for this behavior.
Acknowledgements
This work has been supported by the Deutsche Forschungsgemeinschaft under SFB-TR 24, projects A5 and B4. We would like to thank F. X. Bronold, K. Matyash and R. Schneider for helpful discussions.
Appendix A Particle self-force
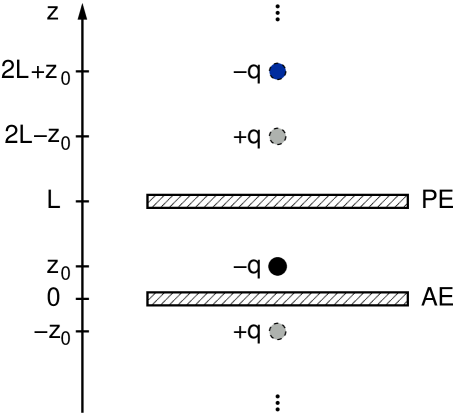
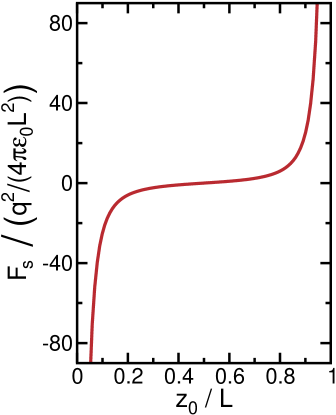
Summing up the contributions of all image charges in Fig. 10, we get
| (5) |
with , where the floor function returns the largest integer that is not greater than its argument, e.g., . The infinite sum in (5) may be evaluated and with and the trigamma function we get
| (6) |
In the right-hand panel of Fig. 10 we show as a function of distance from the AE. For the relevant parameters (, ) the prefactor in (6) is six orders of magnitude smaller than the gravitational force acting on the considered particle. Thus, is negligible except for the vicinity of the electrodes at which (6) diverges. For the above parameters gravity and become comparable for .
Appendix B Details on PIC simulation
All presented simulation results have been calculated using an electrostatic PIC code. Since simulating the whole reactor vessel is infeasible, we restricted the simulation volume to the relevant region above the AE (, ). By suitable choice of the substitute discharge parameters we ensured bulk plasma conditions in accordance with the experimental ones, , , . While the obtained plasma potential and densities deviate from their target values less than 1%, they are slightly larger for the electron temperature.
Adopting the general code structure and null-collision method Birdsall (1991); Vahedi and Surenda (1995) from the xpdp2 code suite, Vahedi et al. (1993); Vahedi and DiPeso (1997) our code has been tailored to match the specific requirements: rotational symmetry, inclusion of the AE, individual particle weighting, OpenMP-parallelization). The neglect of Coulomb collisions between charged species can be justified by the low degree of ionization () for the considered experimental conditions. Thermal motion of the fixed background gas is taken fully into account for ion neutral collisions while being neglected for electron neutral collisions due to the large mass ratio and thus faint momentum transfer. The solution of the Poisson equation is performed by means of Fourier accelerated cyclic reduction Swarztrauber (1977) as implemented, e.g., in FISHPACK Adams et al. . We ensured numerical stability of our results for the considered grid sizes () by using double precision variables for the potential and charge density. The constant grid spacing of is smaller than half the Debye length. By choosing a time step of we ensure , where is the plasma frequency. Respecting these constraints, the PIC method provides reliable results. Tskhakaya et al. (2007) Modeling a vertical cut through the reactor vessel, symmetry implies a vanishing electric field at the inner boundary, , of the simulation volume. At the outer boundary, , we assume vanishing electric field boundary conditions since the lateral dimension of the simulation volume covers only a fraction of the powered electrode. In order to model the AE, each pixel has been associated to an individual external circuit, and the charge balance is calculated in each iteration. A linear weighting scheme for particle deposition to the grid and interpolation of the electric field ensures conservation of momentum and absence of self-forces. The -dependence of the volume elements in cylindrical coordinates leads to a drastically varying number of superparticles in each cell when describing a constant density. Alternatively, additional weighting factors for each superparticle may compensate for this Soria-Hoyo et al. (2008). Thereby, the statistics can be markedly improved since the initial number of superparticles in all cells is balanced. Throughout this work we used a mean number of superparticles per cell of . Note that these individual weighting factors have to remain constant during the whole simulation in order to ensure conservation of energy and momentum and absence of self-forces. As a consequence of the experimental setup, the main particle motion is in -direction. Radially, the particles remain within nearby cells of their initial position. Thus, we are in the lucky position that the statistical advantage due to the individual weighting decays only slowly with time.
In the experiment the AE-biasing does not influence the global discharge parameters but only locally disturbs the plasma sheath. This behavior reflects the small ratio of biased electrode to wall surface. The restricted size of the simulation volume implies a more pronounced impact of the AE-pixels on the bulk plasma due to the larger surface ratio. Nevertheless, the numerical bulk quantities with and without AE-biasing differ only by around 1%.
References
- Boufendi and Bouchoule (2002) L. Boufendi and A. Bouchoule, Plasma Sources Sci. Technol. 11, A211 (2002).
- Kersten et al. (2005) H. Kersten, G. Thieme, M. Fröhlich, D. Bojic, H. T. Tung, M. Quaas, H. Wulff, and R. Hippler, Pure Appl. Chem. 77, 415 (2005).
- Ostrikov et al. (2001) K. N. Ostrikov, S. Kumar, and H. Sugai, Phys. Plasmas 8, 3490 (2001).
- Lieberman and Lichtenberg (2005) M. A. Lieberman and A. J. Lichtenberg, Principles of plasma discharges and materials processing (John Wiley & Sons, Hoboken, New Jersey, 2005), 2nd ed.
- Czarnetzki et al. (1999) U. Czarnetzki, G. A. Hebner, D. Luggenhölscher, H. F. Döbele, and M. E. Riley, IEEE Transactions on Plasma Science 27, 70 (1999).
- Czarnetzki et al. (2005) U. Czarnetzki, D. Luggenhölscher, V. Kadetov, and H. F. Döbele, Pure Appl. Chem. 77, 34 (2005).
- Annaratone et al. (2003) B. M. Annaratone, M. Glier, T. Stuffler, M. Raif, H. M. Thomas, and G. E. Morfill, New J. Phys. 5, 92 (2003).
- Basner et al. (2009) R. Basner, F. Sigeneger, D. Loffhagen, G. Schubert, H. Fehske, and H. Kersten, New J. Phys. 11, 013041 (2009).
- Couëdel et al. (2006) L. Couëdel, M. Mikikian, L. Boufendi, and A. A. Samarian, Phys. Rev. E 74, 026403 (2006).
- Thieme et al. (2008) G. Thieme, R. Basner, R. Wiese, and H. Kersten, Faraday Discuss. 137, 157 (2008).
- Tatanova et al. (2006) M. Tatanova, G. Thieme, R. Basner, M. Hannemann, Y. B. Golubovskii, and H. Kersten, Plasma Sources Sci. Technol. 15, 507 (2006).
- Epstein (1924) S. Epstein, Phys. Rev. 23, 710 (1924).
- Nakamura and Ishihara (2008) Y. Nakamura and O. Ishihara, Rev. Sci. Instrum. 79, 033504 (2008).
- Jackson (1998) J. D. Jackson, Classical Electrodynamics (John Wiley & Sons, New York, 1998), 3rd ed.
- (15) J. Adams, P. Swarztrauber, and R. Sweet, FISHPACK – efficient FORTRAN subprograms for the solution of separable elliptic partial differential equations, URL http://www.cisl.ucar.edu/css/software/fishpack.
- Osiac et al. (2007) M. Osiac, T. Schwarz-Selinger, D. O’Connell, B. Heil, Z. Petrovic, M. M. Turner, T. Gans, and U. Czarnetzki, Plasma Sources Sci. Technol. 16, 355 (2007).
- Matyash and Schneider (2006) K. Matyash and R. Schneider, J. Plasma Phys. 72, 809 (2006).
- Barnes et al. (1992) M. S. Barnes, J. H. Keller, J. C. Forster, J. A. O’Neill, and D. K. Coultas, Phys. Rev. Lett. 68, 313 (1992).
- Vladimirov and Tsytovich (1998) S. V. Vladimirov and V. N. Tsytovich, Phys. Rev. E 58, 2415 (1998).
- Vladimirov and Cramer (2000) S. V. Vladimirov and N. F. Cramer, Phys. Rev. E 62, 2754 (2000).
- Khrapak et al. (2002) S. A. Khrapak, A. V. Ivlev, G. E. Morfill, and H. M. Thomas, Phys. Rev. E 66, 046414 (2002).
- Birdsall (1991) C. Birdsall, IEEE Transactions on Plasma Science 19, 65 (1991).
- Vahedi and Surenda (1995) V. Vahedi and M. Surenda, Comp. Phys. Comm. 87, 179 (1995).
- Vahedi et al. (1993) V. Vahedi, C. K. Birdsall, M. A. Liebermann, G. DiPeso, and T. D. Rognlien, Phys. Fluids B5, 2719 (1993).
- Vahedi and DiPeso (1997) V. Vahedi and G. DiPeso, J. Chem. Phys. 131, 149 (1997).
- Swarztrauber (1977) P. Swarztrauber, SIAM Review 19, 490 (1977).
- Tskhakaya et al. (2007) D. Tskhakaya, K. Matyash, R. Schneider, and F. Taccogna, Contrib. Plasma Phys. 47, 563 (2007).
- Soria-Hoyo et al. (2008) C. Soria-Hoyo, F. Pontiga, and A. Castellanos, J. Phys. D: Appl. Phys 41, 205206 (2008).