Constraining the Redshift Evolution of FIRST Radio Sources in RCS1 Galaxy Clusters
Abstract
We conduct a statistical analysis of the radio source population in galaxy clusters as a function of redshift by matching radio sources from the Faint Images of the Radio Sky at Twenty-Centimeters (FIRST) catalog with 618 optically-selected galaxy clusters from the first Red-Sequence Cluster Survey (RCS1). The number of excess radio sources (above the background level) per cluster is for clusters with and is for clusters with . The richest clusters in the sample have more radio sources than clusters with low or intermediate richness. When we divide our sample into bins according to cluster richness, we do not observe any significant difference () in the number of radio sources per unit of cluster mass for the galaxy clusters with as compared to the galaxy clusters with . Thus the entire sample can be characterized by the number of (L W Hz-1) radio sources per unit (1014 M⊙) mass, which we measure to be 0.0310.004. We further characterize the population of galaxy cluster-related radio sources through visual inspection of the RCS1 images, finding that although the radio activity of brightest cluster galaxies (BCGs) also does not strongly evolve between our high and low redshift samples, the lower-redshift, richest clusters are more likely to host radio-loud BCGs than the higher-redshift, richest clusters or poorer clusters at the 2- level.
1 Introduction
Historically, observing the environments of powerful radio sources has been a useful method of finding high-redshift galaxy clusters (e.g., Dickinson, 1994). Also, much detailed study has been done of the radio source population in nearby galaxy clusters (e.g., Ledlow, 1994; Owen, Ledlow & Keel, 1995; Ledlow & Owen, 1996). Now that uniformly selected samples of more distant galaxy clusters exist, we can address the redshift evolution of the population of radio sources in galaxy clusters; that is, given a complete sample of galaxy clusters, how many of them contain powerful radio sources as a function of cosmic time? The answer has implications for galaxy formation, galaxy cluster physics and the selection function of large SZ-selected galaxy cluster surveys.
Heating from powerful radio jets of AGN is one feedback mechanism invoked to explain the observed X-ray properties of the centers of galaxy clusters (Binney & Tabor, 1995; McNamara & Nulsen, 2007, for a review). Studies such as Burns (1990), Eilek (2004) and Mittal et al. (2009) have provided evidence that most (and maybe all) galaxy clusters with X-ray cooling cores also contain powerful radio-loud AGN in their brightest cluster galaxies (BCGs), suggesting that the radio activity of the black hole of the central galaxy is linked to the thermodynamics of the cluster gas near the core. Thus, understanding how the population of radio-loud AGN is related to cluster mass and how this population evolves with redshift is important to understanding the energy budgets in the gaseous cluster cores. Radio-loud AGN feedback may also be important in galaxy evolution. For example, applying semi-analytic models to the output from the Millenium Simulation, Croton et al. (2006) found that not only do radio AGN solve the problem of the over-cooling of gas in the cores of galaxy clusters, but that the feedback from radio AGN affects the colors, morphologies and stellar ages of the massive galaxies in clusters, bringing them into better agreement with observations than models without such feedback.
Current experiments such as the South Pole Telescope and the Atacama Cosmology Telescope use the Sunyaev Zel’dovich (SZ) effect to discover galaxy clusters (Vanderlinde et al., 2010; Menanteau et al., 2010). These experiments operate at millimeter and sub-millimeter wavelengths and take advantage of the SZ effect’s nominal independence from cluster redshift. While most 1.4 GHz radio sources have little power at such high frequencies, a population of radio sources with flat or inverted spectra could contaminate these surveys (see Lin et al., 2009, for an investigation of the spectral properties of cluster radio sources). Little is currently known about the redshift evolution of the radio sources associated with galaxy clusters, but it could affect the cluster sample selection as a function of redshift for these surveys (Lin & Mohr, 2007); investigating the redshift evolution of the radio source population in clusters even at 1.4 GHz provides a useful constraint to high frequency experiments.
In this paper, we study the population of radio sources from the Faint Images of the Radio Sky at Twenty-Centimeters (FIRST) survey that lie within the projected inner 0.5 Mpc of galaxy clusters from the first Red-Sequence Cluster Survey (RCS1; Gladders & Yee, 2005). The optically selected RCS1 galaxy cluster sample is well-characterized over a wide range in redshift (0.35 to 0.95; Gladders et al., 2007), allowing us to systematically address the evolution of the galaxy clusters’ radio source population using a uniformly selected sample.
Throughout this work we assume a flat CDM cosmology with WMAP-5 parameters: , , and (Hinshaw et al., 2009).
2 Data
2.1 Red-Sequence Cluster Survey
The RCS1 data cover a total of about 90 square degrees in the RC and filters. The data were taken at the Canada-France-Hawaii Telescope (CFHT) and the Cerro Tololo Inter-American Observatory (CTIO) 4m. Gladders & Yee (2005) describe the details of the data acquisition, data reduction and galaxy cluster survey generation and characteristics. The survey is designed to take advantage of the red sequence cluster detection algorithm (Gladders & Yee, 2000).
In this sample, galaxy cluster centers are determined by the center of light from red galaxies, and redshifts for the galaxy clusters are computed using observed red-sequence colors. The redshifts are typically accurate to better than 0.05 for , as indicated by follow-up spectroscopy (Blindert, 2006) and modeling of the RCS data (Gladders et al., 2007). See Gladders & Yee (2005) for details on the derivation and uncertainties on these properties. The cluster richness parameter Bgc is used as a mass proxy and is defined as the amplitude of the galaxycluster center correlation function, which scales as the number of galaxies within 0.5 Mpc (evaluated for ) of the cluster center normalized by the galaxy luminosity function and spatial distribution. Yee & Ellingson (2003) show that Bgc scales well with other mass proxies using the CNOC cluster sample. They empirically derived the following relation based on dynamically determined mass measurements in order to convert from richness to cluster mass, which we have scaled to give us for :
| (1) |
We use Bgc,R (calculated with ), which is derived using galaxies in the red sequence. Bgc,R is expected to trace the cluster mass over a wider redshift range than Bgc, as the red galaxies evolve slowly and the cluster red sequence was well in place by . Bgc,R is less likely to be affected by variations and evolution in the blue fraction of cluster galaxies. Indeed the cosmological analysis of the RCS1 survey does not detect evolution in the mass-richness relation (although the constraints are weak; Gladders et al., 2007). Because the above mass-richness relation was derived for Bgc rather than Bgc,R, we have applied a correction factor of 1.23 to the Bgc,R measurements when we calculate mass from richness. We empirically determined this factor by using both Bgc,R and Bgc for the 212 clusters in our sample which overlap with the redshift range of the CNOC clusters () and calculating the mean ratio of the two richnesses. See Yee & López-Cruz (1999) for a comparison between Abell richness class and Bgc (the median Bgc,R of a cluster with Abell richness class 0 is about 1090 for ).
We impose a richness cut so that only galaxy clusters with B are included. We also require that the uncertainty on the richness be less than half the richness value and that the significance of each cluster detection be greater than 3.3 . This significance limit was applied in the cosmological study of the RCS (Gladders et al., 2007), which found that for clusters above this limit, the contamination rate is . The redshift range for the clusters is restricted to 0.35 to 0.95. The resulting subsample of galaxy clusters is well-defined within a cosmological context over this broad redshift interval, as we are using the same sample constraints used in the cosmological analysis of the RCS1 survey (Gladders et al., 2007).
The combined area of overlap between the RCS1 and the FIRST surveys is about 40 square degrees. We limit the cluster sample so that it contains only galaxy clusters that are within and further than from the edge of the FIRST survey, which is just greater than 10 Mpc at a redshift of 0.3. Because we also limit our cluster sample to clusters with , the 10 Mpc area surrounding each cluster in our sample fully lies within the footprint of the FIRST survey (thus, we may use a 10 Mpc annulus around the clusters’ centers when calculating the background level of radio sources, see section 3.1.1).
Constraining the RCS1 cluster catalog in this way yields a sample of 618 galaxy clusters.
2.2 FIRST Radio Survey
The FIRST survey was conducted at the National Radio Astronomy Observatory (NRAO) Very Large Array (VLA) by Becker, White, & Helfand (1995). The survey consists of observations at 1.4 GHz. The VLA was in its B configuration, giving the resulting maps a resolution of 5″. The survey reached a point source sensitivity depth of 1.0 mJy. Radio sources were selected and cataloged by White et al. (1997). Source positions are accurate to better than 1″, enabling matches to individual optical objects in many cases. Because of the high resolution of the survey data, radio sources that are extended, particularly radio sources with double lobe morphologies, are often resolved and counted as multiple radio sources. We address these multiple component radio sources in section 3.2.4.
3 Analysis and Results
3.1 Statistical Analysis of Radio Sources around Clusters
3.1.1 Methods
Radio luminosity is calculated from flux using the following relation: , where we assume a spectral index of where . According to this relation, a radio source at the flux limit of the FIRST survey (1 mJy) and at the redshift limit we are imposing on the RCS1 survey () would have a luminosity of W Hz-1, so we adopt this as our luminosity cutoff. At this luminosity it is likely that radio emission is dominated by AGN activity rather than star formation, as radio sources dominated by star formation mostly lie below W Hz-1 (Mauch & Sadler, 2007). While there is some evidence that this crossover limit in the radio luminosity function evolves with redshift, our sample is still well above the limit even at (Owen, Strazzullo, & Pannella, 2009). Also, it has been shown in nearby clusters that the crossover between the populations is fainter in clusters than in the field (Miller & Owen, 2002), further ensuring that cluster radio sources brighter than the luminosity limit we apply are dominated by AGN emission.
For each galaxy cluster in our sample, we identify all nearby FIRST radio sources. The cluster redshift is used to determine the corresponding position (in proper megaparsecs) with respect to the cluster center and luminosity for all of these nearby radio sources. The luminosity cutoff determined above is then imposed so that only radio sources above this luminosity limit are counted in this statistical analysis. We repeat this procedure for every galaxy cluster in the sample, compiling the list of positions and luminosities for all radio sources around all clusters. Adopting the cluster redshifts for background and foreground radio sources does not bias our results in any way because we use the resulting positions and luminosities of radio sources with respect to the clusters to statistically determine the background level for the sample.
Because of the high resolution of the FIRST data, extended sources (for example, two lobes of an AGN) are split into multiple sources in the catalog. These sources are thus counted twice in this statistical analysis. Also, if a radio source is nearby two galaxy clusters, it will be counted twice, once for each cluster. We addressed these issues by visually inspecting the galaxy clusters that contain radio sources within a projected 0.5 Mpc; see section 3.2. While there were 16 galaxy clusters with centers within 0.5 Mpc of another galaxy clusters as determined at the redshift of one cluster (7 of which were pairs, 2 of which were within 0.5 Mpc of other clusters according to their redshifts but not according to the other clusters redshifts), no radio sources overlapped between two different clusters.
In order to calculate the background level of radio sources, we determine the number of radio sources above the luminosity cutoff (with the radio source luminosities determined for the cluster redshifts as discussed above) in a 5 to 10 Mpc annulus around the cluster centers. We extrapolate this constant background surface density of radio sources to the inner cluster regions, subtracting the background contribution to calculate the number of excess radio sources. The uncertainties are calculated assuming Poisson statistics for both the background and the signal. Figure 1 shows the signal-to-noise ratio in radial bins around the clusters’ centers of the number of excess radio sources above the background level.
As can be seen in the figure, most of the excess radio sources are within 0.5 Mpc of the cluster center, so we define our statistical sample of radio sources in galaxy clusters as the excess number of radio sources within a projected radius of 0.5 Mpc of the clusters’ centers. The total number of radio sources (including background sources) that we find within 0.5 Mpc of clusters’ centers is 111, which is significantly higher than the background, from which we would expect . The cluster with the highest number of radio sources within 0.5 Mpc has 4, although 3 of these are multiple components of the same radio galaxy. For a discussion of the frequency of multiple radio sources (both independent and multiple components) in clusters, see section 3.2.4.
Correctly handling the background population of radio sources is important in this analysis because the lower redshift objects subtend more area of sky than high redshift objects, so poor background estimation could mock redshift evolution. We check our background estimation against a bootstrap analysis in which we calculated the number of radio sources around random positions within the area of overlap between RCS1 and FIRST. Restricting this analysis to the survey region ensures that we did not sample more or less sensitive regions of the FIRST survey than our data cover so that unevenness in radio coverage does not affect our background estimation. We assigned each random position a “redshift” drawn from the actual cluster redshifts of the galaxy clusters. The background-subtracted number of radio sources per random position is consistent with zero. This remains true for both the random positions that were assigned redshifts less than 0.65 and for random positions that were assigned redshifts greater than 0.65. Thus, we see no evidence for large scale structures correlated on scales of 5 to 10 Mpc from the clusters’ centers biasing the background level we calculate, and we do not see any bias from the background calculation that could introduce discrepancies between the high and low redshift samples.
3.1.2 Redshift Evolution
The total number of radio sources within 0.5 Mpc of clusters’ centers in our low redshift (0.35 z 0.65) sample is 62 radio sources in 331 galaxy clusters, and in our high redshift (0.65 z 0.95) sample is 49 radio sources in 287 clusters. The number of excess radio source components per cluster (after background subtraction) is 0.14 0.02 for the low redshift sample and 0.10 0.02 for the high redshift sample. Errors are estimated assuming Poisson statistics in the signal and background number of radio sources. The significance of the difference between the high and low redshift samples is . Thus, the level of evolution in this sample is constrained to be small (especially in comparison with the evolution in cluster X-ray AGN, see discussion in section 4.1).
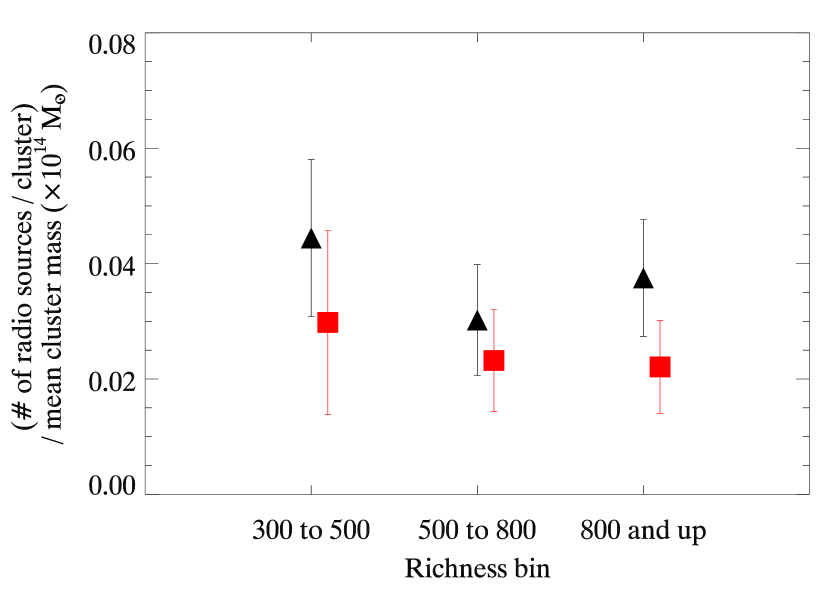
An important correlation we notice in our data (which has been previously noted, see for example Best, 2007) is that the richest clusters are more likely to host a radio source than poorer clusters (see Figure 2). In order to investigate whether there are differences in the high and low redshift radio source populations in clusters of similar mass, we split our galaxy clusters into three bins according to cluster richness (Figure 3). The Bgc,R values of 300, 500, and 800 correspond to masses of M⊙, M⊙, and M⊙, respectively. There are 181 clusters with Bgc,R between 300 and 500 at low redshift (0.35 to 0.65) and 121 at high redshift (0.65 to 0.95), there are 110 clusters with richnesses between 500 and 800 at low redshift and 122 at high redshift, and there are 40 clusters with Bgc,R 800 and up at low redshift and 44 at high redshift. See Figures 4 and 5 for the distributions of the redshifts and richnesses of the galaxy clusters. We note that the scatter in the mass-richness relation is considerable, so for any one cluster the mass is not well measured.
When we normalize the number of radio sources per cluster by the average mass, as derived from richness, for each richness bin, the number of radio sources per unit of cluster mass is roughly constant, with a value of per 1014 M⊙. Because the masses are derived from optical richnesses, this implies that the number of radio sources per cluster galaxy is constant, as has been noted in previous studies (Ledlow & Owen, 1995). Comparing the normalized excess counts of radio sources per cluster, we find that the low-redshift clusters have more radio sources per unit mass than the high-redshift clusters at the 1.5 level. This may be driven by a similar trend in the frequency of radio activity in the clusters’ BCGs (see below, section 3.2.2); however, the significance of the difference is low. Alternatively, the data constrain the redshift evolution to be small. The 1- uncertainty on the number of radio sources per unit mass for each bin in redshift and richness ranges from 27 to 53 of the signal, making evolution by factors of a few unlikely.
3.2 Visual Inspection
3.2.1 Methods
To supplement our statistical analysis, we visually inspected images from the RCS1 survey data of the galaxy clusters in our sample. We did this for a number of reasons: to better investigate the relationship between the brightest cluster galaxies (BCGs) and the radio sources, to determine the frequency of multiple radio sources within single galaxy clusters, and to identify radio sources that are obviously associated with foreground or background galaxies.
When visually inspecting the cluster images, we considered the cluster redshifts and richnesses, and we identified bright potential cluster members. Each cluster’s center is defined as the center of red light, not a BCG position. BCG candidates were identified according to the following criteria: central position in the cluster, morphological appearance, position in the color-magnitude diagram, and the presence of satellites or an extended halo of optical light. While in principle we could simply select the brightest galaxy within some distance from the cluster center and with some color near the red sequence, we are more intereseted in the central galaxy of the galaxy cluster, and in practice the identification of this can be ambiguous. For example, there may be two bright central galaxies where one is slightly brighter, but another is more central and has nearby satellite galaxies. Or the brightest, dominant galaxy could be offset from the cluster center, particularly for clusters with extended or disturbed morphologies. Sometimes multiple candidates were identified as possibilities.
Radio sources were also visually inspected. Radio sources were matched to optical counterparts when possible, and radio morphology was noted.
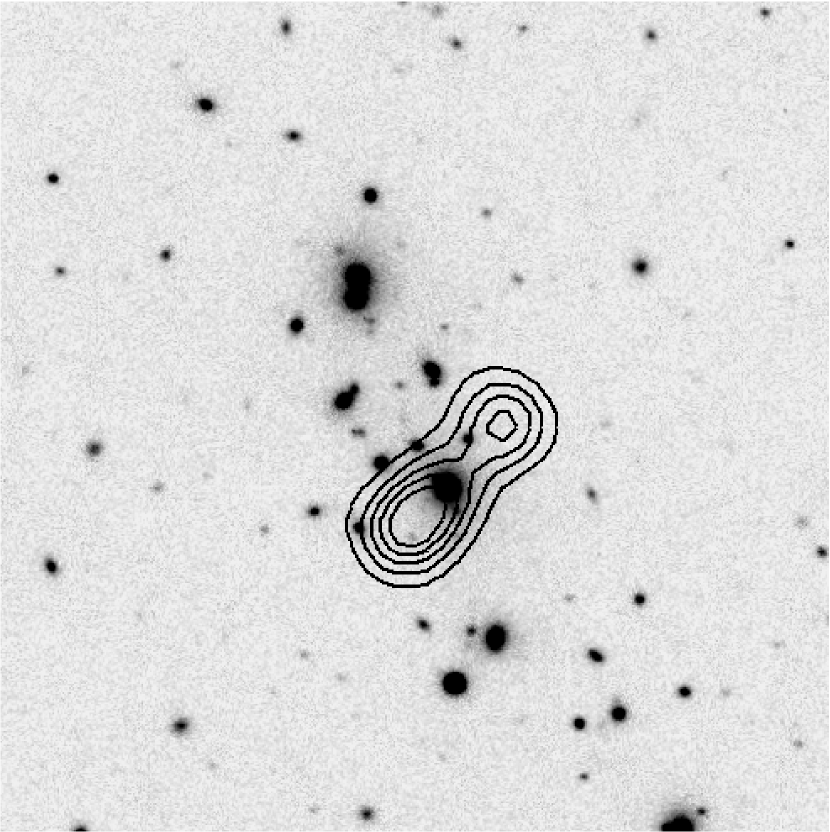
As an example of the benefits of this visual inspection of the cluster images, Figure 6 shows the radio emission in the galaxy cluster RCS1 J132655+302112. This galaxy cluster is at redshift 0.37 and has a Bgc,R of 1425 (corresponding to M M⊙). In this example, two components of an extended radio source are identified as sources in the FIRST catalog. These radio sources appear to be two lobes radiating from a bright central galaxy, a good BCG candidate located about 0.1 Mpc from the cluster center (as identified by the center of the red galaxies’ light.) Visual inspection identifies this system, but simply matching individual radio sources with individual optical objects using a small radius of tolerance could miss sources like these. This example demonstrates the usefulness of characterizing the population by eye in order to better understand the nature of the population. Of course, both of the components of this radio source are within the central 0.5 Mpc of the galaxy cluster, so this was easily identified in the statistical sample.
3.2.2 Radio-loud BCGs
Previous studies have shown that BCGs are more likely to be radio-loud than other galaxies of similar stellar mass (Best, 2007), indicating a difference in the radio-loud BCG population relative to the general cluster radio source population. We investigate whether there is a redshift evolution or cluster mass dependence in the radio activity of the BCGs in our sample.
Figure 7 shows the fraction of galaxy clusters, divided into bins according to richness and redshift, that contain radio-loud BCGs. Poisson error bars are plotted. We find that the fraction of radio-loud BCGs does not depend strongly on richness for most of the sample. However, the prevalence of radio-loud BCGs for clusters in the low-redshift, richest bin is higher than the number of radio sources per cluster in the other bins, possibly indicating evolution in the radio activity of the BCGs in the richest clusters. We calculate the uncertainty on our measurement of the difference between the fraction of radio-loud BCGs in the high redshift bin compared to the low redshift bin by adding in quadrature the uncertainties for each bin. We find that the radio-loud BCG fraction in the richest low-redshift clusters is larger than that in the richest high-redshift clusters with a significance at the 1.9 level. When we compare the radio-loud BCG fraction for the richest low redshift clusters to the radio-loud BCG fraction of all other clusters, the excess is significant at the 2.2 level. The numbers of clusters in the richest bins are also comparatively small (9 out of 40 clusters have radio-loud BCGs at low redshift and 3 out of 44 clusters have radio-loud BCGs at high redshift.) However, nearby massive clusters are the most likely to have short cooling times with respect to the Hubble time, potentially allowing cool gas from the ICM to accrete onto the BCG, and possibly onto the central AGN. This picture is supported by recent observational studies that find a lack of strong cooling core clusters at higher redshifts (such as and , Vikhlinin et al., 2007; Santos et al., 2008). If this scenario holds, then we would expect an excess of radio-loud BCGs in the richest nearby clusters in comparison with less massive or higher redshift clusters, which is what we observe. Further studies on larger samples will be necessary to confirm or disprove this excess.
3.2.3 Non-BCG Radio Galaxies
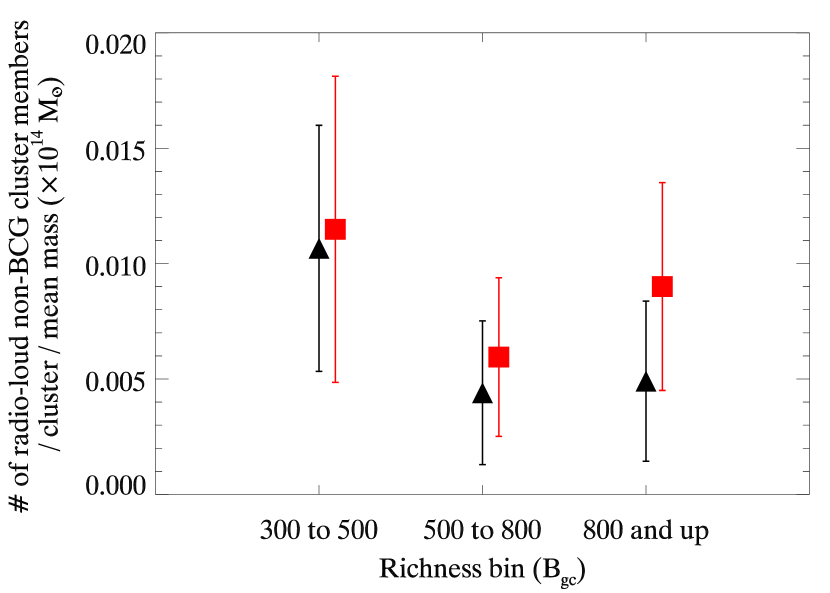
We identified every radio source whose optical counterpart is an early-type galaxy with a color consistent with the red sequence of its galaxy cluster but that is not identified as the cluster’s BCG. Figure 8 shows the number of such galaxies per cluster, divided into bins according to richness and redshift, normalized by the mean cluster mass (as derived from richness) for each bin. The number of non-BCG galaxies in a cluster is proportional to its richness, so this is similar to the radio loud fraction for these clusters. Some of these clusters also contain radio-loud BCGs, but as long as there is also an excess of radio-loud galaxies in addition to (or instead of) the BCG, the radio sources are included in this plot. These cluster member candidates were identified based on the color and magnitude of their identified optical counterparts placing them on the red sequence as well as their optical morphology. Unlike in the statistical analysis, if two components of an extended source are identified as belonging to the same optical counterpart, the system is counted as one radio source in this plot. For each richness bin, the number of non-BCG radio sources per cluster (normalized by mass) is somewhat higher for the high redshift sample than for the low redshift sample.
Thus, strong evolution in the radio-activity in one of those populations (BCG versus cluster galaxy) is not masking strong evolution in the other population. Also, because we are matching radio sources with optical sources by eye, we do not count radio sources that are resolved into multiple components in FIRST as separate from each other. Morphological evolution such that the resolution into components is different for the high and low redshift samples could mock evolution in the radio-loud population in our statistical sample. Thus, this visual identification of radio sources with BCGs and cluster members upholds the overall view that there is little evolution in the population of radio sources in clusters from redshift 0.95 to redshift 0.35, although the 2- indication of an excess of radio-loud BCGs in the richest low-redshift clusters is interesting evidence for evolution that is worth exploring with a larger data set.
3.2.4 Multiple Radio Sources
The FIRST catalog splits multiple components of extended radio sources into different sources, so to explore the frequency of multiple radio active galaxies within clusters, it is instructive to view them by eye. For example, the radio source in Figure 6 was identified as two sources in the FIRST catalog. We have identified twelve extended radio sources in our galaxy cluster sample that are split into multiple components by FIRST. These multiple components contaminate our statistical analysis, in which we consider radio sources as individual and uncorrelated, although the contamination is somewhat alleviated because we treat multiple components as separate radio sources both in the determination of the background level and in the determination of the signal.
Twelve galaxy clusters have multiple radio sources projected within 0.5 Mpc from their centers that we have identified as distinct from each other, two of which have three apparently independent radio sources. Fourteen percent ( Poisson counting uncertainties) of the galaxy clusters in our sample have radio sources within a projected 0.5 Mpc of their centers (including sources we expect from the background level.) Of these galaxy clusters, 14 have multiple radio sources identified as independent sources, and 17 of the sources with multiple radio sources identified as independent have three independent radio sources. Because all of these percentages agree with one another to within their uncertainties, we note that galaxy clusters with one radio source are not much more or less likely to have a second radio source, and galaxy clusters with two radio sources are not much more or less likely to have three. In other words, the radio loudness of galaxy cluster members seems to be independent of the radio loudness of other galaxy cluster members, although we note that with such a small number of clusters in the sample with multiple independent sources, the constraints are weak.
One of the strengths of our statistical analysis is that radio sources which are actually lobes of a central radio galaxy are included in the sample. Because we include all sources within 0.5 Mpc of the center of the cluster, we are likely including sources of bright radio emission which are associated with the BCG even if they are not coincident with the BCG because they are lobes. Visual inspection of the radio sources and their relationship to the optical galaxies gives us an idea of how important this population is. Of the 37 radio-loud BCGs we identify in our sample, 9 of them have extended radio morphology. Of these, 6 are likely FRI’s and 3 FRII’s (Fanaroff & Riley, 1974) based on their morphologies. For a recent study comparing the environments of extended and point-like radio sources, see (Wing & Blanton, 2010). We also calculated the luminosities of these extended sources from their NRAO VLA Sky Survey (NVSS; Condon et al., 1998) fluxes. The NVSS was conducted at 1.4 GHz with the VLA in its compact D and DnC configurations, so is better suited to measuring the fluxes of extended sources than FIRST, which may resolve out some flux. Ledlow & Owen (1996) found that for Abell clusters, the dividing line in the radio luminosity–R-band magnitude plane between FRI and FRII radio galaxies, which is very sharp in the general radio galaxy population (although this sharpness has been recently disputed, see Lin et al., 2010), is not as distinct in nearby Abell clusters. In our sample, all 6 FRI’s lie below the line as expected, and 2 of the 3 FRII’s lie above the line as expected, but one FRII is less radio-luminous than expected. However, Ledlow & Owen (1996) describe the FRII’s that lie within the FRI part of the radio luminosity–magnitude plane as being unusually small, with the lobes confined to the optical extent of the galaxies that host them. The only low-luminosity FRII identified in our sample looks fairly typical, with lobes located 200 kpc from the host galaxy. Larger samples are needed to better investigate the prevalence of FRII’s, both luminous and underluminous with respect to the FRI/II luminosity division, in clusters at high redshift.
There were no occasions in this analysis where one radio source was within 0.5 Mpc of two cluster centers.
3.2.5 Identification of Foreground and Background Sources
We inspected all of the galaxy clusters that contain radio sources within 0.5 Mpc of their centers. Some of these radio sources are chance projections. Given the background estimates from our statistical analysis, we expect radio sources within 0.5 Mpc of clusters’ centers by random superpositions. Radio sources are matched by eye with optical counterparts. If the optical counterparts are elliptical galaxies with colors consistent with the red sequence at the redshift of the potentially associated cluster, the radio source is identified as a cluster member. Thirty-two galaxy clusters contain radio sources within the projected inner 0.5 Mpc that are not identified with cluster members. Of these, seven have multiple sources (2 of the galaxy clusters’ multiple sources are identified as independent, the others are identified as multiple components.) The consistency of these numbers provides a check that we are being neither too generous nor too miserly in our identification of radio loud cluster members, because the number of galaxies we leave out as either foreground, background or indeterminate is consistent with what we expect from the background level. This consistency also indicates that most of the bright radio sources associated with galaxy cluster members are hosted by early type galaxies that lie on the red sequence.
4 Discussion
4.1 Comparison with Previous Work
4.1.1 Radio Galaxy Fraction
We compare the number of radio sources per cluster found in our sample with the number of radio sources per cluster found in Branchesi et al. (2006), who studied radio AGN in X-ray selected galaxy clusters with . The FIRST survey has a higher sensitivity limit than their pointed observations, although they also used the VLA operating in the B configuration, so their resolution is the same. They also assume a spectral index of 0.8, and they include radio sources within 0.4 Mpc of the clusters’ centers. Their cluster sample is X-ray selected from 87.4 deg2 of sky and contains 18 clusters with , although only one cluster has . In order to compare, we restrict our sample to the most massive (B) clusters with . There are 50 clusters in this richness and mass range, so we are probing to lower cluster mass than Branchesi et al. (2006), who have 18 clusters in about twice the area of sky but over a similar redshift range, although because their sample of clusters is X-ray selected, their sensitivity as a function of redshift is different than for the optically selected sample. When we calculate the number of excess radio sources with luminosities greater than 1 W Hz-1 within 0.4 Mpc of these cluster centers, we find the number per cluster to be . According to their Figure 8, they find approximately radio sources with such bright luminosities per cluster. Thus, the studies are in general agreement with each other on the number of radio sources in clusters in this redshift range.
In order to compare to an optically-selected galaxy cluster sample, we also compare our data to the results of Croft, de Vries, & Becker (2007) who correlate brightest cluster galaxies from the maxBCG catalog of galaxy clusters in the Sloan Digital Sky Survey with FIRST radio sources. They use an algorithm to identify radio sources with double lobes that are likely associated with the BCG, so their radio source sample includes both point sources and extended sources. They have a much larger sample (over 13,000 clusters) but are restricted to low redshift (). A direct comparison is not straightforward because their luminosity cutoff is low (1 mJy at corresponds to about W Hz-1) and the mean cluster N200 richness parameter for this sample is 17.7, corresponding to approximately M⊙ (Johnston et al., 2007). We compare the RCS1 clusters that fall between redshift 0.35 and 0.45 with their sample. Using a luminosity cutoff of W Hz-1 (which corresponds to a 1.0 mJy radio source at a redshift of 0.45) we find the number of radio sources per RCS1 cluster in excess of the background of radio sources to be 0.29 0.06. We then scale this number to account for the differences in average mass, in radio luminosities probed, and in the fact that we are counting all radio-loud galaxies in clusters, not just BCGs. The average Bgc,R of this RCS1 subsample is 627, corresponding to M⊙. Extrapolating from the field 1.4 GHz luminosity function for radio AGN in Mauch & Sadler (2007) (Ledlow & Owen (1996) find no difference between the cluster and field radio luminosity functions) we expect the radio sources in Croft, de Vries, & Becker (2007) to be about 3.4 times as numerous as the radio sources to which we are matching RCS1 clusters in this comparison. Finally, from our identification of radio-loud BCGs as discussed in section 3.2.2, we find that 75% of clusters with radio sources above the level expected from the background have radio-loud BCGs. Thus the scaled radio-loud BCG fraction for these RCS1 clusters is . The Poisson uncertainty on this fraction is about 4%, but the uncertainties in extrapolating across cluster masses and the radio luminosity function are probably more significant. Croft, de Vries, & Becker (2007) find that 19.7% ( Poisson uncertainty) of their BCGs are radio-loud. Thus without accounting for any possible redshift evolution, and with the above extrapolations for differences in cluster and radio source properties, the two studies approximately agree.
4.1.2 Redshift Evolution of Radio Galaxy Fraction
Most of the previous work on the evolution of radio sources in clusters has been based on in-depth studies of relatively small samples of intermediate to high redshift X-ray selected galaxy clusters in comparison to in-depth studies of nearby Abell clusters.
Stocke et al. (1999) conducted pointed 1.4 GHz observations of 19 X-ray selected galaxy clusters. They compared the radio activity of galaxies in these clusters to the radio activity observed in nearby clusters by Ledlow & Owen (1996) and found no difference between the two samples. Extending this work to progressively higher redshift, Perlman et al. (2004) conducted pointed 1.4 GHz observations of 17 X-ray selected galaxy clusters. They also found no evidence for evolution with redshift in the cluster radio source population.
Branchesi et al. (2006) calculated the radio luminosity function of 18 X-ray selected galaxy clusters with . They compared their results to the low-redshift studies of Fanti (1984) and Ledlow & Owen (1996) and concluded that their radio luminosity function is significantly higher than the RLF for nearby galaxy clusters. However, as they discussed in their conclusions, their X-ray selected clusters have, on average, higher mass than the local Abell clusters to which they are comparing, and when they take into account the presumed difference in richness between the two samples, as Stocke et al. (1999) do, they no longer discern any difference in the amplitude of the radio luminosity function between the high and low redshift samples.
Thus, when the studies of radio AGN in high-redshift, X-ray selected clusters properly account for the average cluster richness of their high redshift samples, they also see no evidence for evolution of the radio-loud cluster galaxy population with redshift, just as we see no evidence for evolution using our uniformly selected sample (see section 3.1.2). Of course, because these other studies use nearby Abell clusters as their low redshift clusters, they are probing a more local cluster population than we do, and if the radio AGN in clusters evolve strongly between a redshift of 0 and a redshift of 0.3, then these other studies would be sensitive to evolution in a redshift range for which we have no data. However, the previous studies have few clusters with redshifts , so we are more sensitive to evolution at the higher redshift range.
Best (2003) conducted deep radio observations of a rich galaxy cluster, MS1054–03, finding 8 spectroscopically confirmed cluster members with radio emission brighter than 32Jy, a large excess compared when compared with low redshift clusters. Such deep radio observations probe a different part of the luminosity function, which at low luminosities is dominated by star forming galaxies rather than AGN. Instead, we focus on the brighter, rarer AGN over a larger statistical sample.
4.2 Implications
4.2.1 The Effect on SZ Cluster Surveys
Lin & Mohr (2007) generate predictions of point source contamination for SZ surveys. The evolution of the radio source population is one of their unknowns, so they investigate two models: no evolution, and a power-law model in which the number of radio AGN in a cluster of mass M scales as ()γ where . For this latter scenario, and assuming their propogation of a spectral index distribution to determine the predictions of fluxes at higher (30, 90, 150 GHz) frequencies from their counts at 1.4 GHz, they determine the fraction of clusters in an SZ survey that would be lost due to contamination from radio sources as a function of cluster mass and redshift. Because the SZ flux is roughly constant with redshift, and because of the increasing luminosity distance with redshift (and with consideration of the -correction), higher luminosity radio sources are required to contaminate the SZ effect from clusters at higher redshifts. However, with their power-law redshift evolution, they find that for low-mass clusters, the evolution of the radio source population wins out over these other effects so that the fraction of lost clusters is higher at high redshift than at low redshift. Conversely, for high mass clusters with greater SZ signals, and because of the steepness of the radio luminosity function, the fraction of lost clusters is higher at low redshift than at high redshift. With no evolution, the lost cluster fraction would be decreased for each redshift bin by a factor of ()γ, which for the redshifts they consider (0.1, 0.6, 1.1) when looking at a range in mass (their Figure 15) corresponds to factors of 1.3, 3.2 and 6.4.
We do not see evolution in the cluster radio source population, and if anything, there is some small evidence (1.5) that lower redshift clusters have more radio sources per unit mass than high redshift clusters. In order to quantify how significantly our data constrain this type of redshift evolution, we have performed a chi-square test. We calculated the number of radio sources expected for ()γ evolutionary models, using the cluster redshifts and normalizing to the total number of excess radio sources in clusters that we observe in the real data. We compare the models with the data for the number of radio sources per cluster for the low and high redshift bins (without accounting for the richness dependence other than by applying a uniform richness cut). The preferred value of is , where the uncertainties given are estimated from fitting a Gaussian to the P-values as a function of . This test also indicates that there is a probability that the difference between our data and a evolutionary model is purely random, implying that such evolution is unlikely.
Qualitatively, the main change, based on our study, in the forecasts from Lin & Mohr (2007) for SZ survey contamination given no evolution in the cluster-associated radio source population is that the low mass, high redshift clusters are not as badly contaminated as low mass, low redshift clusters; so, fewer high redshift clusters would be lost from SZ surveys. In their more recent study, which also includes observations of the spectral indices of radio sources in clusters, Lin et al. (2009) adapted a more mild evolution (), motivated by this work. They found that this makes the SZ contamination by AGN much smaller than had been previously estimated.
4.2.2 Comparison with Cluster X-ray and Infrared AGN Frequency
Studies that focus on X-ray selected AGN in galaxy clusters observe a strong evolution over a redshift range similar to what we probe. Martini, Sivakoff, & Mulchaey (2009) observe a dramatic increase (by a factor of eight) in the population of X-ray selected AGN in galaxy clusters over a redshift range of 0.05 to 1.3. Galametz et al. (2009) conclude that for X-ray-selected, optically-selected and radio-selected AGN, the enhancement in AGN activity in the centers of clusters is greater at than at . Although the field-corrected radio AGN density remains consistent between the redshift bins to within their quoted uncertainties, they do see some low significance evidence for evolution in the radio source population by about a factor of two. The clusters in their study are selected from optical and infrared imaging data. The evolution in the X-ray AGN population drives their conclusions.
Our data rule out strong evolution of the radio-loud AGN population between a redshift of 0.35 and 0.95 in our sample. The two AGN populations (radio and X-ray) may be evolving differently from each other in the cluster environments. Evidence of evolution in the X-ray AGN population does not imply evolution in the cluster radio AGN population. Hart et al. (2009) identified X-ray AGN and radio AGN in 11 galaxy clusters at selected from X-ray data as clusters that are similar to what the Coma cluster would have been like at that redshift. They found that X-ray point sources and radio sources rarely overlap in their sample. The two populations are separate, and so predictions that rely on the radio source population evolution (such as projections for the contamination of SZ surveys) should not use the observed cluster X-ray AGN evolution.
Studies of X-ray AGN in clusters typically define a cluster galaxy AGN fraction as their observable quantity. They typically exclude the BCGs from this AGN fraction to avoid possible contamination from cluster cool cores (e.g., Martini et al., 2006; Arnold et al., 2009). Of the different results for radio sources in clusters that we have presented, the quantity that we measure that compares most directly to this AGN fraction is the number of radio-loud non-BCG cluster members per unit mass (as shown in Figure 8). While the slight increase at high redshifts is not significant (the significance of the difference between the mean number of non-BCG radio sources per cluster per unit mass for the high redshift bins and for the low redshift bins is only 1.2), the redshift range we are probing is also not as wide as that probed by Martini, Sivakoff, & Mulchaey (2009). They measure the fraction of galaxies in clusters that are X-ray AGN using two different redshift binning schemes with two and three redshift bins, and restricting their sample to the two highest redshift bins of the three bin scheme brings it into better agreement with our redshift distribution (these bins have and ). The mean X-ray AGN fraction they measure for these bins are 0.0031 and 0.0147, so that the increase is about a factor of 4.7. Such a large increase is unlikely in the radio source population in our sample. So even if qualitatively there may be some similar evolution (at quite low significance) in the radio population as the X-ray population, it appears to be less strong. Thus X-ray AGN and radio-loud AGN are likely two different AGN populations, and they show different redshift evolution in galaxy clusters.
5 Conclusions
We constrain the evolution of the bright central radio source population in galaxy clusters from redshift 0.35 to 0.95 by statistically matching FIRST radio sources with 618 galaxy clusters from a uniformly, optically selected sample (RCS1). The number of radio sources per cluster (0.14 0.02 for clusters with and 0.10 0.02 for clusters with ) is consistent with previous studies using different, more local samples. Richer clusters have more radio sources per cluster, also as expected from previous studies. After normalizing by the clusters’ mass (as derived from richness), we find that the number of radio sources per unit cluster mass is roughly constant with mass and with redshift (the significance of the difference between high and low redshift clusters is 1.5). The number of radio sources (with L W Hz-1) per M⊙ of cluster mass is 0.031.
We also visually inspect the radio source emission in the galaxy clusters with radio sources in our sample. Identifying BCGs and matching radio emission with optical objects, we find some (2-) evidence that the number of radio-loud BCGs is higher for high richness, low redshift clusters than for either high richness, high redshift clusters or low richness (at high or low redshift) clusters. If there is a connection between the radio activity of the BCG of a galaxy cluster and amount of cooling in the surrounding ICM and if the lowest redshift, richest clusters are most likely to have large amounts of cooling gas in their inner regions, then we might expect to observe more radio-loud BCGs in nearby rich clusters. The low and intermediate richness bins do not show any evolution in the prevalence of radio-loud BCGs.
Studies of the cluster X-ray AGN population find strong evolution over a similar redshift range as we probe, while we do not observe such evolution in the radio AGN population. This indicates that X-ray AGN and radio-loud AGN likely probe different AGN populations.
The RCS collaboration is currently working on a second, larger cluster catalog based on imaging almost 1000 square degrees in three filters (g’, r’, z’) with the CFHT MegaCam. We plan on extending this statistical analysis of the radio source population in galaxy clusters when the new survey becomes available in order to further probe the effects of galaxy cluster properties on the radio source population and to further characterize the cluster radio sources.
References
- Arnold et al. (2009) Arnold, T. J., Martini, P., Mulchaey, J. S., Berti, A., Jeltema, T. E. 2009, ApJ, 707, 1691
- Becker, White, & Helfand (1995) Becker, R. H., White, R. L., & Helfand, D. J. 1995, ApJ, 450, 559
- Best (2003) Best, P. N. 2003, Ap&SS, 285, 137
- Best (2004) Best, P. N. 2004, MNRAS, 351, 70
- Best (2007) Best, P. N., von der Linden, A., Kauffman, G., Heckman, T. M., & Kaiser, C. R. 2007, MNRAS, 379, 894
- Binney & Tabor (1995) Binney, J. & Tabor, G. 1995, MNRAS 276, 663
- Blindert (2006) Blindert, K. 2006, Ph.D. Thesis. University of Toronto
- Branchesi et al. (2006) Branchesi, M., Gioia, I. M., Fanti, C., Fanti, R., & Perley, R. 2006, A&A, 446, 97
- Burns (1990) Burns, J. O. 1990, AJ, 99, 14
- Condon et al. (1998) Condon, J. J., Cotton, W. D., Greisen, E. W., Yin, Q. F., Perley, R. A., Taylor, G. B., & Broderick, J. J. 1998, AJ, 115, 1693
- Croft, de Vries, & Becker (2007) Croft, S., de Vries, W., & Becker, R. H. 2007, ApJ, 667L, 13C
- Dickinson (1994) Dickinson, M. E. 1994, PhD Thesis.
- Croton et al. (2006) Croton, D. J., Springel, V., White, Simon D. M., De Lucia, G., Frenk, C. S., Gao, L., Jenkins, A., Kauffmann, G., Navarro, J. F., Yoshida, N. 2006, MNRAS, 365, 11
- Eilek (2004) Eilek, J. A. 2004, The Riddle of Cooling Flows in Galaxies and Clusters of Galaxies, Ed. by Reiprich, T. H., Kempner, J. C., and Soker, N. (Charlottesville, VA: http://www.astro.virginia.edu/coolflow/)
- Fanaroff & Riley (1974) Fanaroff, B. L., & Riley, J. M. 1974, MNRAS, 167, 31P
- Fanti (1984) Fanti, R. 1984, in Clusters and Groups of Galaxies, ASSL, 111, 185
- Galametz et al. (2009) Galametz, A., Stern, D., Eisenhardt, P. R. M., Brodwin, M., Brown, M. J. I., Dey, A., Gonzalez, A. H., Jannuzi, B. T., Moustakas, L. A., Stanford, A. 2009 ApJ, 694, 1309
- Gladders & Yee (2005) Gladders, M. D., & Yee, H. 2005, ApJS, 157, 1
- Gladders & Yee (2000) Gladders, M. D., & Yee, H. 2000, AJ, 120, 2148
- Gladders et al. (2007) Gladders, M. D., Yee, H. K. C., Majumdar, S., Barrientos, L. F., Hoekstra, H., Hall, P. B., Infante, L. 2007, ApJ, 655, 128
- Hart et al. (2009) Hart, Q. N., Stocke, J. T., Hallman, E. J. 2009, ApJ, 705, 854
- Hinshaw et al. (2009) Hinshaw, G. et al. ApJS, 180, 225
- Johnston et al. (2007) Johnston, D. E., Sheldon, E. S., Wechsler, R. H., Rozo, E., Koester, B. P., Frieman, J. A., McKay, T. A., Evrard, A. E., Becker, M. R., Annis, J. 2007, arXiv:0709.1159J
- Kosowsky (2003) Kosowsky, A. 2003, NewA Rev., 47, 939
- Ledlow (1994) Ledlow, M. J. “An optical/radio study of radio sources in Abell rich clusters”, Ph.D. Thesis, University of New Mexico.
- Ledlow & Owen (1995) Ledlow, M. J., & Owen, F. N. 1995, AJ, 109, 853
- Ledlow & Owen (1996) Ledlow, M. J., & Owen, F. N. 1996, AJ, 112, 9
- Lin & Mohr (2007) Lin, Y.-T., & Mohr, J. J., 2007, ApJS, 170, 71
- Lin et al. (2009) Lin, Y.-T., Partridge, B., Pober, J. C., Bouchefry, K. E., Burke, S., Klein, J. N., Coish, J. W., Huffenberger, K. M. 2009, ApJ, 694, 992L
- Lin et al. (2010) Lin, Y.-T., Shen, Y., Strauss, M., Richards, G., Lunnan, R. 2010, arXiv:1006.5452
- Martini et al. (2006) Martini, P., Kelson, D. D., Kim, E., Mulchaey, J. S., Athey, A. A. 2006, ApJ, 644, 116
- Martini, Sivakoff, & Mulchaey (2009) Martini, P., Sivakoff, G. R., & Mulchaey, J. S. 2009, ApJ, 701, 66
- Mauch & Sadler (2007) Mauch, T., & Sadler, E. M. 2007, MNRAS, 375, 931
- McNamara & Nulsen (2007) McNamara, B. R., & Nulsen, P. E. J. 2007, ARA&A, 45, 117
- Menanteau et al. (2010) Menanteau, F. et al., ApJ, submitted
- Miller & Owen (2002) Miller, N. A., & Owen, F. N. 2002, AJ, 124, 2453
- Mittal et al. (2009) Mittal, R., Hudson, D. S., Reiprich, T. H., Clarke, T. 2009, A&A, 501, 835
- Owen, Ledlow & Keel (1995) Owen, F. N., Ledlow, M. J., & Keel, W. C. 1995, AJ, 109, 140
- Owen, Strazzullo, & Pannella (2009) Owen, F. N., Strazzullo, V., & Pannella, M. 2009, in AIP Conf. Ser. 1201, The Monster’s Fiery Breath: Feedback in Galaxies, Groups, and Clusters, ed. S. Heinz, & E. Wilcots (Madison, WI: AIP), 119
- Perlman et al. (2004) Perlman, E. S., Frye, C., Ebeling, H., Jones, L. R., Scharf, C. A., & Horner, D. 2004, in Carnegie Observatories Astrophysics Series, Vol. 3: Clusters of Galaxies: Probes of Cosmological Structure and Galaxy Evolution, ed. J. S. Mulchaey, A. Dressler, and A. Oemler (Pasadena: Carnegie Observatories, http://www.ociw.edu/ociw/symposia/ series/symposium3/proceedings.html)
- Ruhl et al. (2004) Ruhl, J. et al. 2004, Proc. SPIE, 5498, 11
- Santos et al. (2008) Santos, J. S., Rosati, P., Tozzi, P., Böhringer, H., Ettori, S., Bignamini, A. 2008, å, 483, 35
- Stocke et al. (1999) Stocke, J. T., Perlman, E. S., Gioia, I. M., & Harvanek, M. 1999, ApJ, 117, 1967
- Sun (2009) Sun, M. 2009, ApJ, 704, 1586
- Vanderlinde et al. (2010) Vanderlinde, K. et al., ApJ, submitted
- Vikhlinin et al. (2007) Vikhlinin, A., Burenin, R., Forman, W. R., Jones, C., Hornstrup, A., Murray, S. S., Quintana, H. 2007, Heating versus Cooling in Galaxies and Clusters of Galaxies, Eso Astrophysics Symposia, 2007, 48
- White et al. (1997) White, R.L., Becker, R. H., Helfand, D. J., & Gregg, M. D. 1997, ApJ, 475, 479
- Wing & Blanton (2010) Wing, J. D., & Blanton, E. L. 2010, arXiv:1008.1099
- Yee & Ellingson (2003) Yee, H. K. C., & Ellingson, E. 2003, ApJ, 585, 215
- Yee & López-Cruz (1999) Yee, H. K. C., López-Cruz, 1999, AJ, 117, 1985