Discovery of tidal tails around the distant globular cluster Palomar 14
Abstract
We report the detection of a pair of degree-long tidal tails associated with the globular cluster Palomar 14, using images obtained at the CFHT. We reveal a power-law departure from a King profile at large distances to the cluster center. The density map constructed with the optimal matched filter technique shows a nearly symmetrical and elongated distribution of stars on both sides of the cluster, forming a S-shape characteristic of mass loss. This evidence may be the telltale signature of tidal stripping in action. This, together with its large Galactocentric distance, imposes strong constraints on its orbit and/or origin: i) it must follow an external orbit confined to the peripheral region of the Galactic halo and/or ii) it formed in a satellite galaxy later accreted by the Milky Way.
Subject headings:
globular clusters: individual (Pal 14) — stars: Population II — celestial mechanics — methods: observational — techniques: photometric1. Introduction
Globular clusters (GCs) are one of the cornerstones for understanding of the formation, structure and dynamics of the halo of the Milky Way. Their dynamical evolution is driven both by internal mechanism s (such as stellar evolution, two-body relaxation, and binary heating) and by external effects induced by the Galactic force field which produces the heating of their stars by tidal shocks during disk passages and tidal stripping. Both sets of effects lead to a continuous loss of stars and to the eventual dissolution of the cluster. The stripped stars are placed on orbits similar to that of the original cluster, forming tidal tails surrounding the parent cluster.
A first attempt to search for tidal tails around GCs was carried out by Grillmair et al. (1995) by analyzing the spatial distribution of star counts in a dozen Galactic GCs. They found that the observed density profiles deviate from the prediction of a best-fit King model at the outermost radii and extend beyond the conventional limiting radius set by this model. Similar analyses were also done by Leon et al. (2000) using 2MASS data and more recently by Chun et al. (2010) with optical images. Although all these studies detected spatially distinct star count overdensities around many clusters, density fluctuations caused by distant galaxy clusters, variable foreground reddening or photographic plate inhomogeneities may seriously contaminate the stars counts, yielding in some cases uncertain locations and shapes of putative tidal tails (Law et al. 2003). Two remarkable exceptions are the discoveries of extended tidal tails around Palomar 5 (catalog ) (Odenkirchen et al. 2001) and NGC 5466 (catalog ) (Belokurov et al. 2006a). In both cases, a pair of tidal tails extending several degrees on the sky have been detected with high statistical significance (Odenkirchen et al. 2003; Grillmair & Dionatos 2006; Zou et al. 2009). The orientation of the detected tails in NGC 5466 (catalog ) is also in good agreement with its orbit as derived from proper-motion data.
While the above studies have focused on nearby objects, the sample of GCs in the outer halo of the Milky Way has thus far been excluded from these studies since i) their distances make difficult to reach the most populated regions of the color-magnitude diagram (CMD) which give an optimal contrast for the detection of the cluster population against the foreground Galactic contamination, and ii) the tidal force exerted by the Galaxy in these remote regions of the halo is expected to be too weak to produce significant distortions in the cluster’s shape (Lee et al. 2006; Fellhauer & Lin 2007). The most distant clusters for which signs of tidal disruption have been detected are all located within (Cote et al. 2002; Carraro et al. 2007,2009; Niederste-Ostholt et al. 2010). Nevertheless these remote clusters represent an important class of objects to investigate many topics related to the hierarchical build-up process of the Galactic halo (Prieto & Gnedin 2008) as well as fundamental physics. Indeed, in the classical Searle & Zinn (1978) scenario of the formation of the Galaxy, at least part of the halo GCs formed in external dwarf galaxies later accreted by the Milky Way. This hypothesis is supported by the evidence that the group of 8 GCs populating the outermost Galactic halo (at Galactocentric distances kpc) does not show the clear metal abundance gradient observed in the inner parts of the Galaxy and exhibit peculiar kinematics (large, energetic orbits of high eccentricity), larger core radii and a higher specific frequency of RR Lyrae stars (Mackey & Gilmore 2004). Moreover, because of the small acceleration produced by the Milky Way in these remote regions, these clusters represent also an excellent benchmark to test the gravitational law in such regimes (Baumgardt et al. 2005; Sollima & Nipoti 2010; Küpper & Kroupa 2010).
Here we report the detection of a tidal tail around Palomar 14 (catalog ), a GC located in the outer halo of the Milky Way at a distance of 71 kpc. This result comes from a photometric campaign performed at the CFHT to search for extra-tidal structures in the outskirts of Galactic GCs (see Martinez-Delgado et al. 2004) and has deep implications on the nature of this cluster and its orbit.
2. Observations and Data reduction
Wide-field photometric imaging was obtained in QSO mode with the MegaCam camera at the Canada-Franch-Hawaii Telescope (CFHT) in 3 different nights in April and May 2009. The camera consists of a mosaic of 36 chips with a pixel scale of 0.185” pixel-1 providing a global field of view of . A set of 6 and 9 680 sec-long exposures were taken around the cluster center with a dithering pattern of few arcminutes to fill in the gaps between the chips. The average seeing was 0.7”.
The standard reduction steps (bias, dark and flat-field correction) were carried out with the Elixir pipeline developed by the CFHT team. We used DAOPHOT II and the point-spread-function (PSF) fitting algorithm ALLSTAR (Stetson, 1987) to obtain instrumental magnitudes for all the stars detected in each frame. The TERAPIX pipeline was then used to produce mean frames by aligning and averaging the images with a 3 clipping rejection threshold. The automatic detection of sources was performed on the mean frames adopting a 3 threshold. The mask with the object positions was then used as input for the PSF fitting, which was performed independently on each image. The most isolated and bright stars in each field were used to build the PSF model (here a Moffat function of exponent 2.5). For each passband, the derived magnitudes were transformed to the same instrumental scale and averaged. We adopted the nightly zero points and reddening coefficients provided by the CFHT to link the instrumental magnitudes to the standard system. Finally, a catalog with over 100,000 calibrated sources was produced and astrometrically calibrated through a cross-correlation with the DR7 release of the Sloan Digital Sky Survey (Abazajian et al. 2009), which lists accurate positions for some 40,000 objects over an area of sq.deg. around Palomar 14. The astrometric solution has a typical standard deviation of 200 mas.
3. Results
3.1. Color-Magnitude Diagrams
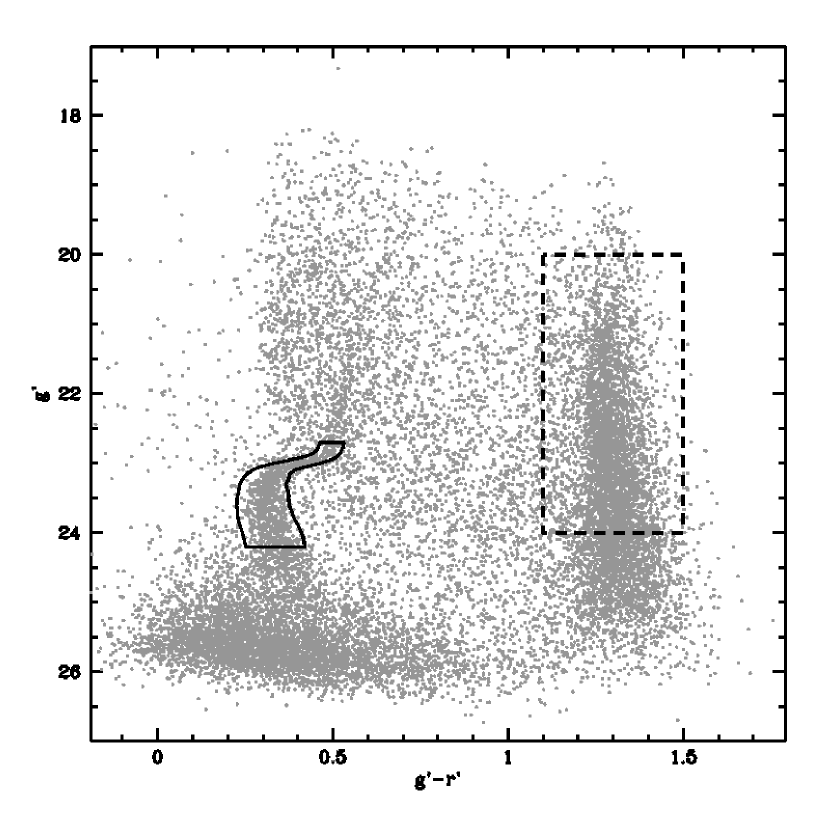
The CMDs () of the innermost region of Palomar 14 (catalog ) (within the half-light radius 2.4’) and of the most external portion within the Megacam field of view (at distances 15’ to the cluster center) are shown in Fig. 1. Only objects with a sharpness parameter 0.2 (as defined by Stetson 1987) have been plotted to minimize the contamination from background galaxies. The CMDs sample the evolved population of the cluster, reaching the Main Sequence (MS) at . A significant overdensity of stars can be noticed in the external region at and , with a morphology and magnitude which resembles the MS of Palomar 14, at a distance much larger than the estimated tidal radius (between 7.1’ and 9.2’; McLaughlin & van der Marel 2005).

3.2. Spatial distribution
| Model | |||||
|---|---|---|---|---|---|
| ′ | ′ | ′ | |||
| King | 7.0 | 0.60 (0.07) | 2.37 (0.15) | 20.0 (1.5) | -4.94 (0.12) |
| Wilson | 6.3 | 0.72 (0.08) | 2.23 (0.14) | 27.2 (1.7) | -4.95 (0.12) |
| Plummer | 2.21 (0.30)aafootnotemark: | 3.91 (0.53) | -4.65 (0.25) |
To study the spatial distribution of the stars of Palomar 14 we first computed its radial density profile. For this purpose we selected those stars in the magnitude range which lie within 3 times the local color dispersion about the cluster mean ridge line to ensure a good level of completeness and to minimize the contamination from Galactic field stars (see Fig. 2). The number of selected stars in concentric annuli of variable width located at various distances to the cluster center (from 1’ to 28’) were counted to produce the surface density profile shown in Fig. 3. In the innermost region (where the MS star counts suffer from a significant degree of incompleteness) our profile has been integrated with surface brightness measures by Trager et al. (1995) converted in densities and scaled to properly match our measures in the overlapping regions. The radial profile extends well beyond the tidal radius estimated so far (Harris & van den Bergh 1984; Trager et al. 1995; McLaughlin & van der Marel 2005) and in fact the distribution appears to be truncated by the MegaCam field of view. The best fit King (1966), Wilson (1975) and Plummer (1911) models are overplotted in Fig. 3111In the model fitting a constant background of density has been assumed from the MS star counts in the most external region of our image (at 25’). This value is in agreement with the predictions of the Galactic model of Girardi et al. (2005).. In the fitting procedure we excluded those points located beyond . In fact, in these outer regions the density profile deviates from the behavior predicted by all models, declining with a power-law exponent , in agreement with the values found in other Galactic GCs (Grillmair et al. 1995; Leon et al. 2000; Testa et al. 2000; Lee et al. 2003) and as predicted by theoretical models (e.g. Johnston et al. 1999). Our best fit King and Wilson models predict respectively a tidal radius of 20.3’ and 27.2’ 1.7 (i.e., four times larger than previous estimates) while clearly underestimating the stellar density in the outermost radii.

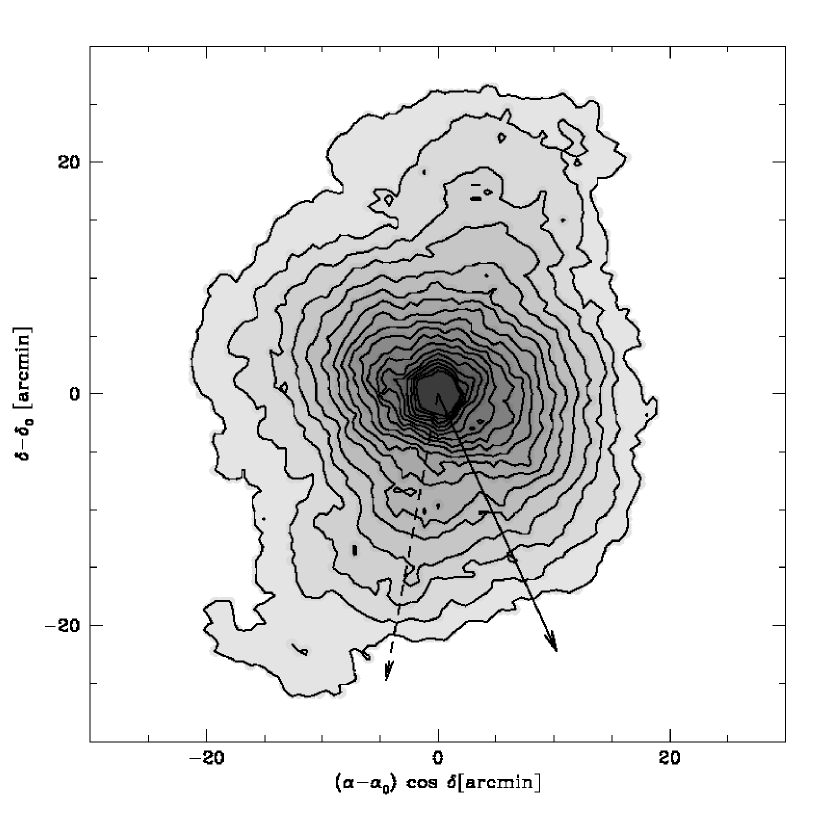
To investigate in detail the two-dimensional distribution of cluster stars we apply an optimal matched filter technique (see Kuhn et al. 1996; Rockosi et al. 2002; Odenkirchen et al. 2001, 2003). Briefly, we define a fiducial cluster and field population in the CMD by sampling all stars that lie within 2.4’ and outside 25’ respectively222As shown in Fig. 3, Palomar 14 extends well beyond this limit and some cluster stars may fall inside the reference field population. However, given the large difference in density between the Galactic field population and the cluster one in this outer region, the effect of this contamination on the derived weights is negligible.. The densities in the CMDs (Hess diagram) of the fiducial cluster and field populations were computed using an adaptive kernel estimation (Silverman 1986) with a Gaussian kernel of radius set to the distance of the 10th nearest star. We then assigned to each star a weight defined as the ratio between the densities calculated at that position of the cluster and the field CMDs. Lastly, the distribution of stellar positions was transformed into a smoothed surface density function through an adaptive kernel estimation. In this case we used a Gaussian kernel with radius set to the angular distance of the 100th nearest neighbor of each star and the kernel volume was set proportional to the associated weight. This procedure yields the surface density distribution shown in Fig. 4. As apparent,the overall distribution presents an elongated shape. In particular, the density contours have a symmetrical distribution to both sides of the cluster with an orientation that appears to change with distance, forming the characteristic S-shape typical of stellar mass loss. The direction of the Galactic center is also indicated in Fig. 4. It is interesting to note that the elongation of the central region of the cluster is not too different from this direction.
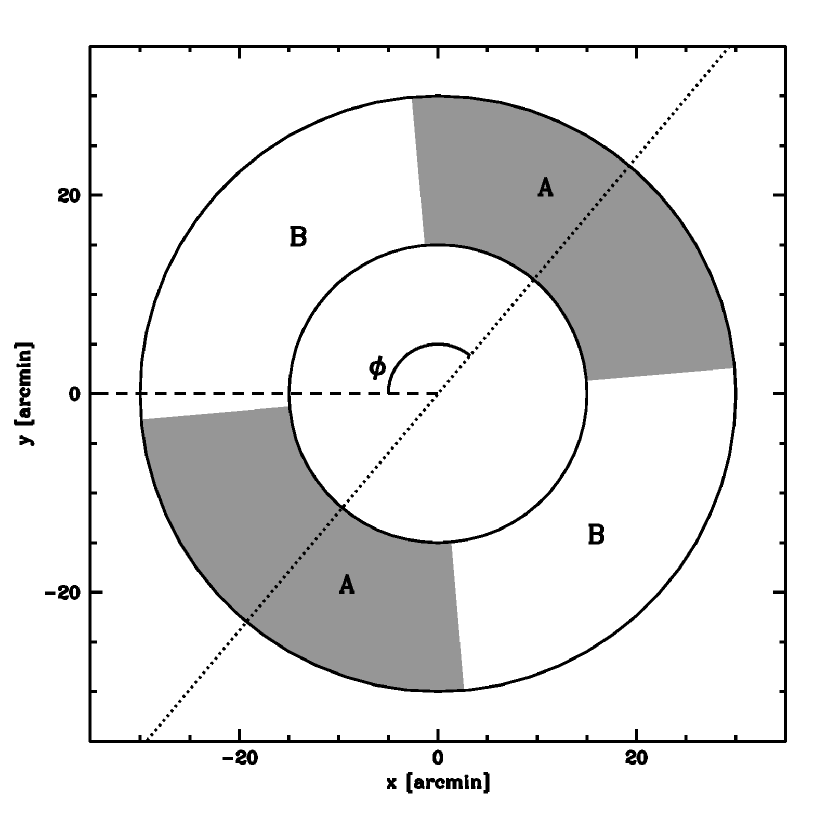
As a further check of the anisotropic distribution of cluster stars, we can quantify the degree of coherence in the orientation of the tails. We consider the sample of stars selected on the CMD close to the cluster mean ridge line (as defined above) and a sample of M dwarfs of the Galactic disk (selected in the range and ; see Fig. 2). This control sample is supposed to be uniformly distributed across the field of view and actual deviations from the uniform distribution reflect variations in the efficiency of detection, Galactic field and extinction gradients, etc. We define two regions (A and B) as alternate pairs of -wide circular sectors positioned at a given distance to the cluster center and oriented at a given position angle () in opposite directions (see Fig. 5). For a given position angle, we count the number of cluster () and field () stars lying in the regions A and B and compute the normalized ratio . We performed this test using both stars located at distances 15’ and stars at 15’. The statistical significance of the test was evaluated with Monte Carlo simulations to overcome to the notorious misbehavior of the ratio of Poisson variables (e.g. Cerviño & Valls-Gabaud 2003). We constructed a set of 1000 simulations placing the same number of observed cluster and field stars at random angles and computed the ratio for each simulated set, yielding the expected trend of and its standard deviation for a homogeneous and isotropic distribution of stars. The result of such a test is shown in Fig. 6. As expected, the simulated samples yield a value of close to unity for all position angles. Instead, the observed ratio presents a clear peak in both areas. In particular, the maximum coherence is found at the position angle of (inner region) and (outer region). In addition, the maximum value of is larger in the outer region (=2.07; corresponding to a statistical significance of 6.1) than in the inner one (=1.39; at 3.7). Fig. 7 shows the CMDs of the regions A (along the tail) and B (perpendicular to the tail) at distances 15’. The density in the MS portion of the CMD is significant along the tail, while only a sparse number of stars is visible in the region perpendicular to the tails.


.
3.3. Cluster Structure and Relaxation
The density profile shown in Fig. 3 is the deepest and most complete one currently available for this cluster and allows to calculate its physical size and mass. First, the distance modulus is measured using the Bayesian inference method (Hernandez & Valls-Gabaud 2008), assuming metallicity and alpha enhancement marginalizing over the ”nuisance” parameters of extinction, yielding maxima in the posterior probability distribution function of distance and age. We used the theoretical isochrones by Marigo et al. (2008) specifically transformed into the MegaCam filters photometric system and assumed [Fe/H]1.6 (Armandroff et al. 1992) and [/Fe]=+0.3 (Ferraro et al. 1999). We obtained a best-fit distance of 71 2 kpc and an age of 13.20.3 Gyr, in agreement with the estimates by Jordi et al. (2009) (1.3 kpc and t=11.5 Gyr, assuming [Fe/H]1.5 and [/Fe]=+0.2). The best fit Wilson model gives a projected half-light radius of =2.23’=46.1 pc which is the largest among those listed by Harris (1996) for Galactic GCs.
We then calculated the mass of Palomar 14 adopting two different methods. First, we assumed a M/L ratio of 1.885 (as derived by McLaughlin & van der Marel 2005 using suitable stellar population synthesis models) and a luminosity of . This last quantity has been derived from the cluster absolute V magnitude () calculated by integrating the bestfit surface brightness Wilson model and assuming the distance modulus calculated above. The overall mass of the cluster turns out to be . A second estimate has been done by using the velocity dispersion estimated by Jordi et al. (2009; ), the half-light radius calculated above and adopting eq. 4 of Baumgardt et al. (2005), yielding a value of . The two above estimates agree quite well between them.
It is also possible to estimate the time elapsed since the last pericentric passage using the observed velocity dispersion by Jordi et al.(2009) and the position of the break radius in the radial profile (; defined as the point of intersection between the best-fit Wilson model and the external power-law profiles). In fact, using eq. 5 of Peñarrubia et al. (2009) and the above value of , we get Gyr. The stars that populate now the tails are supposed to be mainly those stripped in the last orbit. In this sense, the above estimate can be considered as the age of the tail.
Adopting the Galactic potential of Johnston et al. (1995) and the mass calculated above, the maximum radius of the Roche lobe of a stellar system located at the position of Palomar 14 and with a projected radial velocity of 72.3 km s-1 (Jordi et al. 2009) turns out to be 170 pc (see eq. A2 of Allen et al. 2006). This translates into an angular distance of . It is interesting to note that this limit is located well within the cluster tidal radius (see Fig. 3) indicating that a number of cluster stars within the tidal radius are going to be lost in the next pericentric passages.
An observational estimate of the undergoing destruction rate in Palomar 14 can be obtained (assuming that light traces mass) by counting the number of stars () comprised within the break radius and those () in the radial range as
where is the angle between the line of sight and the plane perpendicular to the orbit, and is the orbital period (Johnston et al. 1999). While these two parameters depend on the unknown orbit of the cluster, a lower limit to the rate can be derived assuming a circular orbit (). Given , , we measure and thus infer a lower limit to the destruction rate of .
An important question arise regarding the mechanism which drives the formation of tidal tails in this cluster in spite of its large Galactocentric distance. In particular, it is worth discussing the importance of relaxation and tidal effects in the process of mass loss of this cluster.
Remarkably, the half-mass relaxation time, defined as
Spitzer & Hart (1971)
turns out to be
Gyr. This quantity is longer than the age of the
Universe and indicates that relaxation should have produced small dynamical
effect in the recent history of Palomar 14.
In the above calculation, we assumed a mean stellar mass of
and the mass estimated
above.
It is interesting to calculate the change in the estimated relaxation time
due to a different assumption of the cluster mass function.
In particular, we considered the case of a mass function equal to the Initial Mass
Function by Kroupa (2001; which is the case for a non-relaxed system) and the
mass function proposed by De Marchi et al. (2005; depleted in the low-mass
range thus simulating the effect of mass loss in a relaxed system).
By using the Marigo et al. (2008) isochrones and the initial-final mass relation
by Kruijssen (2009) we estimated M/L=1.636,
and for the Kroupa (2001) mass function
and M/L=1.351, and for that of De Marchi et al. (2005)333Note that the
M/L ratios calculated here are smaller than that provided by McLaughlin & van der
Marel (2005) because of the different stellar models adopted by these authors.
This difference increases furthermore the estimated relaxation time, reinforcing
the derived conclusion..
Therefore, although the adoption of a different mass function can reduce the
estimated relaxation time of , it always results larger than the
cluster age.
According to the above considerations, it seems that relaxation cannot be
responsible for the recent mass loss experienced by Palomar 14.
Note however that relaxation driven expansion causes clusters to evolve towards
larger half-mass radii as mass loss proceeds (Gieles et al. 2010), increasing the estimated relaxation time. It is therefore possible
that during its past evolution the relaxation time of Palomar 14 was
shorter than its age. In this regard, the lack of relaxation in Palomar 14 is
strongly supported by the non-segregated radial distribution of the massive
Blue Straggler Stars (Beccari et al., in preparation).
Another important mechanism of mass loss is due to the tidal interaction of Palomar 14 with the Galactic potential. In this case the mass loss is due to the continuous stripping of ”former” extra-tidal stars (i.e. the same process at work in the tidal destruction of Sagittarius) and by tidal shocks. The evidence that a significant fraction of cluster stars exceed the present-day tidal radius suggests that this effect can be significant in this stellar system. Taylor & Babul (2001) performed extensive N-Body simulation to estimate the mass loss rate for the above mechanism and provided useful analytical relations. To test the efficiency of this mechanisms, we estimated the predicted destruction rates for different orbital eccentricities. For this purpose, we assumed the cluster presently at apocenter and adopted the cluster structural parameters of the best-fit Wilson (1975) model reported above. We adopted the method outlined by Taylor & Babul (2001), assuming the cluster orbiting in the logarithmic Galactic potential defined by Baumgardt & Makino (2003). In Fig. 8 the mass loss rate estimated for the last orbit of Palomar 14 is shown as a function of the orbital eccentricity. It is apparent that tidal stripping is very efficent even at small orbital eccentricity. The observational estimate of the disruption rate is also indicated in Fig.8. A good agreement is found between the estimated value of and that predicted for a non-relaxed system orbiting on a circular orbit.

4. Discussion
The evidence reported in the previous section strongly indicate that Palomar 14 is currently in a stage of tidal disruption.
In fact, the cluster appears to extend up to 20’ and beyond, i.e. at least 4 times the previous estimates of its tidal radius. The decrease of the radial density profile indicates that the remnant has a symmetry respect to the cluster center and cannot be addressed to any foreground or background structure (see, e.g., Martinez-Delgado et al. 2002, Bellazzini et al. 2003). In fact, the typical size of satellite system (such as the stream of an extinct galaxy) is 4 kpc (Mateo 1998) and should therefore be recognizable as a flat homogeneously distributed overdensity over the relatively small (1 sq. deg.) area covered by our observations.
It is difficult to explain the anomalous distribution of cluster stars by simply assuming a larger tidal radius. The stars located in the outermost region of the cluster (at distances 15’ from the center) have indeed a very anisotropic distribution forming a collimated tail which is symmetrical on both sides of the cluster. Moreover, the measured tidal radius exceeds the maximum Roche radius by more than a factor of two (see Sect. 3.3). In spite of the large uncertainties involved in the maximum Roche radius estimate, no stars are expected to be bound to the cluster at distances .
The coherence and the symmetry of the overdensity measured in our sample strongly suggest the presence of a pair of tidal tails surrounding this cluster. The ellipticity and the orientation of the tails appears to change as a function of the distance from the cluster center. This is also predicted by dynamical simulation of dissolving stellar systems in a Galactic tidal field (Montuori et al. 2007; Klimentowsi et al. 2009). In fact, while the central region of the cluster is expected to be elongated towards the Galactic center (see Fig. 4), the external regions should roughly be aligned with the cluster orbit. In the same way, while in the inner regions the tidal tails are expected to marginally affect the cluster ellipticity, in the outer regions they should dominate the shape of the density contours increasing the measured ellipticity (see Fig. 6). Unfortunately, the distance of this object prevents a direct measure of its proper motion. A curious agreement is found between the direction of the tail and the expected proper motion provided by Lynden-Bell & Lynden-Bell (1995) in the assumption that Palomar 14 belongs to a stream comprising Fornax and Palomar 15.
This is the first time that a significant tidal tail is discovered in an outer halo cluster ( at Galactocentric distances ). The tidal field in such an external region of the Galaxy is very small and even a loose GC in a quasi-circular orbit is not expected to suffer a strong tidal stirring (Lee et al. 2006; Fellhauer & Lin 2007). However, the structure of Palomar 14 appears to be quite peculiar among Galactic GCs: it has in fact the largest half-light radius and a modest mass. Its low density makes it very susceptible to the tidal strain of the Milky Way halo. This is also confirmed by the location of the Roche radius inside the cluster tidal radius and by the relatively high mass-loss rate (see Sect. 3.3).
The peculiar structural properties of Palomar 14 constrains its orbit and nature. In Fig. 9 the location of Palomar 14 in the diagram is shown along with Galactic GCs and satellites dwarf galaxies discovered over the past ten years. Palomar 14 stands in an intermediate position between the loci of Galactic GCs and satellite galaxies. The area of the diagram populated by faint objects is a region where the separation between GCs and dwarf galaxies is perhaps somewhat blurred. Yet, evidence for large diffuse clusters orbiting around M31 (catalog ) (Chapman et al. 2008), NGC 1023 (catalog ) (Larsen & Brodie 2000; Brodie & Larsen 2002) and in the ACS Virgo Cluster survey (Peng et al. 2006) are now coming to light.
We cannot exclude the possibility that the cluster is also the remnant of an ancient galaxy progressively disrupted by the interaction with the Milky Way potential. In this case, however, the photometry and internal kinematics severely constrain the scenario. First, the CMD presents a narrow Red Giant Branch (RGB) and a compact Red Clump (as found in previous HST studies; Dotter et al. 2008), suggesting a very homogeneous chemical composition. Second, the recent spectroscopic analysis by Jordi et al. (2009) yields a very small velocity dispersion (km s-1) which translates into a mass-to-light ratio . Note that the M/L ratio of a galaxy remnant is expected to increase with time as a result of the continuous loss of stars (Peñarrubia et al. 2008).
The fraction of stars located in the tails indicates a significant mass loss rate (). An even larger rate is expected if eccentric orbits are considered (see Sect. 3.3). Consider that, for a mass loss rate larger than , a system with a typical GC mass () would lose more than 95% of its mass after 12 Gyr. The key question is therefore how this old cluster has survived the tidal interaction in spite of its small density. Two hypotheses, which are not mutually exclusive, can be put forward: (i) Palomar 14 follows an external orbit confined to the peripheral regions of the Galactic halo and/or (ii) it formed in a satellite galaxy later accreted by the Milky Way. In the former scenario, the cluster spent most of its evolution in a peripheral region of the Galaxy (at distances always 60 kpc) and experienced only a minor tidal stirring from the Milky Way which allowed its survival until the present epoch. In the latter scenario, the cluster evolved in an environment where it could form and survive without suffering the strong tidal effect of the Milky Way.
After all, in the case of M31, most, if not all, extended GCs at distances larger than 30 kpc appear to be associated with streams (Chapman et al. 2008; Forbes et al. 2010; Mackey et al. 2010). This seems to suggest that extended clusters follow different formation/evolutionary processes depending on their birth places. It would therefore not be very surprising if Palomar 14 would be yet another example of the on-going accretion populating the stellar Galactic halo.

Facilities: CFHT
References
- Abazajian et al. (2009) Abazajian, K. N., et al. 2009, ApJS, 182, 543
- Allen et al. (2006) Allen, C., Moreno, E., & Pichardo, B. 2006, ApJ, 652, 1150
- Armandroff et al. (1992) Armandroff, T. E., Da Costa, G. S., & Zinn, R. 1992, AJ, 104, 164
- Baumgardt & Makino (2003) Baumgardt, H., & Makino, J. 2003, MNRAS, 340, 227
- Baumgardt et al. (2005) Baumgardt, H., Grebel, E. K., & Kroupa, P. 2005, MNRAS, 359, L1
- Bellazzini et al. (2003) Bellazzini, M., Ibata, R., Ferraro, F. R., & Testa, V. 2003, A&A, 405, 577
- Belokurov et al. (2006) Belokurov, V., Evans, N. W., Irwin, M. J., Hewett, P. C., & Wilkinson, M. I. 2006a, ApJ, 637, L29
- Belokurov et al. (2006) Belokurov, V., et al. 2006b, ApJ, 647, L111
- Belokurov et al. (2007) Belokurov, V., et al. 2007, ApJ, 654, 897
- Brodie & Larsen (2002) Brodie, J. P., & Larsen, S. S. 2002, AJ, 124, 1410
- Cerviño & Valls-Gabaud (2003) Cerviño, M., & Valls-Gabaud, D. 2003, MNRAS, 338, 481
- Chapman et al. (2008) Chapman, S. C., et al. 2008, MNRAS, 390, 1437
- Chun et al. (2010) Chun, S.-H., et al. 2010, AJ, 139, 606
- Carraro (2009) Carraro, G. 2009, AJ, 137, 3809
- Carraro et al. (2007) Carraro, G., Zinn, R., & Moni Bidin, C. 2007, A&A, 466, 181
- de Marchi et al. (2005) de Marchi, G., Paresce, F., & Portegies Zwart, S. 2005, The Initial Mass Function 50 Years Later, 327, 77
- Dotter et al. (2008) Dotter, A., Sarajedini, A., & Yang, S.-C. 2008, AJ, 136, 1407
- Fellhauer & Lin (2007) Fellhauer, M., & Lin, D. N. C. 2007, MNRAS, 375, 604
- Ferraro et al. (1999) Ferraro, F. R., Messineo, M., Fusi Pecci, F., de Palo, M. A., Straniero, O., Chieffi, A., & Limongi, M. 1999, AJ, 118, 1738
- Forbes & Bridges (2010) Forbes, D. A., & Bridges, T. 2010, MNRAS, 404, 1203
- Gieles et al. (2010) Gieles, M., Baumgardt, H., Heggie, D. C., & Lamers, H. J. G. L. M. 2010, MNRAS, L127
- Girardi et al. (2005) Girardi, L., Groenewegen, M. A. T., Hatziminaoglou, E., & da Costa, L. 2005, A&A, 436, 895
- Grillmair & Dionatos (2006) Grillmair, C. J., & Dionatos, O. 2006, ApJ, 641, L37
- Grillmair et al. (1995) Grillmair, C. J., Freeman, K. C., Irwin, M., & Quinn, P. J. 1995, AJ, 109, 2553
- Harris (1996) Harris, W. E. 1996, AJ, 112, 1487
- Harris & van den Bergh (1984) Harris, W. E., & van den Bergh, S. 1984, AJ, 89, 1816
- Hernandez & Valls-Gabaud (2008) Hernandez, X., & Valls-Gabaud, D. 2008, MNRAS, 383, 1603
- Irwin & Hatzidimitriou (1995) Irwin, M., & Hatzidimitriou, D. 1995, MNRAS, 277, 1354
- Johnston et al. (1999) Johnston, K. V., Sigurdsson, S., & Hernquist, L. 1999, MNRAS, 302, 771
- Johnston et al. (1995) Johnston, K. V., Spergel, D. N., & Hernquist, L. 1995, ApJ, 451, 598
- Jordi et al. (2009) Jordi, K., et al. 2009, AJ, 137, 4586
- King (1966) King, I. R. 1966, AJ, 71, 64
- Klimentowski et al. (2009) Klimentowski, J., Łokas, E. L., Kazantzidis, S., Mayer, L., Mamon, G. A., & Prada, F. 2009, MNRAS, 400, 2162
- Kroupa (2001) Kroupa, P. 2001, MNRAS, 322, 231
- Kruijssen (2009) Kruijssen, J. M. D. 2009, A&A, 507, 1409
- Küpper & Kroupa (2010) Küpper, A. H. W., & Kroupa, P. 2010, ApJ, 716, 776
- Kuhn et al. (1996) Kuhn, J. R., Smith, H. A., & Hawley, S. L. 1996, ApJ, 469, L93
- Larsen & Brodie (2000) Larsen, S. S., & Brodie, J. P. 2000, AJ, 120, 2938
- Law et al. (2003) Law, D. R., Majewski, S. R., Skrutskie, M. F., Carpenter, J. M., & Ayub, H. F. 2003, AJ, 126, 1871
- Lee et al. (2003) Lee, K. H., Lee, H. M., Fahlman, G. G., & Lee, M. G. 2003, AJ, 126, 815
- Lee et al. (2006) Lee, K. H., Lee, H. M., & Sung, H. 2006, MNRAS, 367, 646
- Leon et al. (2000) Leon, S., Meylan, G., & Combes, F. 2000, A&A, 359, 907
- Lynden-Bell & Lynden-Bell (1995) Lynden-Bell, D. & Lynden-Bell, R.M. 1995, MNRAS, 275, 429
- Mackey & Gilmore (2004) Mackey, A. D., & Gilmore, G. F. 2004, MNRAS, 355, 504
- Mackey et al. (2010) Mackey, A.D. et al. 2010, ApJ, 717, L11
- Marigo et al. (2008) Marigo, P., Girardi, L., Bressan, A., Groenewegen, M. A. T., Silva, L., & Granato, G. L. 2008, A&A, 482, 883
- Martínez Delgado et al. (2004) Martínez Delgado, D., Dinescu, D. I., Zinn, R., Tutsoff, A., Côté, P., & Boyarchuck, A. 2004, Satellites and Tidal Streams, 327, 255
- Martínez-Delgado et al. (2002) Martínez-Delgado, D., Zinn, R., Carrera, R., & Gallart, C. 2002, ApJ, 573, L19
- Mateo (1998) Mateo, M. L. 1998, ARA&A, 36, 435
- McLaughlin & van der Marel (2005) McLaughlin, D. E., & van der Marel, R. P. 2005, ApJS, 161, 304
- Montuori et al. (2007) Montuori, M., Capuzzo-Dolcetta, R., Di Matteo, P., Lepinette, A., & Miocchi, P. 2007, ApJ, 659, 1212
- Niederste-Ostholt et al. (2010) Niederste-Ostholt, M., Belokurov, V., Evans, N. W., Koposov, S., Gieles, M., & Irwin, M. J. 2010, MNRAS, 408, L66
- Odenkirchen et al. (2001) Odenkirchen, M., et al. 2001, ApJ, 548, L165
- Odenkirchen et al. (2003) Odenkirchen, M., et al. 2003, AJ, 126, 2385
- Peñarrubia et al. (2008) Peñarrubia, J., Navarro, J. F., & McConnachie, A. W. 2008, ApJ, 673, 226
- Peñarrubia et al. (2009) Peñarrubia, J., Navarro, J. F., McConnachie, A. W., & Martin, N. F. 2009, ApJ, 698, 222
- Peng et al. (2006) Peng, E. W., et al. 2006, ApJ, 639, 838
- Plummer (1911) Plummer, H. C. 1911, MNRAS, 71, 460
- Prieto & Gnedin (2008) Prieto, J. L., & Gnedin, O. Y. 2008, ApJ, 689, 919
- Rockosi et al. (2002) Rockosi, C. M., et al. 2002, AJ, 124, 349
- Searle & Zinn (1978) Searle, L., & Zinn, R. 1978, ApJ, 225, 357
- Silverman (1986) Silverman, B. W. 1986, Monographs on Statistics and Applied Probability (London: Chapman and Hall)
- Sollima & Nipoti (2010) Sollima, A., & Nipoti, C. 2010, MNRAS, 401, 131
- Spitzer & Hart (1971) Spitzer, L., Jr., & Hart, M. H. 1971, ApJ, 164, 399
- Stetson (1987) Stetson, P. B. 1987, PASP, 99, 191
- Taylor & Babul (2001) Taylor, J. E., & Babul, A. 2001, ApJ, 559, 716
- Testa et al. (2000) Testa, V., Zaggia, S. R., Andreon, S., Longo, G., Scaramella, R., Djorgovski, S. G., & de Carvalho, R. 2000, A&A, 356, 127
- Trager et al. (1995) Trager, S. C., King, I. R., & Djorgovski, S. 1995, AJ, 109, 218
- Willman et al. (2005) Willman, B., et al. 2005, AJ, 129, 2692
- Wilson (1975) Wilson, C. P. 1975, AJ, 80, 175
- Zou et al. (2009) Zou, H., Wu, Z.-Y., Ma, J., & Zhou, X. 2009, RAA, 9, 1131
- Zucker et al. (2006) Zucker, D. B., et al. 2006a, ApJ, 650, L41
- Zucker et al. (2006) Zucker, D. B., et al. 2006b, ApJ, 643, L103