The interactions of winds from massive young stellar objects
Abstract: The supersonic stellar and disk winds possessed by massive young stellar objects will produce shocks when they collide against the interior of a pre-existing bipolar cavity (resulting from an earlier phase of jet activity). The shock heated gas emits thermal X-rays which may be observable by spaceborne observatories such as the Chandra X-ray Observatory. Hydrodynamical models are used to explore the wind-cavity interaction. Radiative transfer calculations are performed on the simulation output to produce synthetic X-ray observations, allowing constraints to be placed on model parameters through comparisons with observations. The model reveals an intricate interplay between the inflowing and outflowing material and is successful in reproducing the observed X-ray count rates from massive young stellar objects.
1 Introduction
Observational and theoretical advances have provided increasing evidence that massive star formation is not merely a scaled-up version of lower-mass star formation. However, there are some similarities. For instance, both involve outflows (Garay & Lizano 1999; Reipurth & Bally 2001; Banerjee & Pudritz 2006, 2007) and bipolar cavities are commonly observed around both high and low mass young stellar objects (Garay & Lizano 1999). The widths of IR recombination line emission observed from massive young stellar objects (MYSOs) indicates the presence of dense ionized outflows with velocities ranging from 100 to (Drew, Bunn, & Hoare 1993; Bunn, Hoare, & Drew 1995). Further confirmation of outflows has come from high angular resolution radio observations (e.g. Hoare et al. 1994; Hoare 2006; Curiel et al. 2006). One explanation would be a disk wind driven by radiation pressure at the surface of the disk (e.g. Drew et al. 1998).
X-rays have been detected from deeply embedded MYSOs in star forming regions by the Chandra X-ray observatory (hereafter Chandra)(e.g. Broos et al. 2007; Wang et al. 2007). Preibisch et al. (2002) found that the X-ray emission from IRS3 A and C, with a count rate of for the former, could not be explained by the standard scenario for massive stars (i.e. wind embedded shocks produced by instabilities inherent in radiatively-driven winds - see Owocki, Castor, & Rybicki 1988), yet the estimated stellar masses of these objects implies they will have radiative outer envelopes which poses problems for the generation of X-rays through magnetic star/disk interactions.
A potential source of X-rays which has not been considered before is the collision between the stellar and disk winds and the infalling envelope. We explore this scenerio using hydrodynamical models and find that the interaction of the stellar and disk wind with the cavity wall produces shock heated plasma which emits X-rays in agreement with Chandra observations (Parkin et al. 2009).
The remainder of this work is structured as follows: in § 2 we describe the winds-cavity model, in § 3 we present the result of the hydrodynamic simulations and X-ray calculations, and in § 4 we close with our conclusions.
2 The winds-cavity interaction model
The model consists of a MYSO situated at the centre of a previously evacuated bipolar cavity which is surrounded by infalling molecular cloud material. We include the stellar wind and a disk wind which emanates from the surface of the circumstellar accretion disk; both are assumed to be at terminal velocity. Due to the spatial scales under consideration we do not attempt to model the radiative driving of the winds as this requires high spatial resolution in the vicinity of the star/disk (e.g. Proga et al. 1998). For simplicity we adopt an angle dependent wind prescription based on the models of Proga et al. (1998), Drew et al. (1998), and Sim et al. (2005), whereby the stellar wind occupies a region from a polar angle and the disk wind occupies the region from . The density and velocity distibutions for the infalling cloud material are described by the equations of Terebey et al. (1984), and a simple analytical prescription similar to that of Alvarez et al. (2004) is used to determine the morphology of the pre-existing outflow cavity. We model the winds-cavity interaction in 2D cylindrical symmetric coordinate system using VH-1 (Blondin et al. 1990). The code uses the piecewise-parabolic method of Colella & Woodward (1984) to solve the hydrodynamic equations on a fixed grid. Further details of the model can be found in Parkin et al. (2009).
We consider a 30 O8V star with a mass-loss rate of and terminal wind speed of 2000. The disk wind has a mass-loss rate of and a terminal wind speed of 400. The unshocked winds are assumed to be at a temperature of K. The mass infall rate for the cloud is and the cavity opening angle is 30∘ . The winds-cavity interaction was followed for a simulation time of yrs.
To allow a comparison to be made between Chandra X-ray observations of MYSOs and the simulations we calculate attenuated X-ray fluxes. The emissivity values used are for optically thin gas in collisional ionization equilibrium obtained from look-up tables calculated from the MEKAL plasma code (Liedahl, Osterheld, & Goldstein 1995 and references there-in). Ray-tracing calculations are performed with an inclination angle (to the pole) of .
In this work we only consider one set of parameters, and we refer the reader to Parkin et al. (2009) for a detailed parameter space exploration.
3 Results
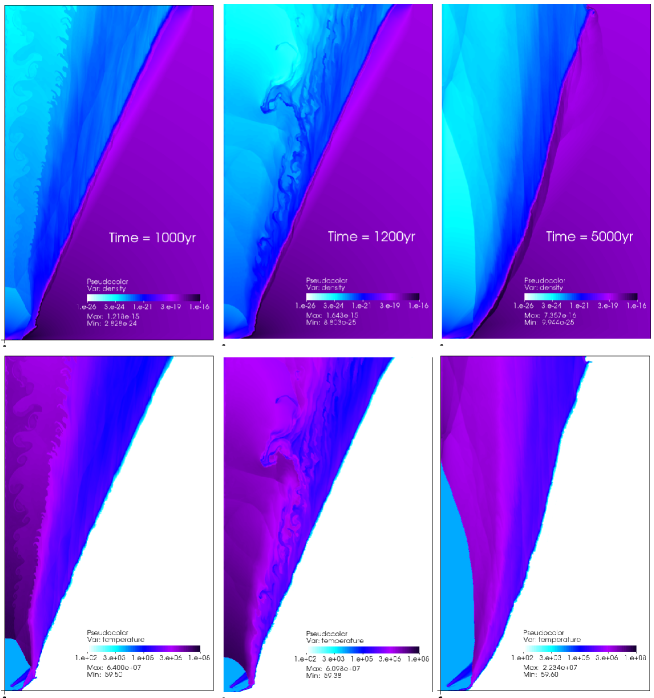
Fig. 1 shows the spatial distribution of material in the simulation; the disk wind lines the cavity wall and separates the stellar wind from the infalling molecular cloud material. The winds in the simulation are supersonic, and their collision against the cavity wall generates a reverse shock close to the star (AU). Because the ram pressure of the inflow/outflow is angle dependent and the base of the cavity is subject to instabilities the position of the reverse shock oscillates, and its shape is often non-spherical. This is due to small fluctuations in the shape and size of the base of the cavity wall as inflowing material is ablated and incorporated into the outflow, and as new inflowing material replenishes it (see Fig. 1). The shear layer between the stellar and disk winds provides a site for the growth of AU (cm) amplitude Kelvin-Helmholtz instabilities on timescales of a few years. By yrs an instability of this proportion can be seen driving a clump of disk wind material into the path of the stellar wind, which leads to mass-loading of the latter.
At a simulation time of yrs, the intrinsic X-ray emission comes mainly from disturbed cloud material (), then the disk wind (), and finally the stellar wind (). The shock driven into the cloud is too slow to heat gas up to X-ray emitting temperatures, but large quantities of cloud material are ablated by the outflowing disk wind and mixed into this hotter flow111Note that some heating of the cloud material may occur due to numerical heat conduction between the hot postshock disk wind and the cooler cloud material (Parkin & Pittard 2010).. This process heats the cloud material to temperatures where (soft) X-rays are emitted. However, the difference between the attenuated luminosities of the cloud and stellar wind components is very small ( and , respectively). The explanation is that the stellar wind emission is harder and extends to higher energies, and is less affected by attenuation. In contrast, the cloud material, which is heated to lower temperatures, emits prolifically at low energies and has a much higher intrinsic luminosity, but its emission is subject to considerable attenuation at keV. Although some variation in X-ray emission occurs due to fluctuations in the position of the reverse shock, these values are indicative of the mean luminosities from the simulation.
The total attenuated luminosity from the model is which, when placed at a distance of 1 kpc and convolved with the Chandra effective area, equates to a count rate of . Interestingly, this is in approximate agreement with X-ray count rates of and inferred from observations of Mon R2 IRS 3A by Preibisch et al. (2002) and for S106 IRS4 by Giardino, Favata, & Micela (2004), respectively.
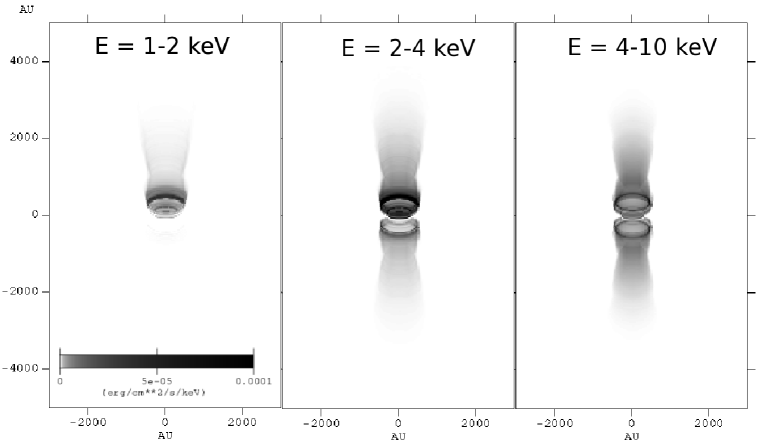
Examining synthetic broadband X-ray images calculated from the simulation output one can see that the observable X-ray emission in the 1-2, 2-4, and 4-10 keV bands originates from similar regions of the cavity (Fig. 2). The peak in the intensity in the three bands have common origins near the reverse shock, and are mainly generated by shocked stellar and disk wind material. Importantly, the spatial extents of the detectable emission in all three energy bands (1-2, 2-4, and 4-10 keV) are just below the resolution limit of Chandra () and so this model is consistent with the unresolved nature of real MYSOs.
4 Conclusions
The wind-cavity interaction around an embedded MYSO has been studied using hydrodynamic simulations and X-ray calculations. In summary, the collision of the winds against the cavity wall generates a reverse shock close to the star (AU). The shock heated gas produces X-ray emission with an integrated count rate () and spatial extent () in agreement with observations of MYSOs by Chandra.
We close with a note that future X-ray satellites, such as the International X-ray Observatory (IXO), may have the potential to resolve the spatial extent of the X-ray emission from the winds-cavity interaction. If this were the case, the winds-cavity model could be used in concert with detailed analysis at infra-red wavelengths to place unsurpassed constraints on the parameters of MYSO outflows.
Acknowledgements
ERP thanks The University of Leeds and PRODEX for funding.
References
Alvarez C., Hoare M., & Lucas P. 2004, A&A, 419, 203
Banerjee R. & Pudritz R. E. 2006, ApJ, 641, 949
Banerjee R. & Pudritz R. E. 2007, ApJ, 660, 479
Blondin J. M., et al. 1990, ApJ, 356, 591
Broos P. S., et al. 2007, ApJS, 169, 353
Bunn J. C., Hoare M. G., & Drew J. E. 1995, MNRAS, 272, 346
Colella P. & Woodward P. R. 1984, J. Comput. Phys., 54, 174
Drew J. E., Bunn J. C., & Hoare M. G. 1993, MNRAS, 265, 12
Drew J. E., Proga D., & Stone J. M. 1998, MNRAS, 296, L6
Garay G. & Lizano S. 1999, PASP, 111, 1049
Giardino G., Favata F., & Micela G. 2004, A&A, 424, 965
Hoare M. G. 2006, ApJ, 649, 856
Hoare M. G., Drew J. E., Muxlow T. B., & Davis R. J. 1994, ApJ, 421, L51
Liedahl D. A., Osterheld A. L., & Goldstein W. H. 1995, ApJL, 438, L115
Owocki S. P., Castor J. I., & Rybicki G. B. 1988, ApJ, 335, 914
Parkin E. R., & Pittard J. M. 2010, MNRAS, 406, 2373
Parkin E. R., Pittard J. M., Hoare M. G., Wright N. J., & Drake J. J., 2009, MNRAS, 400, 629
Preibisch T., Balega Y. Y., Schertl D., & Weigelt G. 2002, A&A, 392, 945
Proga D., Stone J. M., & Drew J. E. 1998, MNRAS, 295, 595
Reipurth B. & Bally J. 2001, ARA&A, 39, 403
Sim S. A., Drew J. E., & Long K. S. 2005, MNRAS, 363, 615
Terebey S., Shu F. H., & Cassen P. 1984, ApJ, 286, 529
Wang J., Townsley L. K., Feigelson E. D., Getman K. V., Broos P. S., Garmire G. P., & Tsujimoto M. 2007, ApJS, 168, 100