Dynamics of extended AGB star envelopes
Abstract
The dust formed in extended circumstellar envelopes of long-period variables and Miras has a strong influence on the envelope dynamics. A radiatively driven instability caused by the formation of dust leads to the development of an autonomous dynamics characterised by a set of distinct frequencies. We study the interplay between the envelope’s internal dynamics and an external excitation by a pulsating star.
1 Introduction
Long-period variables (LPVs) and Miras are radially pulsating, highly evolved stars on the asymptotic giant branch (AGB). Their cool, extended atmospheres are excellent sites for the formation of complex molecules and dust particles. The interplay between dust formation and stellar radiation results in circumstellar envelopes (CSEs) generating slow mass loss, which finally enriches the interstellar medium with processed material. The observed light curves exhibit irregularities over intervals of several pulsation cycles, which are at least partially caused by the phenomenon of dust formation.
To investigate the complex dynamical behaviour of carbon-rich envelopes in detail, CSEs can be considered as nonlinear multi-oscillatory systems, whose eigenfrequencies and normal modes are controlled by the intrinsic timescales of various coupled physical and chemical processes. This is done by applying established methods of non-linear dynamics such as Fourier Analysis and the study of stroboscopic and Poincaré maps upon the results of self-consistent model calculations (Fleischer et al. 1992).
2 Eigendynamics
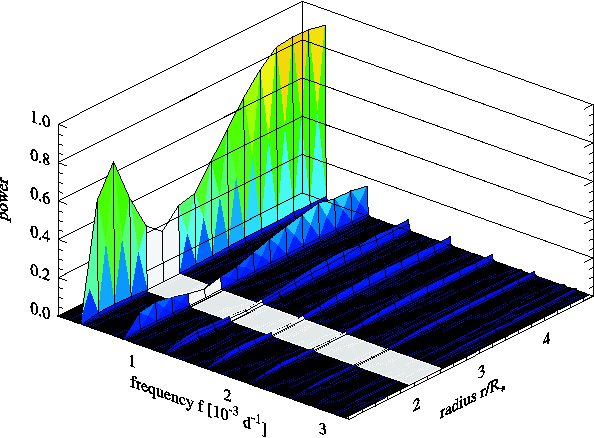
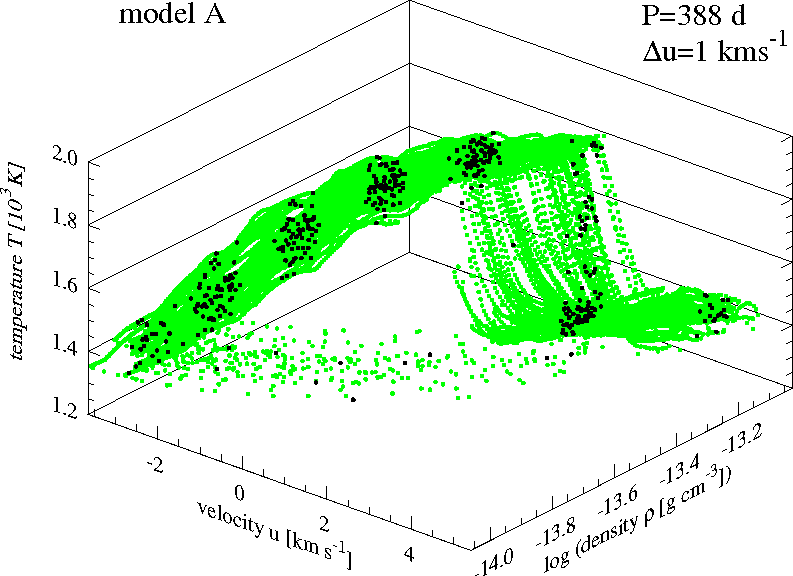
The envelopes around highly luminous AGB stars, e.g. , , , and (henceforth model A) develop a self-maintaining oscillation caused by dust formation (exterior -mechanism) even without the additional input of mechanical momentum by an underlying stellar pulsation (cf. Fleischer et al. 1995; Höfner et al. 1995). In their power spectrum (Fig. 1, left) one can clearly see the eigenfrequency and its overtones (Dreyer et al. 2009)).
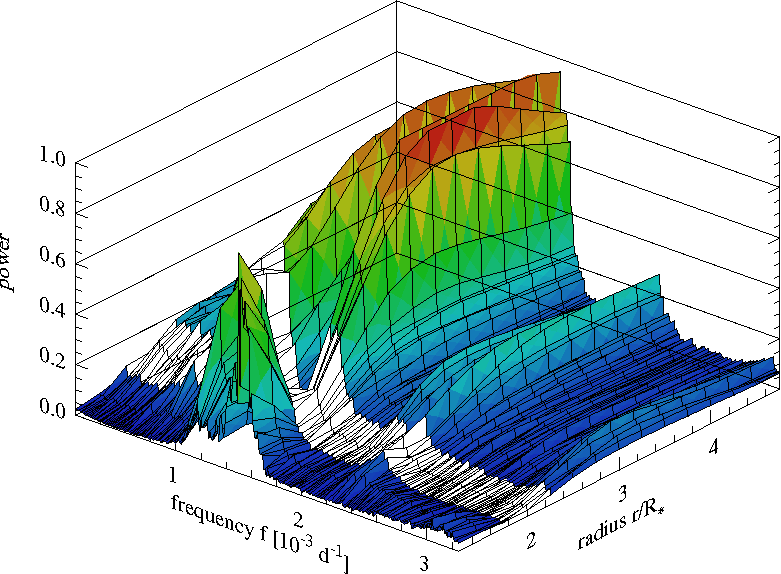
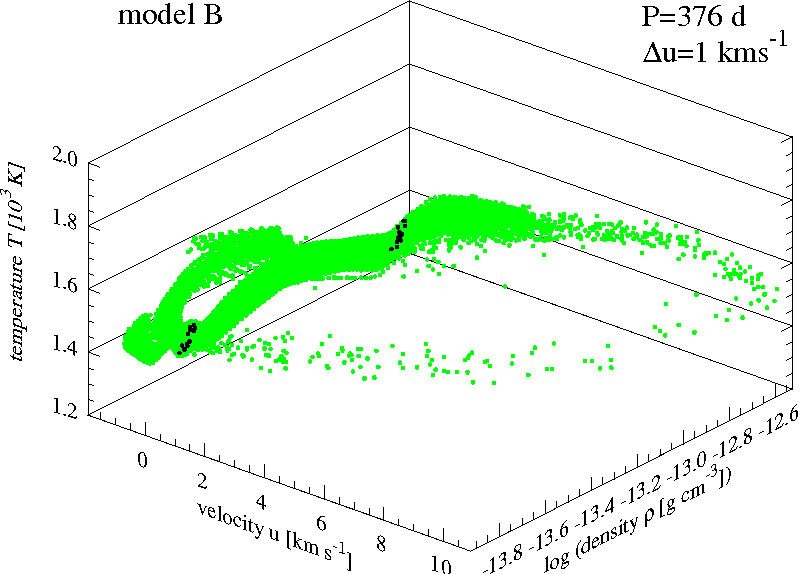
In the case of lower stellar luminosities, e.g. , , , and (henceforth model B), the system generates no self-induced oscillation. An additional input of energy and momentum is needed to determine the CSE eigendynamics. We excite such an envelope by white noise. Thereby we adopt a normal noise distribution with zero mean and intensity (see Dreyer et al. 2010). The resulting power spectrum (Fig. 1, right) exhibits different eigenmodes. The position of the minima (marked in grey) coincides with the dust nucleation zone located at . This confirms that the dust is responsible for creating the characteristic frequencies of the envelope.
3 Interaction with external excitation
Once the eigenfrequencies have been found, the question arises as to how these modes interact with an external excitation caused by the stellar pulsation. For this purpose, we studied the response of our reference models for a series of harmonic excitations with different periods P and strength . Figure 2 shows the most dominant envelope frequencies over the excitation period at constant strength. For model A (left) we can identify three different dynamic domains, namely eigenmode -dominated, irregular and pulsation-dominated domain. The same study for model B (right) reveals a similar behaviour. In contrast to model A we have not found an eigenmode dominated domain.
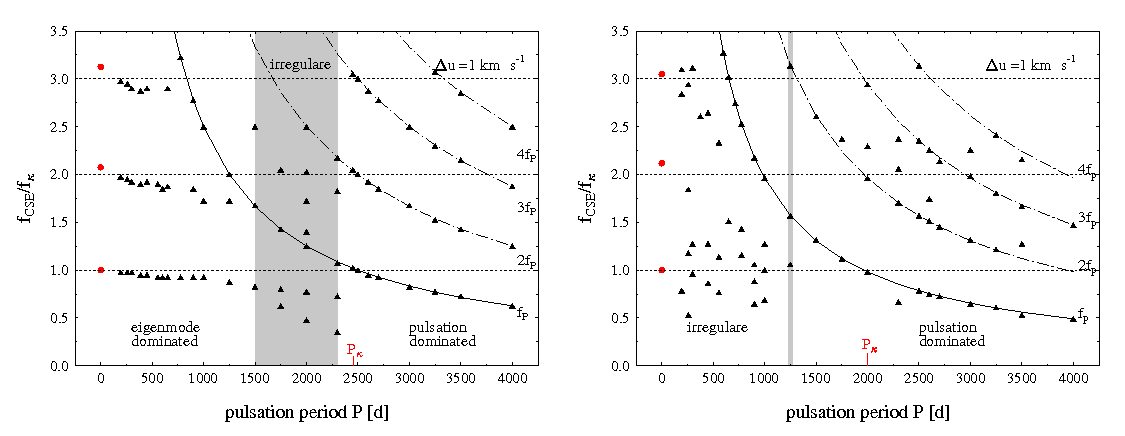
Figure 3 shows the maps of our reference models for a typical oscillation period of LPVs. In the maps it can be seen that for a constant phase angle (black) the system tends to stay inside a finite number of stripes. Similar to the orbital resonance in celestial mechanics, we can find integers and which fulfil the resonance condition . This suggest that the systems returns to the same physical state after excitation periods or resonance periods . For model A, we find that and . For model B the CSE response is double periodic, which means that the envelope period equals two times the excitation period (Dreyer et al. 2009, 2010).
4 Synthetic light curves
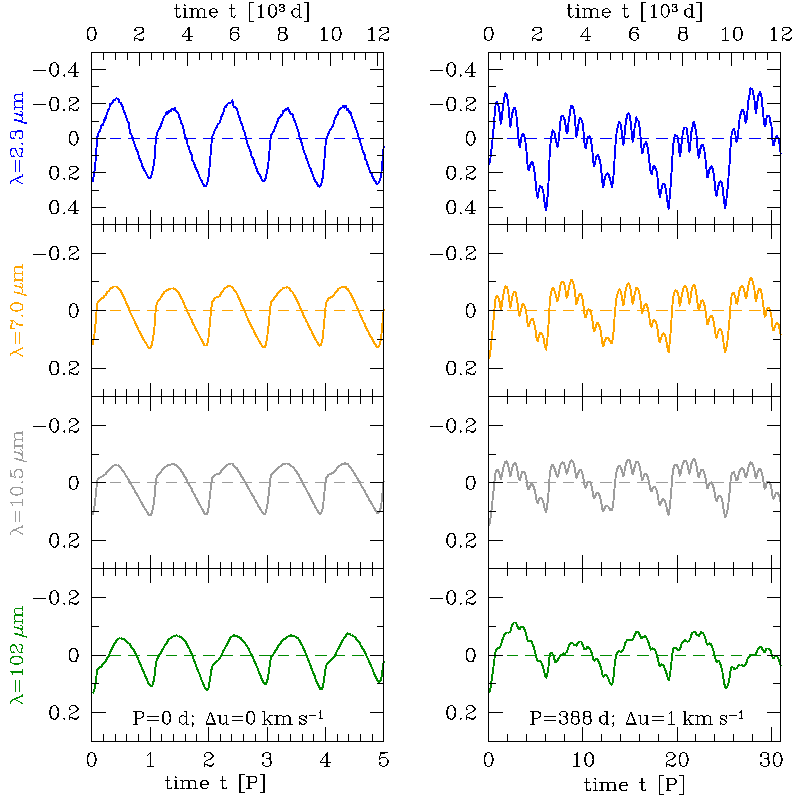
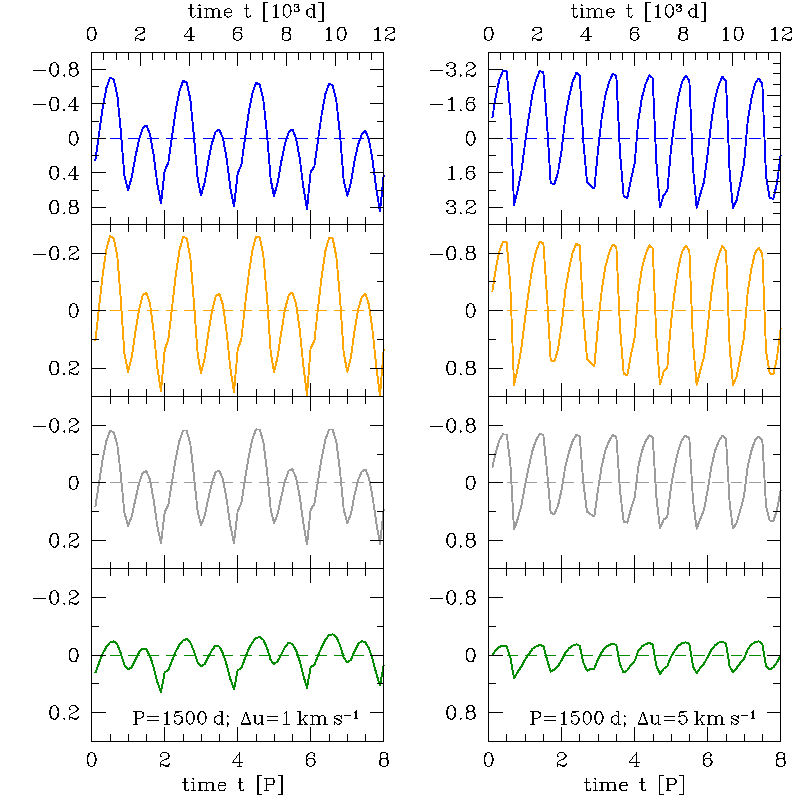
Figure 4 presents synthetic light curves for model A obtained for various excitations at several wavelengths. The light curves in the first and the last panels show monoperiodic behaviour but with differing periods. For the unexcited CDS (left) the dominant timescale is the dust formation scale , whereas in the case of the highly-excited model (right), this timescale is determined by the stellar pulsation . In the curves in the second panels the eigenperiod of the CSE and the excitation period interfere with each other. Nevertheless, the dominant timescale is the slightly shifted dust formation timescale . The light curves in the third panels show double-periodic behaviour. The eigenperiod is detuned to the first harmonic of the excitation period .
5 Special application: IRC +10216
Winters et al. (1996) have found that the fundamental parameters: , , , as well as , and well reproduce observations of IRC +10216. So, we use this set of parameter to model and investigate the dynamical behaviour of the envelope. To determine the envelope eigendynamics the investigation follows the approach used for CSEs around standard and low luminous AGB stars. Since the central star pulsates with a well defined period of (e.g. Menten et al. 2006), we excite the model exactly with this frequency. As can be seen in the power spectrum (Fig. 5, left) the CSE is dominated by the pulsation frequency and its first harmonic close to the star. With onset of dust formation at these frequencies disappear and the envelope frequency controlled by the timescale of the dust formation process gains strength. The corresponding Poincaré map (Fig. 5, right) shows four clearly distinct stripes (black). A resonance such as in the case of the previously studied models A and B is not found.
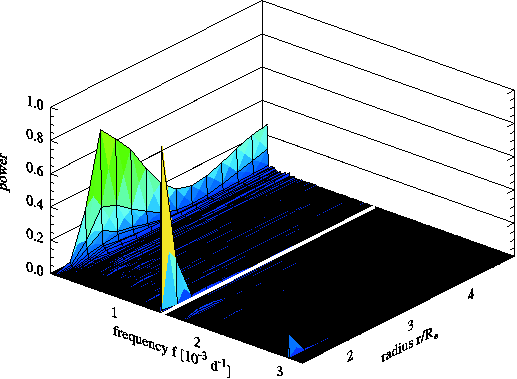
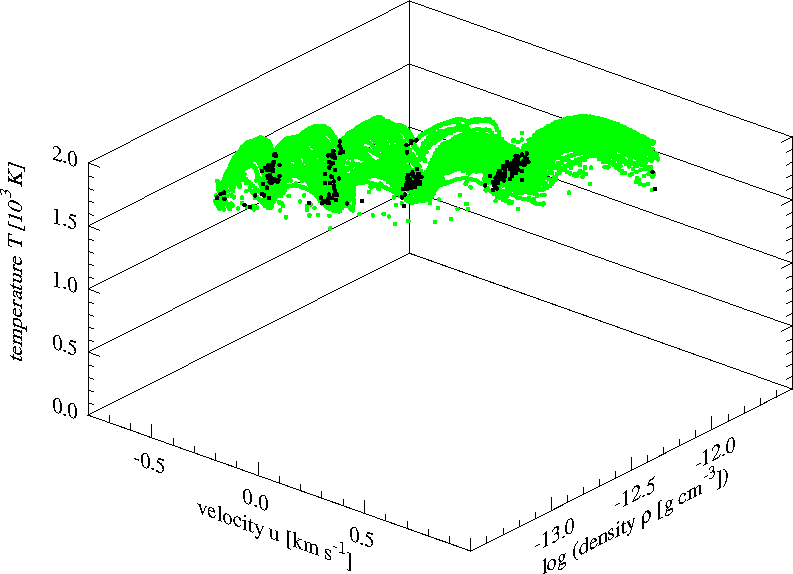
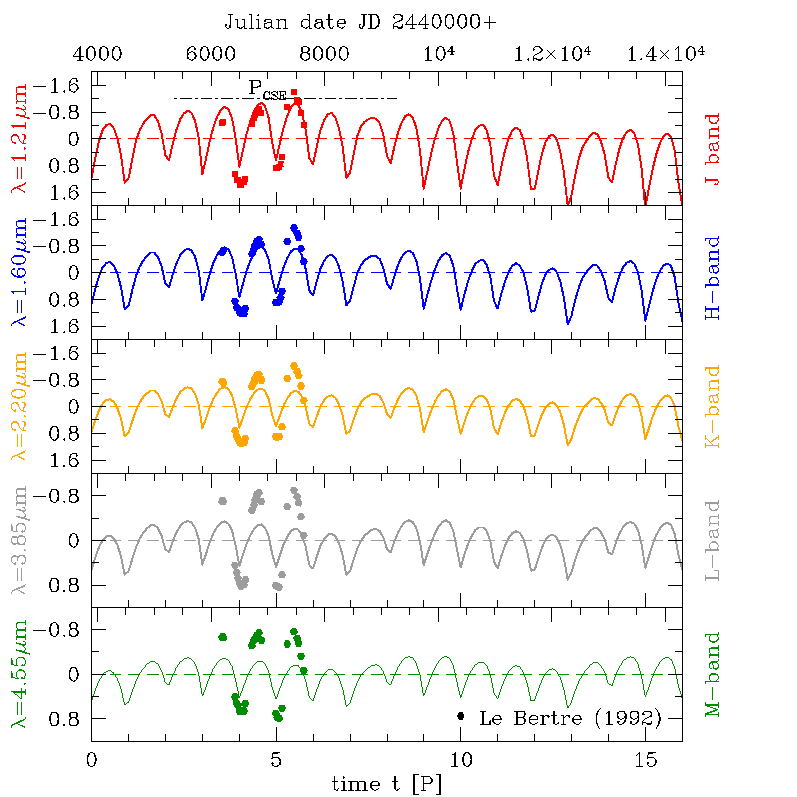
Figure 6 compares specific observations and synthetic light curves in different NIR bands. The stellar pulsation period can be seen in all bands. An additional period of six times the stellar pulsation period is also visible (dashed-dotted line). This is the dust-determined eigenperiod of the CSE . Due to the short observation period the data cannot reproduce the long envelope period. Nevertheless on can see a continuous upward trend in the observation data (J, H, K-band). This provides a hint of the underlying dust-determined period.
6 Summary
We investigated the dynamics of carbon-rich envelopes around AGB stars. We showed that the presence of dust has an important influence on the dynamical behaviour of the entire system. Firstly, it amplifies the momentum coupling between matter and radiation. Secondly, it enforces an additional dynamical behaviour (exterior - mechanism) to the dust envelope. The consequence of the coupling is the development of an autonomous envelope dynamics which is in fact excited by the stellar pulsation but caused by the timescales of physical processes in the envelope. This dynamics can be characterised by distinct frequencies which do not need to be identical with the stellar pulsation frequency. Depending on the excitation the CSEs show distinct dynamics regimes. We have found a resonance condition which relates the stellar pulsation period to the envelope modes. Besides the pulsation period, light curves exhibit timescales which are determined by the dust.
References
- Dreyer et al. (2009) Dreyer C., Hegmann M., Sedlmayr E.: 2009, A&A, 499, 765
- Dreyer et al. (2010) Dreyer C., Hegmann M., Sedlmayr E.: 2010, A&A, accepted
- Fleischer et al. (1992) Fleischer A.J., Gauger A., Sedlmayr E.: 1992, A&A, 266, 321
- Fleischer et al. (1995) Fleischer A.J., Gauger A., Sedlmayr E.: 1995, A&A, 297, 543
- Höfner et al. (1995) Höfner S., Feuchtinger M.U., Dorfi E.A.: 1995, A&A, 297, 815
- Le Bertre (1992) Le Bertre T.: 1992, A&AS 94, 377
- Menten et al. (2006) Menten K.M., Reid M.J., Krügel E., Claussen M.J., Sahai R.: 2006, A&A, 453, 301
- Winters et al. (1996) Winters J.M., Fleischer A. J., Sedlmayr E., Gauger A. H.: 1996, IAUS, 170, 146