Assessing Radiation Pressure as a Feedback Mechanism in Star-Forming Galaxies
Abstract
Radiation pressure from the absorption and scattering of starlight by dust grains may be an important feedback mechanism in regulating star-forming galaxies. We compile data from the literature on star clusters, star-forming subregions, normal star-forming galaxies, and starbursts to assess the importance of radiation pressure on dust as a feedback mechanism, by comparing the luminosity and flux of these systems to their dust Eddington limit. This exercise motivates a novel interpretation of the Schmidt Law, the – correlation, and the – correlation. In particular, the linear – correlation is a natural prediction of radiation pressure regulated star formation. Overall, we find that the Eddington limit sets a hard upper bound to the luminosity of any star-forming region. Importantly, however, many normal star-forming galaxies have luminosities significantly below the Eddington limit. We explore several explanations for this discrepancy, especially the role of “intermittency” in normal spirals—the tendency for only a small number of subregions within a galaxy to be actively forming stars at any moment because of the time-dependence of the feedback process and the luminosity evolution of the stellar population. If radiation pressure regulates star formation in dense gas, then the gas depletion timescale is 6 Myr, in good agreement with observations of the densest starbursts. Finally, we highlight the importance of observational uncertainties—namely, the dust-to-gas ratio and the CO-to-H2 and HCN-to-H2 conversion factors—that must be understood before a definitive assessment of radiation pressure as a feedback mechanism in star-forming galaxies.
Subject headings:
galaxies: general, evolution, ISM, stellar content, starburst — stars: formation1. Introduction
Understanding global star formation is crucial in understanding galaxy evolution and the assembly of the stellar population over cosmic time. Observations indicate that only a few percent of the available gas reservoir in galaxies is converted into stars per local free-fall time (Kennicutt 1998; Krumholz & Tan 2007). In addition, models of the interstellar medium (ISM) suggest that energy and momentum injected by massive stars could act as a feedback loop by driving supersonic turbulence, which would cause most of the gas to be insufficiently dense to collapse, rendering star formation inefficient (Krumholz & McKee 2005). However, the interaction between star formation and the ISM is not well understood, and a mechanism for the regulation of star formation across the large dynamic range of star-forming environments has not yet been conclusively identified. Proposed mechanisms include supernova explosions, expanding HII regions, stellar winds, cosmic rays, magnetic fields, and radiation pressure on dust (McKee & Ostriker 1977; Matzner 2002; Cunningham 2008; Chevalier & Fransson 1984; Socrates et al. 2008; Kim 2003; Scoville et al. 2001; Scoville 2003; Thompson, Quataert, & Murray 2005, hereafter TQM; Krumholz & Matzner 2009, hereafter KM09; Murray, Quataert, & Thompson 2010, hereafter MQT; Draine 2010; Hopkins et al. 2010).111ISM turbulence driven by non-stellar processes, such as disk instabilities, has also been proposed (Sellwood & Balbus 1999; Wada et al. 2002; Piontek & Ostriker 2004, 2007).
In the case of radiation pressure on dust, UV and optical radiation from OB stars is absorbed and scattered by dust grains and subsequently re-radiated as IR radiation. The dust grains are coupled to the gas of the ISM through collisions and magnetic fields, so radiation pressure on the dust exerts a force on the gas as well (O’dell et al. 1967; Ferrara 1993; Laor & Draine 1993; Murray, Quataert, & Thompson 2005). On galaxy scales, TQM showed that radiation pressure could constitute the majority of the vertical pressure support in dense starburst galaxies such as ultra-luminous infrared galaxies (ULIRGs). Likewise, models of giant molecular cloud (GMC) disruption predict that radiation pressure is the dominant feedback mechanism regulating star formation in the birth of massive star clusters (MQT; KM09). In this picture, gas in a marginally-stable galactic disk collapses to form a GMC and a central compact star cluster. When the stellar mass and luminosity of the cluster exceed the Eddington limit for dust, the overlying gas reservoir is expelled. Thus, the final stellar mass in individual star clusters is regulated by the dust Eddington limit. The centers of ULIRGs and GMC cores are optically thick to both UV and the re-radiated IR photons, which make them ideal candidates for radiation pressure support since essentially all of the momentum from the starlight is efficiently transferred to the gas. Recent observations indicate that the most luminous GMCs in the Milky Way are disrupted by radiation pressure (Murray 2010).
In this paper, we critically assess the theory of radiation pressure regulated star formation by comparing the picture developed by TQM, MQT, and KM09 with the available observations of star-forming galaxies ranging from dense individual star clusters and GMCs, to normal spiral galaxies and starbursts. In §2 we describe the current model of radiation pressure feedback. We emphasize the deviations from the simplest version of the dust Eddington limit in assessing radiation pressure regulated feedback that arise from ambiguities in the value of the flux-mean dust opacity, and the tendency for low-density galaxies to have highly intermittent knots or hotspots of star formation across their disks. In §3, we compare data from the literature to models of radiative feedback. In §4, we discuss our conclusions, the major observational and theoretical uncertainties in our analysis, and the implications of our results.
2. Theoretical Elements
The statement that radiation pressure may be an important feedback mechanism in galaxies is equivalent to the statement that galaxies as a whole or the star-forming subregions within them approach or exceed the Eddington limit for dust,
| (1) |
where is the Eddington flux, is the surface density of the dominant component of gravitational potential in the star-forming region, and is the flux-mean opacity. The overall picture is that star-forming regions meet the Eddington limit and self-regulate in analogy with an individual massive star (TQM; see also Scoville et al. 2001; Scoville 2003; MQT; KM09). We would thus naively expect to test the theory of radiation pressure regulated star formation by taking the ratio of the observed flux () to . However, a direct comparison between the simple theoretical expectation
| (2) |
and the observations is complicated by both theoretical and observational uncertainties. For example, although gas is expected to be the dominant mass component in and around massive star clusters in formation, it is unclear how best to estimate in equation (1) for unresolved galaxies or unresolved star-forming subregions. Below, we consider both CO and HCN emission (see §3; Figures 1 & 2), but the conversion from the luminosity in either of these molecular gas tracers to gas mass where the stars are forming, is highly uncertain. Another uncertainty is the coupling of the radiation field to the gas, which is complicated due to both the non-gray nature of the dust opacity and the clumpiness of the gas on all scales (see §2.1 below). Finally, there is an additional complication not readily apparent from the time-independent statement of equation (2): the star formation rate (SFR) across the face of a large spiral galaxy is highly intermittent so that only a small number of subregions are bright at any time. As discussed by MQT and in detail below (§2.2), this intermittency can cause normal star-forming galaxies to be appear significantly sub-Eddington () when only their average properties are considered, but much closer to Eddington when a model is used to take this effect into account.
2.1. The Radiation Pressure Force
The coupling between radiation and gas in star-forming environments is complex primarily because the flux-mean opacity in equation (1) has a full range of more than 3 dex, depending on whether the SED of the system considered is dominated by UV or FIR light. However, there are two distinct regimes: optically thick to UV but thin to the re-radiated FIR and optically thick to FIR. We call these the “single-scattering” and “optically thick” limits, respectively.
2.1.1 Single-scattering Limit
Regions in the single-scattering limit are optically thick to the UV but optically thin to the FIR (). This limit applies over a wide range in surface density:
| (3) |
where is the Rosseland-mean dust opacity with (see §2.1.2) and is the dust-to-gas ratio. In the single-scattering limit, UV photons are absorbed once and then re-radiated as FIR photons, which free-stream out of the medium.222Galaxies with surface densities less than 5 will be optically thin with respect to dust. Below this limit, the ionization of neutral hydrogen will becomes the dominant source of opacity. The large cross-section ( per H atom) implies an incredibly small surface density () is required for the medium to be optically thick to ionizing photons. These ionizing photons transfer momentum directly to the gas on the same order as the momentum transfer due to the single-scattering limit for dust. Thus, we encompass this limit and the single-scattering limit for dust under the same heading. Since the column-averaged flux-mean optical depth in this limit is always equal to unity, the flux-mean opacity for the single-scattering limit is . The Eddington flux is then
| (4) |
where is the gas fraction and (Wong & Blitz 2002). The wide range of column densities over which this limit is applicable implies that the average medium of most star-forming galaxies, some starbursts, and the GMCs that constitute them is single-scattering.
2.1.2 Optically Thick Limit
Dense starbursts and GMCs can reach the high gas surface densities necessary to become optically thick to FIR photons (). In this case , and depends on temperature (Bell & Lin 1994; Semenov et al. 2003). The functional form of naturally leads to two regimes: “warm” () and “hot” (, where is the dust sublimation temperature). For typical numbers, the central temperature of a massive, compact star cluster is
| (5) |
where is the effective temperature, , is the light-to-mass ratio of a zero age main sequence stellar population, , and .
Warm Starbursts
For , the Rosseland mean opacity increases as , where . In this case,
| (6) |
Remarkably, the flux necessary to support the medium is independent of (TQM).
Hot Starbursts
Intense, compact starbursts may have central temperatures greater than 200 K. The corresponding opacity is roughly constant with temperature: – for temperatures . For typical numbers,
| (7) |
The high surface densities necessary to enter this regime may only be attained in the pc-scale star formation thought to attend the fueling of bright AGN (Sirko & Goodman 2003; TQM; Levin 2007).
2.2. GMC Evolution & Intermittency
In order to gauge the importance of GMC evolution and intermittency, we adopt the simple picture presented by MQT that marginally stable () disks fragment into sub-units on the gas disk scale height () to form GMCs. An individual star cluster is born, reaches the critical Eddington luminosity threshold, and then expels the overlying gas. Importantly, the timescale for collapse and expansion of the GMC is the disk dynamical timescale, , which can be much longer than the characteristic timescale for the stellar population to decrease in total luminosity, the main-sequence lifetime of massive stars, yr. In this picture, a low-density star-forming galaxy with radius should have sub-units, but only a small fraction (the “intermittency factor”) should be bright at any one time. If each subregion reaches the Eddington luminosity for a time and is then dark, and then if a large number of subregions are averaged, one expects
| (8) |
where
| (9) | |||||
, is the number of sub-units that are “on,” and is the total number of sub-units. For example, the normal star-forming galaxy M51 has a observed bolometric luminosity () that is a factor of 4 larger than its intermittency-corrected Eddington luminosity (). Although the approximation that the stellar population is bright for a time and then dark is crude, the parameter gives us a way to judge the importance of intermittency in normal star-forming galaxies.
Note that for higher densities, decreases and at a critical surface density
| (10) |
which corresponds with a critical midplane pressure (see eq. 15). For , massive stars live longer than the time required to disrupt the parent sub-unit (). MQT argue that in this regime the massive stars continue to drive turbulence in the gas and maintain hydrostatic equilibrium in a statistical sense until , when the process then repeats until gas exhaustion.
Several additional elements of GMC evolution are important in judging whether or not the star formation of galaxies is regulated by radiation pressure on dust. First, the GMCs collapse from regions of size , with total mass , and to a size . This implies that the surface density of individual GMCs is , where can be 2–5 in the Galaxy (MQT). For example, taking ( in the single-scattering limit), , and assuming (appropriate for ), one finds that the required gas surface density for a GMC to be optically thick to the FIR is M⊙ pc-2. This GMC gas surface density would correspond to an average gas surface density for the galaxy that is times smaller (– M⊙ pc-2). Thus, the medium surrounding the central star cluster may be optically thick to the FIR even if the average gas surface density of the galaxy is less than the naive estimate given in §2.1.2.
At surface densities in excess of for the GMCs, the models of MQT rely on the fact that the medium is in fact optically-thick to FIR radiation. This is in sharp contrast to the work of KM09, where they argue that the effective optical depth is always 1 because instabilities allow the radiation to leak out of otherwise optically-thick media. MQT argue that the effective optical depth must be much larger than unity in the GMCs of dense starbursts and ULIRGs for radiation pressure to be effective as a feedback mechanism. In addition, they show that the effective momentum coupling between the radiation and the gas can exceed the naive estimate based on a disk-averaged by a factor of a few in systems as dense as the putative GMCs in Arp 220 because of the time-dependence of the GMC disruption process (see §4.3).
3. Results


We compile data of super star clusters, normal star-forming galaxies, local starburst galaxies, ULIRGs, sub-millimeter galaxies (SMGs), hyper luminous infrared galaxies, and circumnuclear starbursts to assess feedback from radiation pressure. Below, we test the hypothesis that radiation pressure is dynamically important in galaxies and star-forming subregions by comparing data to the Eddington limit (§2) on a variety of physical scales ranging from globally-averaged properties of galaxies to individual star-forming subregions within galaxies.
3.1. IR Luminosity vs. Molecular Line Luminosity
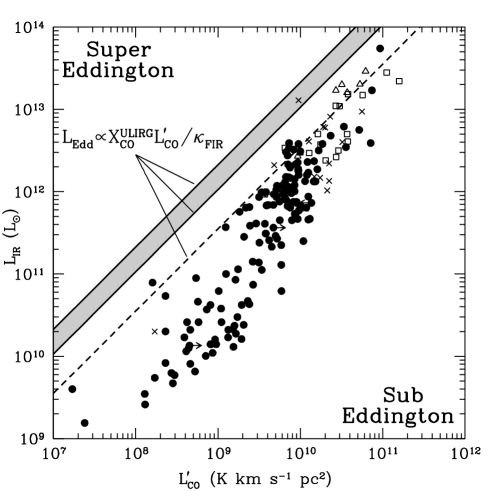
We show the total IR luminosity as a function of molecular line luminosity333We used the J = 1–0 line unless only higher order lines were available. (Figure 1) and (Figure 2) for our sample of star-forming galaxies.444Aravena et al. 2008; Becklin et al. 1980; Beelen et al. 2006; Benford et al. 1999; Capak et al. 2008; Carilli et al. 2005; Casoli et al. 1989; Chapman et al. 2005; Chung et al. 2009; Combes et al. 2010; Coppin et al. 2009; Coppin et al. 2010; Daddi et al. 2007; Daddi et al. 2009; Daddi et al. 2010a; Downes & Solomon 1998; Gao et al. 2007; Gao & Solomon 1999; Gao & Solomon 2004a,b; Genzel et al. 2003; Graciá-Carpio et al. 2008; Greve et al. 2005; Greve et al. 2006; Isaak et al. 2004; Kim & Sanders 1998; Knudsen et al. 2007; Mauersberger et al. 1996; Mirabel et al. 1990; Momjian et al. 2007; Murphy et al. 2001; Neri et al. 2003; Riechers et al. 2006; Riechers et al. 2007; Riechers et al. 2008; Sajina et al. 2008; Sakamoto et al. 2008; Sanders et al. 1991; Schinnerer et al. 2006; Schinnerer et al. 2007; Schinnerer et al. 2008; Smith & Harvey 1996; Solomon et al. 1997; Solomon & Vanden Bout 2005; Walter et al. 2003; Walter et al. 2009; Weiß et al. 2001; Yan et al. 2010; Young & Scoville 1982; Yun et al. 2001. is known to trace the total light from massive stars (e.g., Kennicutt 1998),555In reality, for normal galaxies a fraction of the UV and optical light escapes before being reprocessed by dust, and a fraction of the IR is diffuse and likely not associated with star formation (e.g., Kennicutt et al. 2010, Calzetti et al. 2010). The UV and IR luminosities are roughly equal at a bolometric luminosity of , but the UV luminosity is an order of magnitude larger than the IR luminosity at (Martin et al. 2005). Thus, we expect that galaxies with to move closer to the Eddington limit in Figure 1. whereas and provide a measure of the total gas mass and dense gas mass, respectively. Under the assumption that the total gravitational potential is dominated by the gas on the physical scales where the stars are forming, the Eddington luminosity is related to by
| (11) |
where is the -to- conversion factor and is the appropriate flux-mean or Rosseland-mean opacity (either single-scattering or optically thick; see §2.1.1–2.1.2). Although counterintuitive, the single-scattering Eddington luminosity lies below the optically thick Eddington limit because the dust opacity is column-averaged and highly non-grey (see §2.1). We adopt for normal galaxies (including a correction factor of 1.36 to account for He; Strong & Mattox 1996; Dame et al. 2001), and for galaxies with (as appropriate for starbursts and ULIRGs; e.g., Downes & Solomon 1998). Similarly, if the majority of the IR luminosity comes from regions where the dense molecular gas dominates the potential, then is related to by
| (12) |
where we explicitly write because the critical density for HCN emitting gas is large enough that these regions should always be optically-thick (§2.1.2).666Using , is larger than unity for scales pc and few cm2 g-1. In eq. 12, we take an -to- conversion factor of , but we caution that is uncertain to a factor of 3 (Gao & Solomon 2004a,b; see §4.5).
In Figure 1, the lines indicate the Eddington limit for various limiting cases. The lines in the left panel show the single-scattering Eddington limit (solid line) and the single-scattering Eddington limit accounting for intermittency (dot-dashed line) assuming and (eq. 11). The shaded region in the right panel is the optically thick Eddington limit (eq. 11 with –) and the dashed line shows the optically thick Eddington limit for an enhanced opacity (; where ) due to an assumed higher dust-to-gas ratio in dense star-forming environments. We plot the single-scattering (left panel) and optically thick (right panel) Eddington limits separately for clarity, but the data are the same in both panels. The different symbols indicate various rotational transitions of CO: solid circles (J = 1–0), crosses (J = 2–1), squares (J = 3–2), and triangles (J = 4–3).
Note that no galaxies exceed the optically thick Eddington limit and most galaxies are neither significantly super- or sub-Eddington with respect to the single-scattering Eddington limit. We caution that the applicable Eddington limit for any individual galaxy cannot be determined in this plot due to the lack of surface density measurements, which dictate the optical depth to the FIR and the relevant Eddington limit. For example, high surface density star-forming regions can be optically thick at and lie to the left of the single-scattering Eddington limit (solid line in left panel) but below the optically thick Eddington limit (shaded region in right panel). For the single-scattering limit, our assumption of kpc is accurate to a factor of 5 for most of the sample, but the single-scattering opacity scales as , so it is only accurate to a factor of 25. Some compact starbursts have radii much smaller than our assumed radius, so they are optically thick, even at low and this explains why they exceed the single-scattering limit in the left panel but are below the optically thick limit in the the right panel. In addition, note that the optically-thick Eddington limit is a hard upper bound to a galaxy’s IR luminosity, which suggests that radiation pressure feedback may set the maximum SFR of a galaxy. In the Eddington-limited model, the scatter in the – relation may be due to variations in , (see §4.5), the dust-to-gas ratio/metallicity (see §4.4), the effective radii, and the depth of the stellar potential.777Note that previous work by Krumholz & Thompson (2007) and Narayanan et al. (2008) explains the slopes of the – and – relations by comparing the critical density of the gas tracer to the median density of the ISM.
The intermittency of star formation will likely affect the Eddington limit for CO-emitting gas (dot-dashed line in left panel). traces the total molecular gas reservoir including the molecular gas that is not actively participating in star formation, such as GMC envelopes and diffuse intercloud gas. The gas mass relevant for the Eddington limit may be overestimated for galaxies in the single-scattering limit. To account for this, we multiply the Eddington luminosity by the intermittency factor for CO-emitting gas for the Milky Way value of , , , and (see eq. 8 and §2.2). The intermittency factor approaches unity when . Thus, compact star-forming regions, such as the nuclear starbursts of ULIRGs, have at low due to their very small radii (e.g., Downes & Solomon 1998).
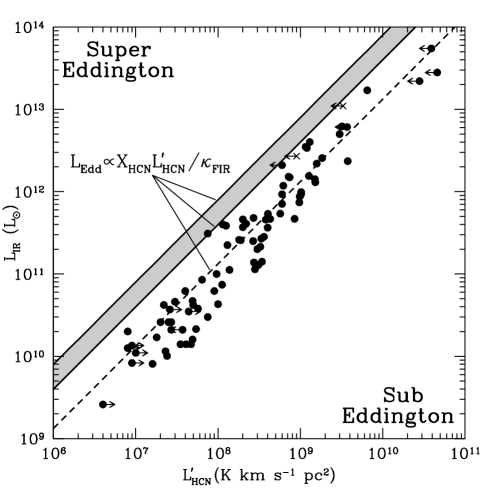
Figure 2 shows the – relation for our sample of star-forming galaxies. The shaded region represents the optically-thick Eddington limit (eq. 12 with –) and the dashed line shows the optically thick Eddington limit for an enhanced opacity (; where ), which may result from a higher dust-to-gas ratio in dense star-forming environments. The circles and crosses correspond to the J = 1–0 and the J = 2–1 rotational transitions of HCN, respectively.
The – relation (Figure 2) is tight and linear over several orders of magnitude, implying that stars form out of dense gas (Gao & Solomon 2004a,b; Wu et al. 2005). The dense gas fraction (/) is nearly constant for galaxies with (Gao & Solomon 2004b), so can be used to indirectly trace the dense gas mass . However, the dense gas fraction increases dramatically in LIRGs and ULIRGs (), so CO does not trace dense gas mass in these galaxies (Gao & Solomon 2004b). HCN, on the other hand, has a critical density for excitation that is 2 orders of magnitude larger than that of CO, so it traces dense, optically thick gas in star-forming GMC cores rather than diffuse GMC envelopes. The dynamical time for HCN-emitting gas is much less than the main-sequence lifetime of the most massive stars, so the intermittency factor for HCN-emitting gas will be approximately unity:
| (13) |
where .
If the picture of radiation pressure feedback is correct, then it should determine the – correlation directly. In fact, both the Eddington limit and the data show a linear relation between and . The galaxies closely follow but do not exceed the Eddington limit for our preferred value of the Rosseland-mean opacity (–). If the opacity is higher (), then many galaxies are consistent with Eddington and a number are super-Eddington. For any of the values of the opacity that we assume, the general agreement between and suggests that radiation pressure may play an important role in regulating star formation (Scoville et al. 2003). However, a number of important factors remain uncertain, which we discuss in §4.
3.2. Molecular Schmidt Law and Radiation Pressure
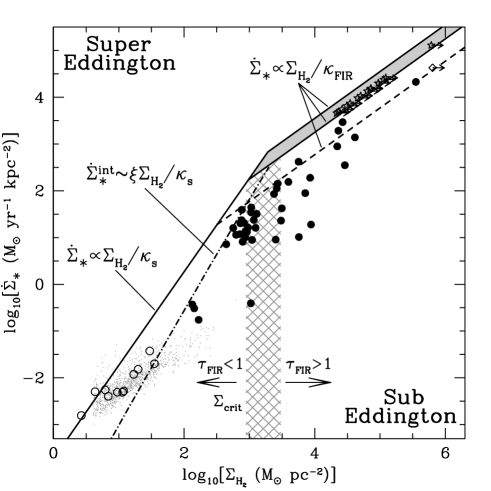
The Schmidt law is a tight power law relation between the surface density of star formation rate and the gas surface density (; Kennicutt 1998). Furthermore, Bigiel et al. (2008) found that the Schmidt law for molecular gas is linear within local star-forming galaxies (). In the left panel of Figure 3, we plot vs. for individual apertures of THINGS galaxies (small dots; Bigiel et al. 2008; Leroy et al. 2008), THINGS galaxies with detections (open circles), starburst galaxies 888Aravena et al. 2008; Becklin et al. 1980; Benford et al. 1999; Capak et al. 2008; Casoli et al. 1989; Chapman et al. 2005; Coppin et al. 2009; Coppin et al. 2010; Daddi et al. 2009; Downes & Eckart 2007; Downes & Solomon 1998; Greve et al. 2005; Knudsen et al. 2007; Mauersberger et al. 1996; Momjian et al. 2007; Neri et al. 2003; Paumard et al. 2006; Riechers et al. 2007; Riechers et al. 2008; Sajina et al. 2008; Sakamoto et al. 2008; Schinnerer et al. 2006; Schinnerer et al. 2007; Schinnerer et al. 2008; Smith & Harvey 1996; Walter et al. 2003; Walter et al. 2009; Weiß et al. 2001; Yan et al. 2010; Young & Scoville 1982; Yun et al. 2001 (solid circles), M82 super star clusters (stars; McCrady et al. 2003; McCrady & Graham 2007), and the Galactic Center star cluster (diamond; Paumard et al. 2006). We compare the data with the Eddington limit using and as proxies for the radiation and gravitational forces,
| (14) |
where is the efficiency of the conversion of mass into luminosity during the star formation process assuming a Kroupa (2001) broken power law IMF that extends up to . For star clusters we assume a light-to-mass ratio appropriate for a zero age main sequence stellar population () and that the stellar mass is a lower limit on the gas mass of the parent GMC. We use the same values as in Figure 1 and again caution that is uncertain to a factor of a few and may vary systematically from normal galaxies to starbursts (see §4.5).
For the molecular Schmidt law, we find that the Eddington limit is an upper bound to . Most star-forming regions and galaxies follow the Eddington limit (solid line) and are within 1.5 dex of it. The Eddington limit accounting for intermittency (dot-dashed line) appears to agree better with the data than the naive single-scattering Eddington limit, suggesting that intermittency may be an important effect. As the medium becomes optically thick near the critical surface density for intermittency (hatched region; see §2.2), the optically thick Eddington limit () provides a firm upper bound to for our preferred value of the dust opacity (–). If the dust opacity () is enhanced due to a higher assumed dust-to-gas ratio, then some galaxies reach the optically thick Eddington limit and a few galaxies exceed it.
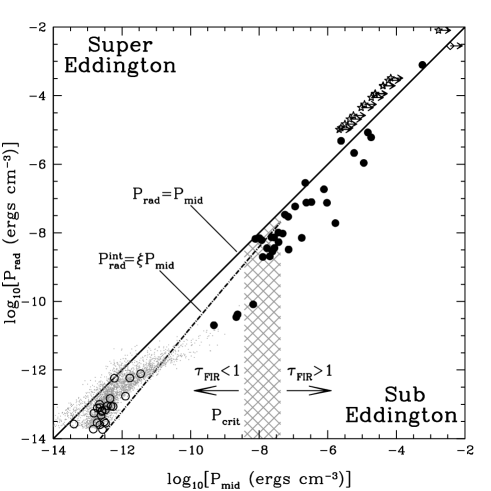
In the right panel of Figure 3, we plot the radiation pressure from UV and FIR photons versus the midplane pressure. These pressures will balance each other at Eddington (solid line):
| (15) |
where we take (Wong & Blitz 2002). The – plot shows that radiation pressure correlates strongly with midplane pressure over 10 orders of magnitude. The Eddington limit serves as a rough upper limit to , and most galaxies are within 2 dex of the Eddington limit. We note that some of the THINGS apertures and some dense starbursts reach or exceed the Eddington limit. For galaxies with , the critical midplane pressure (hatched region; see §2.2 & 4.2), we expect that the effects of intermittency are important; however, the intermittency adjusted Eddington limit (dot-dashed line) under-predicts for star-forming regions with . The intermittency factor may overestimate the importance of intermittency because of the simplifying assumption that subregions are “on” or “off” (see §2.2). We also see that galaxies and star-forming regions with tend to fall significantly below the Eddington limit, possibly because our simple parametrization of (see §4.5) is overestimating (and ) for these systems. Radiation pressure becomes increasingly more important in the optically thick limit () as some galaxies and star-forming regions meet and exceed Eddington. As expected from Figures 1 & 2, if we assume a larger dust-to-gas ratio and opacity () potentially appropriate for dusty galaxies, then more of the optically thick starbursts would be super-Eddington.
3.3. Radiation Pressure on Sub-galactic Scales
So far we have evaluated radiation pressure on a galaxy-wide scale; however, the distribution of gas and star formation in galaxies is inhomogeneous. Consequently, the Eddington ratio () will likely vary on sub-galactic scales. We use observations from the THINGS survey (Walter et al. 2008; Leroy et al. 2008; Bigiel et al. 2008) to calculate the Eddington ratio as a function of radius in azimuthally averaged radial bins and for semi-resolved (750 pc) apertures. Since the THINGS galaxies are generally in the single-scattering limit (see eq. 3), we conservatively adopt the radiation pressure to be (see eq. 15). For the midplane pressure given in eq. 15, the corresponding Eddington ratio is . Stars and atomic gas may not contribute significantly to the surface density in regions of active star formation, so we also calculate the Eddington ratio assuming that the midplane pressure depends only on the total gas surface density or the molecular gas surface density . Intermittency may be important because the THINGS observations cannot resolve individual star-forming regions. We calculate the Eddington ratio corrected for intermittency (, see eq. 8). In Figure 4, we plot (open circles), (solid triangles), and (open squares) as a function of radius for azimuthally averaged rings. We find that is similar to , so we omit for clarity.
At intermediate radii (), and generally increase from sub-Eddington () to approaching or exceeding the Eddington limit (). reaches a maximum Eddington ratio at –, where it falls off steeply. As the observations near the detection threshold, increases rapidly due to a small with large error bars (see, e.g., Figure 40 from Leroy et al. 2008), and thus the large value of at large is consistent with Eddington to within the errors on . For where , the intermittency factor can boost to the Eddington limit, suggesting that intermittency is important.
The regions in the inner parts of star-forming galaxies present a challenge for radiation pressure regulated star formation. Intermittency cannot account for the low Eddington ratios of these regions. However, a metallicity gradient, as seen in observations of star-forming galaxies (Muñoz-Mateos et al. 2009), increases the Eddington ratio at small radii (see §4.4). A metallicity gradient that rises at smaller radii correlates with a decreasing gradient in (Sodroski et al. 1995; Arimoto et al. 1996) and an increasing gradient in the dust-to-gas ratio (Muñoz-Mateos et al. 2009). We adopt the gradient given by eq. 10 of Arimoto et al. (1996) for data from the Milky Way, M31, and M51 (, where is the effective radius, which we assume to be 7 kpc and is the value of at the effective radius). To account for the dust-to-gas ratio gradient, we use a power law interpolation between at 0.1 kpc and at 10 kpc, motivated by Figure 15 of Muñoz-Mateos et al. (2009). In addition, collapsing GMCs enhance the surface density by a factor of (; see 2.2), making some regions optically thick to FIR radiation. In Figure 5, we show the molecular Eddington ratio as a function of radius for NGC 6946 since this galaxy is well below (2 dex) the Eddington limit at small radii (see Figure 4). After accounting for intermittency, an gradient, a dust-to-gas ratio gradient, and a surface density enhancement in the GMCs, we find that for almost all radii in NGC 6946. We find qualitatively similar results for all of the THINGS galaxies shown in Figure 4 assuming that the metallicity, , and dust-to-gas ratio gradients are similar to those adopted for NGC 6946. Thus, it is at least in principle possible to explain the nominally sub-Eddington inner regions of local star-forming galaxies using a combination of these effects.
In Figure 6, we plot the distributions of the individual Eddington ratios for the THINGS apertures (750 pc resolution): (dotted line), (dashed line), and (solid line). The distribution of is peaked around , and the majority of apertures are sub-Eddington for . The high tail of the distribution extends above the Eddington limit, with super-Eddington apertures comprising 5% of the total apertures and containing 5% of the total flux. Star-forming regions are unresolved on 750 pc scales, so should be adjusted to account for intermittency (). However, most apertures lie above the intermittency adjusted Eddington limit. As in Figures 1–5, this shift suggests that intermittency is important for radiation pressure supported star formation in normal spirals; however, appears to overestimate the importance of intermittency, possibly due to the simplifying assumption that subregions are either “on” or “off” (see §2.2 & 4.2). The distributions of and are similar, so we do not plot for clarity.
The distribution of is less peaked and shifted to systematically higher values than the distribution of with 10% of these apertures radiating at or above the Eddington limit. This is not surprising (given Figure 4) because radiation pressure will likely be more important in -dominated star-forming regions. The detection limit for is higher than that for H\@slowromancapi@, so the distribution of contains fewer apertures than . In addition, the apertures with detections tend to be within 0.4 (Bigiel et al. 2008), so they might have increased metallicities and dust-to-gas ratios with depressed values, which would increase the Eddington ratio (see Figure 5, §4.4 and 4.5). Super-Eddington apertures contain 6% of the total flux in -detected apertures across the whole sample; in NGC 6946, for example, super-Eddington apertures contain 10% of the total flux. The super-Eddington apertures indicate that radiation pressure can be dynamically dominant even when individual star-forming regions remain unresolved, suggesting that radiation pressure may be more important on the scale of GMCs and massive star clusters. Finally, we calculated assuming that UV photons contribute to the radiation pressure . The distribution of remains nearly the same because star-forming regions have , so we refrain from plotting it in Figure 6.
4. Discussion
We have compared globally-averaged and resolved observations of star-forming
galaxies with theoretical expectations based on the theory of radiation pressure
supported star formation (see §2). Although the uncertainties are large (see
below), our primary findings are as follows.
1. Figures 1–3 show that
star-forming galaxies meet, but do not dramatically exceed, nominal expectations
for the dust Eddington limit. When some subregions do seem to exceed the
Eddington limit (as in the outer regions of galaxies in Figure
4 & 5), we consider this to be
consistent with Eddington since trends in the dust-to-gas ratio and CO-to-H2
conversion factor, as well as the large-scale stellar potential and
intermittency of the star-formation process (; eq. 8) affect
the Eddington ratio at order unity.
2. The – plot (Figure
2) provides the strongest evidence for the importance of
radiation pressure feedback since is expected to directly
trace the dense actively star-forming gas and traces the total star
formation rate. If radiation pressure in fact dominates feedback, we would
expect a one-to-one correspondence between these two quantities, and such a
relation is observed (see also Scoville et al. 2001; Scoville 2003).
Nevertheless, for typical values of both in the optically thick limit
and the HCN-to-H2 conversion factor, the Eddington limit overpredicts by a factor of 3–6. This discrepancy may indicate that the
dust-to-gas ratio is larger in the dense HCN-emitting regions, or that the
HCN-to-H2 conversion factor is smaller (see §4.5 below). If
radiation pressure feedback regulates star formation, then this relation is in a
sense more fundamental than the Schmidt Law because HCN-emitting gas is more
closely connected with star formation than CO-emitting gas, in which case we
would expect .
3. The central regions of all galaxies in Figure 4
are prima facie substantially sub-Eddington when a constant dust-to-gas ratio
and CO-to-H2 conversion factor are applied to all sub-regions without regard to
their radial location. If radiation pressure is in fact the dominant feedback
mechanism in these regions, a much higher central dust-to-gas ratio and a lower
CO-to-H2 conversion factor are required (see Figures 4 &
5). It would be particularly useful for testing
radiation pressure feedback to produce the same profiles in HCN.
4. The “break” in the observed Schmidt Law at – M⊙ pc-2 (see Figure 3;
Daddi et al. 2010b) may be due to the transition from the single-scattering
limit to the optically thick limit in the GMCs that collapse to form stars, as
in MQT.
5. If radiation pressure is the primary feedback mechanism for
regulating star formation, then we predict that the Schmidt Law will follow the
form of eq. 14 (for discussion of and as well
as uncertainties see §2 &
4.2–4.5).
6. A testable prediction of radiation pressure feedback is that all
else being equal the star formation rate should depend linearly on the
dust-to-gas ratio in the optically thick limit.
In addition to these points, below we note an implication of radiation pressure feedback that has so far not been stated in the literature (§4.1). Finally, in the remaining subsections we highlight the dominant uncertainties in our work as a guide for future research on the importance of radiation pressure feedback in star-forming galaxies.
4.1. Gas Depletion Timescale
The gas depletion timescale, the time required to consume a galaxy’s gas reservoir at the current SFR, is observed to be 2 Gyr in normal spirals (Kennicutt 1998; Leroy et al. 2008). Radiation pressure sets the gas depletion timescale to be
| (16) |
Using typical numbers for a spiral galaxy in the single-scattering limit, the gas depletion timescale is
| (17) |
where and . This normalization of is in good agreement with the observed gas depletion timescale, but eq. 17 predicts that the gas depletion timescale should have a strong dependence on , in contrast to the observations of Leroy et al. (2008) (see their Figure 15). For completeness, we note that variations in the dust-to-gas ratio will not affect the dependence of on in the single-scattering limit, but uncertainties in , , and (see §4.4–4.5) might impact the gas depletion timescale.
Hot starbursts and optically thick subregions (see §2.1.2) have intermittency factors that approach unity and nearly constant opacities, so the gas depletion time is approximately constant,
| (18) |
where . For comparison, Sakamoto et al. (2008) find that the optically thick western nucleus of Arp 220 has a gas depletion time of 6 Myr. The fact that the gas depletion timescale set by radiation pressure is consistent with the observed gas depletion timescale in spirals and ULIRGs is equivalent to the statement of Figures 1–5 that starbursts approach the dust Eddington limit. In addition, we point out that radiation pressure feedback predicts that the specific SFR (SSFR) will be for small .
4.2. Intermittency
The intermittency factor (see §2.2; MQT) relates the properties of radiation pressure dominated star-forming subregions to the global properties of a galaxy. However, may overestimate the effect of intermittency in some galaxies (see Figures 3, 4, & 6). We expect the determination of to be complicated by uncertainty in the timescale for the central cluster of a sub-unit to be bright (). We adopt as the time a cluster will be bright, since the cluster luminosity drops rapidly after the most massive stars in the cluster explode as supernovae. However, a cluster will continue to emit after . Indeed, models of cluster luminosity indicate that a similar amount of momentum will transferred to the gas during the time and during the time , where the cluster luminosity has dropped by 1 dex after 4 (Leitherer et al. 1999). Further uncertainty in is due to ambiguities in calculating the lifetime of a sub-unit (2), especially the disk dynamical time (see eq. 9). The dynamical time likely varies with galactocentric radius because is a strong function of radius (Leroy et al. 2008). Thus, trying to determine an effective applicable to a galaxy as a whole may be difficult if changes locally. Overall, we expect the uncertainty in to be a factor of a few to several.
4.3. The FIR Optical Depth
A key theoretical uncertainty in calculating the Eddington limit for dense starbursts is the effective optical depth () for surface densities where . In order for radiation pressure to be dynamically important in optically thick GMCs, must exceed unity. Based on the high Mach number turbulence simulations of Ostriker et al. (2001), MQT conclude that if the ISM is optically thick on average, then the vast majority of sight lines will be optically thick. For comparison, KM09 argue that instabilities, such as Rayleigh-Taylor and photon-bubble instabilities, will reduce the effective optical depth of the dense ISM to 1. However, MQT note that both the midplane pressure from gravity and optically thick radiation pressure scale as , a feature unique to radiation pressure among stellar feedback processes. Thus, if radiation pressure cannot regulate star formation in dense, optically thick gas, then no known stellar feedback process can.
4.4. Dust-to-Gas Ratio and Metallicity
The coupling between radiation and gas directly depends on the dust-to-gas ratio (). In this analysis, we assume the Galactic value for the dust-to-gas ratio () and solar metallicity; however, there is strong evidence that and metallicity change with environment. The dust-to-gas ratio has been shown to correlate with metallicity and radius (Issa et al. 1990; Lisenfeld & Ferrara 1998; Draine et al. 2007; Muñoz-Mateos et al. 2009). Muñoz-Mateos et al. (2009) find that the dust-to-gas ratio can climb to values as high as in the centers of spiral galaxies. This increase in metallicity and dust-to-gas ratio is necessary for the centers of star-forming spirals to be at Eddington (see Figures 4 & 5 and §3.3). The average dust-to-gas ratio of local spirals also varies by a factor of a few (e.g., M51 has a ; Draine et al. 2007). Furthermore, the dust-to-gas ratio is observed to be higher in some dense starbursts, such as SMGs (; Kovács et al. 2006; Michałowski et al. 2010) and sub-mm faint ULIRGs (; Casey et al. 2009). Importantly, if we adopt a dust-to-gas ratio potentially appropriate for dusty starbursts (short dashed line in Figure 1, 2, and the left panel of Figure 3), then a substantial fraction of optically thick galaxies would be at or above the Eddington limit (Figure 5 illustrates this for NGC 6946).
4.5. Molecular Gas Tracers
The Eddington limit depends strongly on the CO-to-H2 () and the HCN-to-H2 () conversion factors (see eqs. 11 & 12). These conversion factors are two of the largest sources of observational uncertainty in our calculations because they vary with excitation conditions (, where is the brightness temperature) and metallicity. Several lines of evidence suggest that overestimates in starburst galaxies. For example, is a factor of 3 lower in M82 (Weiss et al. 2001) and a factor of 5 lower in a sample of local ULIRGs (Downes & Solomon 1998). To account for the different values of in normal spirals and extreme starbursts, we apply the Milky Way value to galaxies with and the ULIRG value to galaxies with . Because this prescription is somewhat simplistic, it probably overestimates in moderate luminosity starbursts (), such as M82, and in the centers of star-forming spirals (see Figures 4 & 5 and §3.3). Additionally, it likely underestimates in ultra-luminous () high redshift disk (BzK) galaxies, for which Daddi et al. (2010a) find a value of that is consistent with the Galactic value. As a result, moderate luminosity starbursts and the centers of star-forming spirals may be closer to Eddington and BzK galaxies might be further below the optically thick Eddington limit than Figure 3 would suggest.
Unfortunately, is more uncertain than because there is no direct calibration of from Milky Way GMCs. For normal spirals, Gao & Solomon (2004a,b) find for virialized cloud cores with and . They caution that could be lower in regions of massive star formation due to significantly higher brightness temperatures (Boonman et al. 2001). Ultra-luminous starbursts exhibit widespread intense massive star formation, so one might expect that is lower in more luminous galaxies. For example, Graciá-Carpio et al. (2008) estimate that should be 4.5 times lower for galaxies at than at . We note that if is smaller than the assumed value of , then more galaxies will approach or exceed the Eddington limit (see Figure 2). For example, decreasing by a factor of brings essentially all galaxies in line with the Eddington limit for the nominal value of (5–10).
References
- Aravena et al. (2008) Aravena, M., et al. 2008, A&A, 491, 173
- Arimoto et al. (1996) Arimoto, N., Sofue, Y., & Tsujimoto, T. 1996, PASJ, 48, 275
- Becklin et al. (1980) Becklin, E. E., Gatley, I., Matthews, K., Neugebauer, G., Sellgren, K., Werner, M. W., & Wynn-Williams, C. G. 1980, ApJ, 236, 441
- Beelen et al. (2006) Beelen, A., Cox, P., Benford, D. J., Dowell, C. D., Kovács, A., Bertoldi, F., Omont, A., & Carilli, C. L. 2006, ApJ, 642, 694
- Bell & Lin (1994) Bell, K. R., & Lin, D. N. C. 1994, ApJ, 427, 987
- Benford et al. (1999) Benford, D. J., Cox, P., Omont, A., Phillips, T. G., & McMahon, R. G. 1999, ApJ, 518, L65
- Bigiel et al. (2008) Bigiel, F., Leroy, A., Walter, F., Brinks, E., de Blok, W. J. G., Madore, B., & Thornley, M. D. 2008, AJ, 136, 2846
- Blitz et al. (2007) Blitz, L., Fukui, Y., Kawamura, A., Leroy, A., Mizuno, N., & Rosolowsky, E. 2007, Protostars and Planets V, 81
- Bolatto et al. (2008) Bolatto, A. D., Leroy, A. K., Rosolowsky, E., Walter, F., & Blitz, L. 2008, ApJ, 686, 948
- Boonman et al. (2001) Boonman, A. M. S., Stark, R., van der Tak, F. F. S., van Dishoeck, E. F., van der Wal, P. B., Schäfer, F., de Lange, G., & Laauwen, W. M. 2001, ApJ, 553, L63
- Calzetti et al. (2010) Calzetti, D., et al. 2010, ApJ, 714, 1256
- Capak et al. (2008) Capak, P., et al. 2008, ApJ, 681, L53
- Carilli et al. (2005) Carilli, C. L., et al. 2005, ApJ, 618, 586
- Casey et al. (2009) Casey, C. M., et al. 2009, arXiv:0910.5756
- Casoli et al. (1989) Casoli, F., Combes, F., Augarde, R., Figon, P., & Martin, J. M. 1989, A&A, 224, 31
- Chapman et al. (2005) Chapman, S. C., Blain, A. W., Smail, I., & Ivison, R. J. 2005, ApJ, 622, 772
- Chevalier & Fransson (1984) Chevalier, R. A., & Fransson, C. 1984, ApJ, 279, L43
- Chung et al. (2009) Chung, A., Narayanan, G., Yun, M. S., Heyer, M., & Erickson, N. R. 2009, AJ, 138, 858
- Combes et al. (2010) Combes, F., Garcia-Burillo, S., Braine, J., Schinnerer, E., Walter, F., & Colina, L. 2010, arXiv:1009.2040
- Coppin et al. (2009) Coppin, K. E. K., et al. 2009, MNRAS, 395, 1905
- Coppin et al. (2010) Coppin, K. E. K., et al. 2010, MNRAS, 407, L103
- Cunningham (2008) Cunningham, A. J. 2008, Ph.D. Thesis,
- Daddi et al. (2007) Daddi, E., et al. 2007, ApJ, 670, 156
- Daddi et al. (2009) Daddi, E., et al. 2009, ApJ, 694, 1517
- Daddi et al. (2010) Daddi, E., et al. 2010a, ApJ, 713, 686
- Daddi et al. (2010) Daddi, E., et al. 2010b, ApJ, 714, L118
- Dame et al. (2001) Dame, T. M., Hartmann, D., & Thaddeus, P. 2001, ApJ, 547, 792
- Dickman et al. (1986) Dickman, R. L., Snell, R. L., & Schloerb, F. P. 1986, ApJ, 309, 326
- Downes & Eckart (2007) Downes, D., & Eckart, A. 2007, A&A, 468, L57
- Downes & Solomon (1998) Downes, D., & Solomon, P. M. 1998, ApJ, 507, 615
- Draine (2010) Draine, B. T. 2010, arXiv:1003.0474
- Draine et al. (2007) Draine, B. T., et al. 2007, ApJ, 663, 866
- Elmegreen (1989) Elmegreen, B. G. 1989, ApJ, 338, 178
- Ferrara (1993) Ferrara, A. 1993, ApJ, 407, 157
- Gao et al. (2007) Gao, Y., Carilli, C. L., Solomon, P. M., & Vanden Bout, P. A. 2007, ApJ, 660, L93
- Gao & Solomon (1999) Gao, Y., & Solomon, P. M. 1999, ApJ, 512, L99
- Gao & Solomon (2004a) Gao, Y., & Solomon, P. M. 2004a, ApJS, 152, 63
- Gao & Solomon (2004b) Gao, Y., & Solomon, P. M. 2004b, ApJ, 606, 271
- Genzel et al. (2003) Genzel, R., Baker, A. J., Tacconi, L. J., Lutz, D., Cox, P., Guilloteau, S., & Omont, A. 2003, ApJ, 584, 633
- Graciá-Carpio et al. (2008) Graciá-Carpio, J., García-Burillo, S., Planesas, P., Fuente, A., & Usero, A. 2008, A&A, 479, 703
- Greve et al. (2005) Greve, T. R., et al. 2005, MNRAS, 359, 1165
- Greve et al. (2006) Greve, T. R., Hainline, L. J., Blain, A. W., Smail, I., Ivison, R. J., & Papadopoulos, P. P. 2006, AJ, 132, 1938
- Handa et al. (1990) Handa, T., Nakai, N., Sofue, Y., Hayashi, M., & Fujimoto, M. 1990, PASJ, 42, 1
- Helfer et al. (2003) Helfer, T. T., Thornley, M. D., Regan, M. W., Wong, T., Sheth, K., Vogel, S. N., Blitz, L., & Bock, D. C.-J. 2003, ApJS, 145, 259
- Heyer et al. (2009) Heyer, M., Krawczyk, C., Duval, J., & Jackson, J. M. 2009, ApJ, 699, 1092
- Hopkins et al. (2010) Hopkins, P. F., Murray, N., Quataert, E., & Thompson, T. A. 2010, MNRAS, 401, L19
- Isaak et al. (2004) Isaak, K. G., Chandler, C. J., & Carilli, C. L. 2004, MNRAS, 348, 1035
- Issa et al. (1990) Issa, M. R., MacLaren, I., & Wolfendale, A. W. 1990, A&A, 236, 237
- Kennicutt (1998) Kennicutt, R. C., Jr. 1998, ApJ, 498, 541
- Kennicutt et al. (2007) Kennicutt, R. C., Jr., et al. 2007, ApJ, 671, 333
- Kennicutt et al. (2009) Kennicutt, R. C., et al. 2009, ApJ, 703, 1672
- Kim (2002) Kim, W.-T. 2002, Ph.D. Thesis,
- Kim & Sanders (1998) Kim, D.-C., & Sanders, D. B. 1998, ApJS, 119, 41
- Knudsen et al. (2007) Knudsen, K. K., Walter, F., Weiss, A., Bolatto, A., Riechers, D. A., & Menten, K. 2007, ApJ, 666, 156
- Kovács et al. (2006) Kovács, A., Chapman, S. C., Dowell, C. D., Blain, A. W., Ivison, R. J., Smail, I., & Phillips, T. G. 2006, ApJ, 650, 592
- Kroupa (2001) Kroupa, P. 2001, MNRAS, 322, 231
- Krumholz et al. (2009) Krumholz, M. R., McKee, C. F., & Tumlinson, J. 2009, ApJ, 699, 850
- Krumholz & Matzner (2009) Krumholz, M. R., & Matzner, C. D. 2009, ApJ, 703, 1352
- Krumholz & McKee (2005) Krumholz, M. R., & McKee, C. F. 2005, ApJ, 630, 250
- Krumholz & Tan (2007) Krumholz, M. R., & Tan, J. C. 2007, ApJ, 654, 304
- Krumholz & Thompson (2007) Krumholz, M. R., & Thompson, T. A. 2007, ApJ, 669, 289
- Laor & Draine (1993) Laor, A., & Draine, B. T. 1993, ApJ, 402, 441
- Leitherer et al. (1999) Leitherer, C., et al. 1999, ApJS, 123, 3
- Leroy et al. (2008) Leroy, A. K., Walter, F., Brinks, E., Bigiel, F., de Blok, W. J. G., Madore, B., & Thornley, M. D. 2008, AJ, 136, 2782
- Levin (2007) Levin, Y. 2007, MNRAS, 374, 515
- Lisenfeld & Ferrara (1998) Lisenfeld, U., & Ferrara, A. 1998, ApJ, 496, 145
- Martin et al. (2005) Martin, D. C., et al. 2005, ApJ, 619, L59
- Matzner (2002) Matzner, C. D. 2002, ApJ, 566, 302
- Mauersberger et al. (1996) Mauersberger, R., Henkel, C., Wielebinski, R., Wiklind, T., & Reuter, H.-P. 1996, A&A, 305, 421
- McCrady et al. (2003) McCrady, N., Gilbert, A. M., & Graham, J. R. 2003, ApJ, 596, 240
- McCrady & Graham (2007) McCrady, N., & Graham, J. R. 2007, ApJ, 663, 844
- McKee & Ostriker (1977) McKee, C. F., & Ostriker, J. P. 1977, ApJ, 218, 148
- Michałowski et al. (2010) Michałowski, M. J., Watson, D., & Hjorth, J. 2010, ApJ, 712, 942
- Mirabel et al. (1990) Mirabel, I. F., Booth, R. S., Johansson, L. E. B., Garay, G., & Sanders, D. B. 1990, A&A, 236, 327
- Momjian et al. (2007) Momjian, E., Carilli, C. L., Riechers, D. A., & Walter, F. 2007, AJ, 134, 694
- Muñoz-Mateos et al. (2009) Muñoz-Mateos, J. C., et al. 2009, ApJ, 701, 1965
- Murphy et al. (2001) Murphy, T. W., Jr., Soifer, B. T., Matthews, K., Armus, L., & Kiger, J. R. 2001, AJ, 121, 97
- Murray (2010) Murray, N. 2010, arXiv:1007.3270
- Murray et al. (2005) Murray, N., Quataert, E., & Thompson, T. A. 2005, ApJ, 618, 569
- Murray et al. (2010) Murray, N., Quataert, E., & Thompson, T. A. 2010, ApJ, 709, 191
- Murray & Rahman (2010) Murray, N., & Rahman, M. 2010, ApJ, 709, 424
- Narayanan et al. (2008) Narayanan, D., Cox, T. J., Shirley, Y., Davé, R., Hernquist, L., & Walker, C. K. 2008, ApJ, 684, 996
- Neri et al. (2003) Neri, R., et al. 2003, ApJ, 597, L113
- O’dell et al. (1967) O’dell, C. R., York, D. G., & Henize, K. G. 1967, ApJ, 150, 835
- Ostriker et al. (2001) Ostriker, E. C., Stone, J. M., & Gammie, C. F. 2001, ApJ, 546, 980
- Paumard et al. (2006) Paumard, T., et al. 2006, ApJ, 643, 1011
- Rahman & Murray (2010) Rahman, M., & Murray, N. 2010, ApJ, 719, 1104
- Riechers et al. (2006) Riechers, D. A., et al. 2006, ApJ, 650, 604
- Riechers et al. (2007) Riechers, D. A., Walter, F., Carilli, C. L., & Bertoldi, F. 2007, ApJ, 671, L13
- Riechers et al. (2008) Riechers, D. A., Walter, F., Carilli, C. L., Bertoldi, F., & Momjian, E. 2008, ApJ, 686, L9
- Riechers et al. (2009) Riechers, D. A., et al. 2009b, ApJ, 703, 1338
- Sajina et al. (2008) Sajina, A., et al. 2008, ApJ, 683, 659
- Sakamoto et al. (2008) Sakamoto, K., et al. 2008, ApJ, 684, 95 7
- Sanders et al. (1991) Sanders, D. B., Scoville, N. Z., & Soifer, B. T. 1991, ApJ, 370, 158
- Schinnerer et al. (2006) Schinnerer, E., Böker, T., Emsellem, E., & Lisenfeld, U. 2006, ApJ, 649, 181
- Schinnerer et al. (2007) Schinnerer, E., Böker, T., Emsellem, E., & Downes, D. 2007, A&A, 462, L27
- Schinnerer et al. (2008) Schinnerer, E., et al. 2008, ApJ, 689, L5
- Scoville (2003) Scoville, N. 2003, Journal of Korean Astronomical Society, 36, 167
- Scoville et al. (2001) Scoville, N. Z., Polletta, M., Ewald, S., Stolovy, S. R., Thompson, R., & Rieke, M. 2001, AJ, 122, 3017
- Sellwood & Balbus (1999) Sellwood, J. A., & Balbus, S. A. 1999, ApJ, 511, 660
- Semenov et al. (2003) Semenov, D., Henning, T., Helling, C., Ilgner, M., & Sedlmayr, E. 2003, A&A, 410, 611
- Sirko & Goodman (2003) Sirko, E., & Goodman, J. 2003, MNRAS, 341, 501
- Smith & Harvey (1996) Smith, B. J., & Harvey, P. M. 1996, ApJ, 468, 139
- Socrates et al. (2008) Socrates, A., Davis, S. W., & Ramirez-Ruiz, E. 2008, ApJ, 687, 202
- Sodroski et al. (1995) Sodroski, T. J., et al. 1995, ApJ, 452, 262
- Solomon et al. (1987) Solomon, P. M., Rivolo, A. R., Barrett, J., & Yahil, A. 1987, ApJ, 319, 730
- Solomon et al. (1997) Solomon, P. M., Downes, D., Radford, S. J. E., & Barrett, J. W. 1997, ApJ, 478, 144
- Solomon & Vanden Bout (2005) Solomon, P. M., & Vanden Bout, P. A. 2005, ARA&A, 43, 677
- Strong & Mattox (1996) Strong, A. W., & Mattox, J. R. 1996, A&A, 308, L21
- Tacconi et al. (2006) Tacconi, L. J., et al. 2006, ApJ, 640, 228
- Thompson (2009) Thompson, T. A. 2009, Astronomical Society of the Pacific Conference Series, 408, 128
- Thompson et al. (2005) Thompson, T. A., Quataert, E., & Murray, N. 2005, ApJ, 630, 167
- Walter et al. (2003) Walter, F., et al. 2003, Nature, 424, 406
- Walter et al. (2008) Walter, F., Brinks, E., de Blok, W. J. G., Bigiel, F., Kennicutt, R. C., Thornley, M. D., & Leroy, A. 2008, AJ, 136, 2563
- Walter et al. (2009) Walter, F., Riechers, D., Cox, P., Neri, R., Carilli, C., Bertoldi, F., Weiss, A., & Maiolino, R. 2009, Nature, 457, 699
- Weingartner & Draine (2001) Weingartner, J. C., & Draine, B. T. 2001, ApJ, 553, 581
- Weiß et al. (2001) Weiß, A., Neininger, N., Hüttemeister, S., & Klein, U. 2001, A&A, 365, 571
- Wong & Blitz (2002) Wong, T., & Blitz, L. 2002, ApJ, 569, 157
- Wu et al. (2005) Wu, J., Evans, N. J., II, Gao, Y., Solomon, P. M., Shirley, Y. L., & Vanden Bout, P. A. 2005, ApJ, 635, L173
- Yan et al. (2010) Yan, L., et al. 2010, ApJ, 714, 100
- Young & Scoville (1982) Young, J. S., & Scoville, N. 1982, ApJ, 258, 467
- Yun & Hibbard (2001) Yun, M. S., & Hibbard, J. E. 2001, ApJ, 550, 104