Incremental response of granular materials: DEM results
Abstract
We systematically investigate the incremental response of various equilibrium states of dense 2D model granular materials, along the biaxial compression path (, ). Stress increments are applied in arbitrary directions in 3-dimensional stress space . In states with stable contact networks we compute the stiffness matrix and the elastic moduli, and separate elastic and irreversible strains in the range in which the latter are homogeneous functions of degree one of stress increments. Without principal stress axis rotation, the response abides by elastoplasticity with a Mohr-Coulomb criterion and a non-associated flow rule. However a nonelastic shear strain is also observed for increments of , and shear and in-plane responses couple. This behavior correlates to the distribution of friction mobilization and sliding at contacts.
Keywords:
discrete element simulation; incremental behavior; elastoplasticity; flow rule; hardening:
81.05.Rm ; 81.40.Jj ; 62.20.F- ; 83.80.Fg1 Introduction
Although the mechanical behavior of solidlike granular materials under quasistatic loading conditions is often modeled as elastoplastic at the continuum level Vermeer (1998); Mitchell (1993), there are still few studies addressing the microscopic origins of such a behavior by discrete, grain-level simulation Alonso-Marroquín et al. (2005); Tamagnini et al. (2005); Darve et al. (2007); Radjaï (2008). To assess the applicability of elastoplastic laws, one needs to investigate the response to small stress or strain increments, superimposed in various directions on an equilibrium state. One essential motivation for such studies is the prediction of shear band formation, for which such criteria as the Rudnicki-Rice Vardoulakis and Sulem (1995) condition involve the incremental response. In particular, localization is crucially sensitive to the response to stress increments with rotation of principal axes, as when some simple shear is superimposed on a biaxial compression Desrues and Chambon (2002). The present study addresses this issue for the simplest model material, an assembly of disks in 2 dimensions, for which the response to load increments in all 3 dimensions of stress space is computed at various points along a biaxial loading path.
2 Model material and methods
Our simulation samples comprise 5600 disks enclosed in a periodic rectangular cell. The diameter distribution is uniform between and . We use a simple, frictional-elastic contact model, involving (constant) normal contact stiffness , tangential contact stiffness (here we set ) and a friction coefficient, , set to . The normal (elastic) contact force is where is the interpenetration of contacting disks (which models surface deflection). The tangential force relates to the elastic part of the tangential relative displacement, as , and is incrementally computed to enforce the Coulomb condition . Some viscous damping is also introduced, which proves irrelevant to the material behavior for low enough strain rates.
We focus here on dense samples, which are initially assembled without friction, under an isotropic pressure . The initial state is thus characterized by an isotropic fabric and a large coordination number (close to 4). The dimensionless stiffness parameter sets the scale of contact deflections, as . We choose value in most simulations.
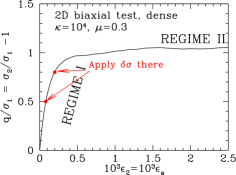
Deformations of the simulation cell, i.e. macroscopic strains, are controlled, or vary in response to applied stresses. This is achieved with specific implementations of Parrinello-Rahman and Lees-Edwards techniques (first developed for molecular systems Allen and Tildesley (1987)), as explained in Ref. Peyneau and Roux (2008). Stresses are given by the classical Love formula. In the biaxial compression test, the deformable cell remains rectangular, its edges parallel to the principal stress directions. Principal stress value (the lateral stress) is kept equal to , while (the axial stress) increases in response to strain , which grows at a controlled rate (compressive stresses and shrinking strains are positive). As indicated in Fig. 1, the compression test is stopped at different stages and the sample is equilibrated at constant stresses. This entails slight creep strain increments, which remain quite small (of order ), until equilibrium conditions are satisfied with good accuracy (the tolerance is in units of , , and for stresses, forces and moments, respectively). In those well-equilibrated intermediate states, hereafter referred to as investigation points, we first compute elastic moduli. To do so, we use the stiffness matrix associated to the contact network, as in Ref. Agnolin and Roux (2007). It is convenient to denote stresses and strains as 3-vectors (as , ) with , while notations , keep the same meaning (and similarly for ). Due to symmetry about the principal axes there are four independent elastic moduli, which satisfy:
| (1) |
superscripts recalling that strains are purely elastic. The incremental response for various load directions is then computed, for different stress increments. We choose values on a sphere in 3-space, centered at the origin, of radius . Such increments are applied, and then multiplied by integer factors 2, 3… up to 12, in order to record the influence of both their direction and their amplitude. The calculations are fully stress-controlled, with variations of all 3 strain components. Once a new, pertubed equilibrium is reached, is measured, from which the elastic part is subtracted, defining the irreversible strain increment, which we denote with superscript (for “plastic”). Investigation points with 1.2, 1.4, 1.6 and 1.8 were studied
Before presenting the results in the next section, let us recall that as a consequence of the assembling process, the investigated states possess a large coordination number, and (see Fig. 1) are within the range of strain (“regime I”), along the biaxial loading curve, that is dominated by contact deformation Roux (2005); Agnolin and Roux (2007). This means that the contact network does not break apart, and that the irreversible strains are due to sliding at contacts where the Coulomb limit is reached. As a consequence, macroscopic strains, on changing confining stresses or stiffness constants, scale as Roux (2005). For larger deviators, or in poorly coordinated samples (which might be very dense nevertheless Agnolin and Roux (2007)), the macroscopic strains stem from network ruptures and rearrangements (“regime II”) and the incremental behavior might differ.
3 Incremental response
3.1 No rotation of principal axes
We first investigate the response to stress increments lying in the plane of principal stresses (i.e., ). For each investigation point along the curve of Fig. 1, 12 different orientations of in this plane are tested, as shown in Fig. 2, with 12 different amplitudes (as specified before). In order to assess the relevance of classical plasticity models for the material studied here we focus on the following three aspects: (i) the existence of a flow rule dictating the direction of ; (ii) at equal amplitude , the linear dependence of amplitude on the positive part of , where is the outer normal to some yield criterion in stress space; (iii) the same linear dependence for varying stress increment amplitudes.
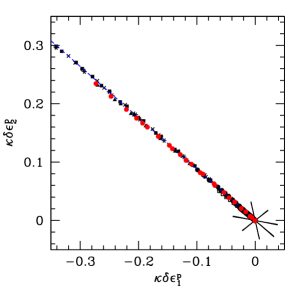
The existence of a plastic flow rule is a sharp feature arising from incremental tests, as shown in Fig. 3, corresponding to an investigation point with . Elastic strain increments and are disposed along as many directions as the stress increments in Fig. 2, while plastic strain increments ( and ) clearly align along a unique direction, consistently with the flow rule. The same features are observed for all investigation points.
.
We discuss point (ii) of our list by referring to Fig. 4 in which is plotted versus the angle between principal axis 1 and increment , at constant amplitude . In the framework of classical plasticity these values should fit to the positive part of a cosine function reaching its maximum in tnormal to the yield criterion. Fitting theoretical curves to data allows to estimate the angle characterising the normal to the yield criterion Tamagnini et al. (2005) and the maximal amplitude of the plastic strain increment.
Notably, for all investigation points, the normal , oriented at angle , is consistently very nearly orthogonal to the current stress direction (oriented at angle in stress space). This suggests that the yield criterion might be defined by the Coulomb condition of a constant ratio . Since the plastic flow direction differs from the normal , as in nonassociated elastoplasticity.
As to point (iii), it is checked in Fig. 5, from which the following plastic moduli (in units of ) are measured: , ??, ??, ?? corresponding, respectively, to 1.2, 1.4, 1.6 and 1.8.
3.2 General case
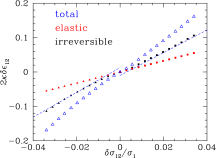
If elastoplasticity applies – which seems to be the case for in the plane of the principal stress directions – then a small load increment in the third direction, , should entail a purely elastic response. Fig. 6 contradicts this prediction, as a nonelastic shear strain immediately appears, which increase proportionnally to shear stress . Coefficients can be slightly different for positive and negative because of finite sample size effects. Like in-plane increments, such , if extremely small, yield a nonelastic response that is slightly sublinear in their amplitude, but a plastic modulus can be identified for of order .
Out-of-plane increments also entail plastic strains , , which are still related by the same flow rule as previously identified for in-plane loads (). Fig. 7 gathers results both from 16 load directions for which , as well as simple shear increments () with both signs of .
Quite surprisingly, the latter also produce a nonelastic reponse in the plane of principal stresses. We thus observe that both the irreversible strains and the stress increments causing them span two-dimensional spaces, with one in-plane and one out-of-plane direction, and that the response couples both directions. To be complete, we should then specify how depends on for all load increments. Although we are still investigating this issue, some preliminary attempts at superposition of responses to shear and to in-plane stress increments are encouraging, as shown by Fig. 8.
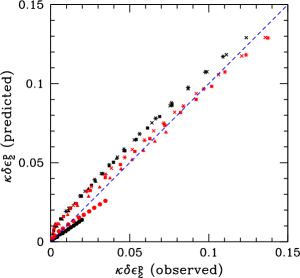
Upon superimposing the previously identified responses to (in-plane) and to in simple shear, Fig. 8 shows that the predicted values are fairly close to the measured ones.
4 Microscopic aspects
The macroscopic nonelastic is due to plastic sliding in some contacts. While the distribution of contact orientations (fabric) is still moderately anisotropic in the investigated states, the sliding contact fabric (Fig. 9) has a much stronger angular dependence.


Such a distribution is observed for , while the population of sliding contacts virtually vanishes on applying and . The sliding contact fabric depends on both and in general. A nonzero breaks its symmetry. The angular distribution of sliding displacements at contacts (Fig. 9), albeit different, is also strongly anisotropic and shows similar sensitivity to the direction of . Finally, stress increments for which is proportional to (the neutral direction), entail no sliding, as contact forces tend to increase proportionnally to their previous value.
5 Perspectives
The essential finding of the present study, which still remains to be systematized and calls for more thorough micromechanical investigations, is the correspondence between 2D stress increments orthogonal to the currrent stress level and nonelastic strains belonging to a 2D space. In the near future we plan to formulate it as a complete constitutive incremental law, to relate it to microscopic phenomena and to use it in localization criteria. The incremental response in systems with gradually rearranging contact networks (“regime II”, associated with microscopic instabilities) should also be investigated.
References
- Vermeer (1998) P. A. Vermeer, in Physics of Dry Granular Media, edited by H. J. Herrmann, J.-P. Hovi, and S. Luding, Balkema, Dordrecht, 1998, pp. 163–196.
- Mitchell (1993) J. K. Mitchell, Fundamentals of soil behavior, Wiley, New York, 1993.
- Alonso-Marroquín et al. (2005) F. Alonso-Marroquín, S. Luding, H. J. Herrmann, and I. Vardoulakis, Phys. Rev. E 71, 051304 (2005).
- Tamagnini et al. (2005) C. Tamagnini, F. Calvetti, and G. Viggiani, J. Eng. Math. 52, 265–291 (2005).
- Darve et al. (2007) F. Darve, L. Sibille, A. Daouadji, and F. Nicot, C. R. Mécanique 335, 496–515 (2007).
- Radjaï (2008) F. Radjaï, ArXiv e-prints (2008), 0801.4722.
- Vardoulakis and Sulem (1995) I. Vardoulakis, and J. Sulem, Bifurcation Analysis in Geomechanics, Blackie Academic and Professional, 1995.
- Desrues and Chambon (2002) J. Desrues, and R. Chambon, Int. J. Solid Struct. 39, 3757–3776 (2002).
- Allen and Tildesley (1987) M. Allen, and D. Tildesley, Computer simulations of liquids, Oxford University Press, Oxford, 1987.
- Peyneau and Roux (2008) P.-E. Peyneau, and J.-N. Roux, Phys. Rev. E 78, 011307 (2008).
- Agnolin and Roux (2007) I. Agnolin, and J.-N. Roux, Phys. Rev. E 76, 061304 (2007).
- Roux (2005) J.-N. Roux, in Powders and Grains 2005, edited by R. García Rojo, H. J. Herrmann, and S. McNamara, Balkema, Leiden, 2005, pp. 261–265.