The evolution of dwarf galaxies in the Coma supercluster
Abstract
We employ spectroscopic and photometric data from SDSS DR7, in a square degree region, to understand the evolution of dwarf () galaxies in the Coma supercluster (). We show that in the Coma supercluster, the red dwarf galaxies are mostly concentrated in the dense cores of the Coma and Abell 1367 clusters, and in the galaxy groups embedded in the filament connecting them. The post-starburst (k+A) dwarfs however are found in the infall regions of the Coma and Abell 1367 clusters, and occasionally in galaxy groups embedded along the filament, suggesting that strong velocity fields prevalent in the vicinity of deep potential wells may be closely related to the mechanism(s) leading to the post-starburst phase in dwarf galaxies. Moreover, the blue colour of some k+A dwarfs in the Coma cluster, found within its virial radius, suggests that the star formation in these galaxies was quenched very rapidly in the last Myr. More than 60% of all red dwarf galaxies in the supercluster have 0–3Å of Hδ in absorption, which suggests that a major episode of star formation occurred in a non-negligible fraction of these galaxies, ending within the last Gyr, allowing them to move to the red sequence. The distribution of the blue dwarf galaxies in the Coma supercluster is bimodal in the EW(Hα)–EW(Hδ) plane, with one population having very high emission in Hα, and some emission in Hδ. A sub-population of blue dwarfs is coincident with the red dwarfs in the EW(Hα)–EW(Hδ) plane, showing absorption in Hδ and relatively lower emission in Hα. We suggest that a large fraction of the latter population are the progenitors of the passive dwarf galaxies that are abundantly found in the cores of low-redshift rich clusters such as Coma.
keywords:
galaxies: clusters: general, galaxies: clusters: individual: Coma, galaxies: dwarf, galaxies: evolution1 Introduction
In hierarchical models of structure formation, dwarf galaxies are the ‘building blocks’ of the more massive galaxies. Moreover, the vulnerable nature of these galaxies, which are most abundant in the Universe, makes them an excellent probe for exploring the impact of the environment on evolution of galaxies. A reliable census of dwarfs, and detailed knowledge of their properties is required, over a wide range of epochs, to understand the coeval evolution of the large-scale structure and the galaxies therein.
However, unlike their giant counterparts, dwarfs have received little attention in the literature, possibly due to the challenges encountered in observing these faint and low surface brightness galaxies. Nevertheless, studies conducted in the last decade or so have been able to exploit the multiplex gain of wide-field multi-fibre spectrographs (e.g. Poggianti et al., 2001), while others have targeted the low-luminosity (e.g. Lisker et al., 2007; Smith et al., 2008, and references therein) and low surface brightness (e.g. Chiboucas et al., 2010) galaxy population in nearby clusters (e.g. Lisker et al., 2007; Smith et al., 2008, and references therein).
Large samples of dwarf galaxies have now been exploited to show that passive dwarfs are found only in very dense environments, or accompanying a more massive companion (e.g. Haines et al., 2007). Studies of HI gas content in dwarf galaxies do not find any correlation between the HI gas surface density and star formation rate (Roychowdhury et al., 2009) or star formation efficiency (Bothwell, Kennicutt, & Lee, 2009), suggesting that dwarf galaxies are star-forming everywhere. Using HI surface density normalized by stellar mass to quantify star formation efficiency, Bothwell, Kennicutt, & Lee (2009) suggest that mass dependent quenching mechanism(s) are likely to play a dominant role in galaxy evolution. These results imply that transformations in the observable properties of dwarf galaxies may occur only in specific environments, and hence galaxy populations in the process of transformation should be confined to such regions. The post-starburst (or k+A) galaxies are among the best candidates for such transitional populations.
The k+A galaxies show strong Balmer absorption but lack emission lines in their spectra. Such galaxies are mostly found in and around galaxy clusters at (e.g. Mahajan, Haines, & Raychaudhury, 2010) and at higher redshifts (e.g. Dressler & Gunn, 1982; Poggianti et al., 2004, but see Goto (2005); Yan et al. (2009) for an alternative view). In the Coma and Abell 2199 supercluster (), dwarf galaxies show a stronger relation between star formation rate and local galaxy density than is found in the more massive galaxies (Haines et al., 2006; Mahajan, Haines, & Raychaudhury, 2010), while elsewhere (Barazza et al., 2009) a strong colour-density relation is found in Abell 901/902 system (). Clusters and rich groups at intermediate and high redshifts () have more luminous () k+A galaxies, which seem to be missing in rich clusters at (Zabludoff et al., 1996; Poggianti et al., 2004; Nolan, Raychaudhury, & Kabán, 2007).
In Mahajan, Haines, & Raychaudhury (2010), we combined the optical photometric and spectroscopic data (from the Sloan Digital Sky survey data release 7, SDSS DR7) with the 24 m MIPS observations to study the star-formation and active galactic nuclei (AGN) activity in galaxies across one of the nearest ( Mpc) supercluster, namely Coma. In this article we use a subset of data from SDSS DR7 to understand the origin of dwarf k+A galaxies, and their evolutionary link to the passive red dwarf galaxies that are observed in abundance in the Coma cluster (Jenkins et al., 2007). We briefly describe the dataset and definition of different galaxy populations in the following section. In §3 and §4 we present our analysis, finally discussing the implications of our analysis in §5.
We adopt the concordance cosmology () for calculating the magnitudes and distances. We note that at the redshift of Coma (z ), our results are independent of the choice of cosmology. Different techniques give varying estimates for the virial radius of the Coma cluster such that Mpc. For this paper the virial radius for the Coma cluster is assumed to be Mpc based on the weak-lensing analysis of Kubo et al. (2007). Any reference to the cluster core in this article imply region of the cluster centre. Throughout this article, we will refer to the pair of clusters Coma and Abell 1367, along with the associated filament of galaxies, as the Coma Supercluster.
2 Data
The optical photometric and spectroscopic data acquired by the SDSS DR7 (Abazajian et al., 2009) are used to select the galaxies belonging to the Coma supercluster from the SDSS spectroscopic galaxy catalogue only, requiring the member galaxies to be within RA deg and Dec deg on the sky, and with a radial velocity within 3,000 km s-1 of the mean redshift of the Coma supercluster. All our galaxies are brighter than SDSS magnitude (M for Coma cluster), which is the magnitude limit of the SDSS spectroscopic catalogue. In order to select the dwarf population by stellar mass, we define galaxies with as ‘dwarfs’ throughout this work since it is relatively extinction free comapared to other SDSS bands. However, we note that for the sample presented here, the and bands are linearly correlated. This gives us a sample of 3,050 dwarf galaxies which is used in this article.
The k+A galaxies, defined to have Å of Hδ in absorption and Å of Hα in emission, are taken from the catalogue compiled in Mahajan, Haines, & Raychaudhury (2010). Hereafter, we consider all galaxies with EW(Hα) Å as star-forming, and any reference to galaxy colour in context of this work refers to the broadband () colour (see §3).
3 Colour and environment
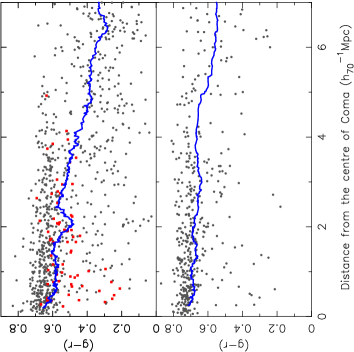
In Fig. 1, we plot the radial dependence of for all dwarf () galaxies found in and around the Coma cluster. The mean colour of dwarfs changes from 0.3 around 3Rvirial away from the centre, to 0.7 in the core of the cluster. It is also interesting to note that even with dwarfs alone, the red sequence for the Coma cluster extends beyond the virial radius, suggesting that the potential well of the cluster effectively contributes to the evolution of all galaxies as far as the cluster periphery.
The k+A galaxies in the vicinity of the Coma cluster span a wide range in colour, such that most of the blue k+As lie within Rvirial. The blue colour of some k+As suggests that the star formation in these galaxies has been very rapidly quenched no longer than Myr ago (also see Poggianti et al., 2004). In contrast, a Gyr should have elapsed since the termination of the last major episode of star formation in the red k+As, allowing for their observed colour. The k+A dwarfs show a relatively scattered distribution compared to red dwarfs. Assuming that some of these galaxies are seen in projection along the line of sight, it is fair to state that the k+As prefer intermediate density regions found in the outer regions and vicinity of rich clusters and groups (Figs. 1 & 2; also see fig. 12 of Mahajan, Haines, & Raychaudhury, 2010, for positions of k+A galaxies in the clusters), indicating a possible link between the processes contributing to the k+A phase in dwarf galaxies and the depth of the cluster potential.
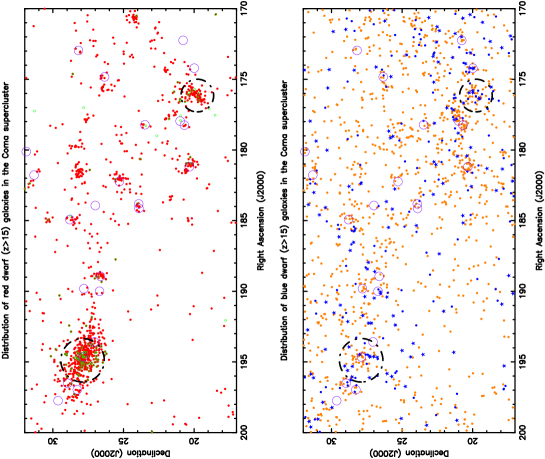
We use the colour–magnitude diagram to separate red and blue galaxies in the Coma supercluster, where, the blue galaxies are defined to have colour one mean absolute deviation (MAD) below the fitted red sequence. For consistency in this work we fitted this red sequence using dwarf galaxies only. This red sequence on an average assigns mag to a galaxy of mag. The location of the red and blue dwarf galaxies across the Coma supercluster is shown in Fig. 2. The k+A galaxies and galaxy groups found in the NASA Extra-galactic database (NED) (see Mahajan, Haines, & Raychaudhury, 2010, for the selection criteria) are shown explicitly. The red dwarf galaxies trace the rich structures– clusters, groups and the filament, suggesting a stronger star formation-density relation than their blue counterparts.
4 Spectral diagnostics
In the absence of dust, the equivalent width (EW) of Hα is a good indicator of the current star formation rate (SFR) of galaxies. On the other hand, intrinsic Hδ absorption is a characteristic feature of A-type stars, which have a lifetime of 1–1.5 Gyr. Hence, a galaxy that experienced a burst of star formation 1–2 Gyr ago is likely to show strong absorption in Hδ. But star-forming HII regions in galaxies with ongoing starburst can produce enough ionizing radiation to fill-in the Hδ absorption line.
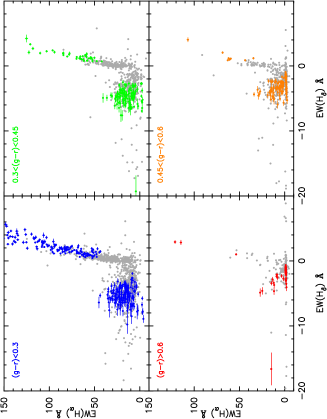
In Fig. 3 we show the distribution of dwarfs in the Coma supercluster in the EW(Hα)–EW(Hδ) plane, segregated into four bins of colour. The four colour bins are such that the both the redder bins contain galaxies belonging to the red sequence. As galaxies become redder towards the cluster core (Figs. 1 & 2) the narrow ridge formed by blue galaxies having very strong Hα emission but negligible Hδ absorption vanishes. In dealing with the spectral features it is important to check whether the two populations seen in this EW(Hα)–EW(Hδ) plane result from measurement uncertainties. In order to do that, we split the galaxies in each panel into those that have measurement uncertainty according to SDSS, of the measured EW for both Hα and Hδ (the coloured points in Fig. 3) and those that do not (grey points in Fig. 3). As expected, as the emission features become weak for the passively evolving red dwarfs, more galaxies inhabit the uncertain zone.
However among the blue, star-forming class, there exists at least two sub-populations, one that of the starburst dwarfs, which line-up in a narrow ridge on the right hand side of the EW(Hα)–EW(Hδ) plane, and the other of normal star-forming and post-starburst galaxies that have significant absorption in Hδ. The latter class of blue dwarfs overlaps with the red ones, showing relatively low EW(Hα) and some absorption in Hδ. Although most of these galaxies have continuous star formation histories with a low SFR, a sub-population might have been quenched recently ( Gyr old; Poggianti et al., 2004) as they are assembled into clusters via the large-scale structure (e.g. Mahajan, Raychaudhury & Pimbblet, 2010), thus terminating the starburst. From Figs. 1 and 2 it is also evident that although most of the blue dwarfs within 3Rvirial of the cluster centres have low Hα emission (Å), such galaxies are found elsewhere in the supercluster as well.
The red dwarfs showing Hδ absorption similar to the blue galaxies could be (i) dominated by metal-rich stellar populations (Smith et al., 2008; Mahajan & Raychaudhury, 2009), or (ii) transformed large spiral galaxies, whose disks have been removed after they fell into the cluster (e.g. Abadi, Moore, & Bower, 1999; Barazza et al., 2009), due to the impact of environmental mechanisms such as ram-pressure stripping (Gunn & Gott, 1972), or (iii) star-forming dwarf galaxies in the early phases of transformation (Lin & Faber, 1983; Boselli et al., 2008, and references therein). We discuss these possibilities further in §5.
In the Coma cluster, most () of the dwarf galaxies are red (Fig. 1) and show no Hα emission (Fig. 3), while the same fraction is only in the neighbouring Abell 1367 cluster. Given that a significant fraction of blue galaxies with more than Å of absorption in Hδ, also have Å of emission in Hα (Fig. 3), it is likely that star formation in some of them was abruptly quenched.
5 Discussion
In this work we attempt to understand the origin of k+A galaxies, and the possible evolutionary link between this transitional population and the red dwarfs found abundantly in the Coma cluster (e.g. Jenkins et al., 2007; Chiboucas et al., 2010). We use the publicly available SDSS DR7 data for the entire supercluster, with a view to studying the influence of large-scale structure, if any, on the evolution of the k+A galaxies in the low redshift Universe. In agreement with other studies of cluster dwarfs in the nearby Universe (e.g. Poggianti et al., 2004; Boselli et al., 2008), we find that the k+A galaxies prefer the intermediate density regions in the vicinity of rich structures. General studies of k+A galaxies at z also reveal that they preferentially avoid very low and high density regions (Balogh et al., 2005; Goto, 2005).
If star formation in a galaxy is truncated by some mechanism affecting the halo gas, star formation is quenched on long time scales of Gyr (e.g. Kodama & Bower, 2001; Kawata & Mulchaey, 2008). However if the star formation is suddenly quenched, for instance when a galaxy encounters the cluster environment and is stripped not only of the reservoir of gas but also the supply for ongoing star formation, the SFR declines on much shorter timescales of Myr. Thus one is more likely to observe the transient populations, such as the blue passive galaxies (e.g. Mahajan & Raychaudhury, 2009) and k+A glaxies in the latter scenario. This is also consistent with the idea that an infalling galaxy can lose most of its gas in a starburst or violent encounters with fellow infalling galaxies on the cluster periphery (Mahajan, Raychaudhury & Pimbblet, 2010, and references therein) and subsequently evolve in a passive fashion as it settles into the cluster core, on a timescale equivalent to a few times the cluster crossing time ( Gyr).
For the dwarf galaxies falling into clusters and groups in the Coma supercluster, the velocity field varies significantly depending upon the depth of the potential well they are approaching. Hence, it is likely that the galaxies falling into deeper potentials undergo a burst of star formation in which they either exhaust all the gas content, and/or lose it through interactions with the intra-cluster medium (ICM), thus experiencing a sudden and rapid cessation in star formation (e.g. Tzanavaris et al., 2010, also see Fig. 5). On the other hand, galaxies falling into relatively shallower potentials are likely to suffer slow quenching. This explains the presence of dwarf k+A galaxies mostly in the vicinity of the two rich clusters, Coma and Abell 1367, and occasionally in galaxy groups embedded in the filament crossing them (Fig. 2).
In the Coma supercluster we find that around 86% (78%) of all the k+A dwarfs are found within 10 (5) Mpc of the centre of the clusters, suggesting a close link between the transitional k+A population and the cluster environment. Consistent with previous results (Poggianti et al., 2004), we find that most of the blue k+A dwarfs in the vicinity of the Coma cluster are found within its virial radius. The blue colour of some k+As suggests that the star formation in these galaxies has been quenched rapidly within the last Myr. These observations are similar to those made for the comparable Virgo cluster. Boselli et al. (2008) studied the evolution of dwarf ( M⊙) galaxies in Virgo by comparing their UV to radio spectral energy distributions (SEDs) to multi-zone chemospectrophotometric models. Their results suggest that not only is the star formation in the dwarf galaxies entering the Virgo cluster quenched on short ( Myr) time-scales, most of the luminous late-type spirals might also be transformed to relatively massive dEs in a similar fashion.
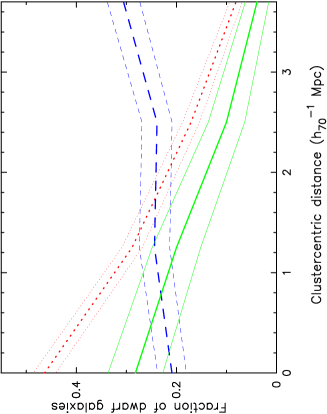
In Fig. 4 we find evidence to support a similar scenario in the Coma cluster. While the fraction of red dwarfs steadily increases from 4 Mpc ( Rvirial) to the centre of the cluster, the population of blue dwarfs declines steadily within the virial radius. The distribution of k+A dwarf galaxies follows the red dwarfs. Since the k+A phase is relatively short-lived ( Gyr; Balogh et al., 2005) in a galaxy’s lifetime, the observation of even a small fraction of such a transitional population suggests that a much larger proportion of all galaxies in the region may have passed through this stage.
Stellar population synthesis models suggest that galaxies with k+A spectral features (strong Balmer absorption and lack of emission) are best modelled as a post-starburst (Dressler & Gunn, 1992; Poggianti et al., 1999, and references therein), i.e. star formation is completely ceased following a burst. Studies of large-scale inter-cluster filaments provide statistical evidence to show that galaxies infalling into clusters are likely to undergo a starburst on the outskirts of clusters, before they are assimilated in their cores (e.g. Porter et al., 2008; Mahajan, Raychaudhury & Pimbblet, 2010, and references therein). These results imply that bursts of star formation in galaxies falling into clusters are inevitable consequences of the hierarchical assembly of structures. This is mainly dependent on two factors: (i) the gas content of the infalling galaxies, and (ii) the velocity field around the cluster (e.g. Mahajan, Mamon, & Raychaudhury, 2010). This scenario is further supported by the SDSS based study of k+A galaxies by Balogh et al. (2005), who find that the colours and the Hδ EW of k+A galaxies are consistent with models where of the stellar mass of galaxies is formed in a recent starburst.
We find that 7.8% of all dwarf galaxies within 3Rvirial of the Coma cluster are k+As, while in the relatively smaller Abell 1367 this fraction declines to 4.1% within the same aperture. Furthermore, excluding the clusters, the fraction of k+A galaxies in the rest of the supercluster (Fig. 2) is only 1.4%. The wide range of ages ( Gyr) and metallicities () in the Coma cluster dwarfs suggests non-unique evolutionary histories for these galaxies (Lisker et al., 2007; Smith et al., 2008, and references therein). While some of the oldest red dwarfs, confined to the cluster core, may belong to the primordial cluster population (Smith et al., 2008), others could have transformed from luminous late-type spirals, after their infall into the cluster (Fig. 5; also see Boselli et al., 2008; Barazza et al., 2009). The surface brightness profiles of dwarf () galaxies in the Coma cluster also show that while the galaxies fitted with a single Sérsic profile (dEs) could come from star-forming dwarfs, the dwarf lenticulars (fitted with Sérsic exponential profile) are evolved spirals that were harassed during infall (Aguerri et al., 2005, also see Porter et al. 2008).
Figs. 2 and 3 provide further clues to the evolution path adopted by dwarfs. While some blue galaxies show ongoing starburst (right-hand ridge in Fig. 3), star formation in others, especially those falling into clusters, must be suddenly quenched (Figs. 2 and 4). On the other hand, the red galaxies trace the high density regions, suggesting a relatively stronger star formation-density relation throughout the supercluster (Fig. 1 & 2).
The range of values of various relevant measured parameters, explored in this article for the dwarf galaxies in the Coma supercluster do not allow us to sub-divide our sample into galaxies with widely different evolutionary histories. Instead, by considering all dwarfs in Coma as a single ensemble, we have been able to provide some insight into the complex mix of star formation histories among this vulnerable population. It is interesting to note that contrary to the results presented in this article, Yan et al. (2009) find that the giant k+A galaxies () show an environmental dependence similar to that of blue galaxies. In a study of galaxies in a cluster at z 0.54, De Lucia et al. (2009) found only 6 post-starburst galaxies amongst the spectroscopic cluster members, thus suggesting that the transformation of star-forming infalling galaxies to the faint red ones found in the low redshift clusters must have occurred primarily through physical processes that do not lead to a post-starburst phase. In order to establish and understand the mass dependence in the occurrence and nature of k+A galaxies, a homogeneous analysis of the spectroscopic properties of galaxies spanning a wide range of , environments and different epochs is required. We intend to return to this in future.
6 Conclusions
By using the SDSS DR7 data from the spectroscopic galaxy catalogue for the dwarf () galaxies in the Coma supercluster (z ), we have shown that:
-
•
The mean colour of dwarf galaxies in and around the Coma cluster increases from 0.3 at Rvirial to 0.7 in the core.
-
•
In the Coma supercluster, the k+A dwarf galaxies are mostly confined to the cluster infall regions, and occasionally galaxy groups, suggesting that most of the dwarf galaxies falling into the Coma and Abell 1367 clusters are likely to experience sudden quenching of star formation and hence are observable in the k+A phase. On the contrary, dwarfs falling into galaxy groups embedded in the filament are likely to suffer slow truncation.
-
•
The blue colour of some k+A dwarfs in the Coma cluster lying within its virial radius, suggests that the star formation in these galaxies was quenched rapidly within the last Myr. In contrast, the last major episode of star formation in the red k+A galaxies should have ceased on a timescale of Gyr.
-
•
Assuming the red dwarf galaxies to be passively evolving, they show a stronger star formation-density relation relative to their bluer counterparts.
-
•
A significant fraction of all red galaxies in the Coma supercluster show some absorption in Hδ (0–3 Å), suggesting that star formation in them could have been quenched within the last Gyr.
-
•
The populations of k+A and red dwarfs increases towards the cluster core in Coma from almost twice the virial boundary, while that of the blue ones decreases steadily. The k+A galaxy distribution is flatter relative to red dwarfs, and they are not as concentrated in the core of the cluster as the red dwarfs, suggesting that the k+A galaxies preferentially avoid very dense and underdense regions in equal measures.
7 Acknowledgments
This research has made use of the SAO/NASA Astrophysics Data System, and the NASA/IPAC Extragalactic Database (NED). Funding for the SDSS and SDSS-II has been provided by the Alfred P. Sloan Foundation, the Participating Institutions, the National Science Foundation, the U.S. Department of Energy, the National Aeronautics and Space Administration, the Japanese Monbukagakusho, the Max Planck Society, and the Higher Education Funding Council for England. The SDSS Web Site is http://www.sdss.org/. SM is supported by grants from ORSAS, UK, and the University of Birmingham. We thank the anonymous referee for constructive comments which have greatly helped in improving this article.
References
- Abadi, Moore, & Bower (1999) Abadi M. G., Moore B., Bower R. G., 1999, MNRAS, 308, 947
- Abazajian et al. (2009) Abazajian K. N., et al., 2009, ApJS, 182, 543
- Aguerri et al. (2005) Aguerri J. A. L., Iglesias-Páramo J., Vílchez J. M., Muñoz-Tuñón C., Sánchez-Janssen R., 2005, AJ, 130, 475
- Balogh et al. (2005) Balogh M. L., Miller C., Nichol R., Zabludoff A., Goto T., 2005, MNRAS, 360, 587
- Barazza et al. (2009) Barazza F. D., et al., 2009, A&A, 508, 665
- Boselli et al. (2008) Boselli A., Boissier S., Cortese L., Gavazzi G., 2008, ApJ, 674, 742
- Bothwell, Kennicutt, & Lee (2009) Bothwell M. S., Kennicutt R. C., Lee J. C., 2009, MNRAS, 400, 154
- Chiboucas et al. (2010) Chiboucas K., Tully R. B., Marzke R. O., Trentham N., Ferguson H. C., Hammer D., Carter D., Khosroshahi H., 2010, ApJ, 723, 251
- De Lucia et al. (2009) De Lucia G., Poggianti B. M., Halliday C., Milvang-Jensen B., Noll S., Smail I., Zaritsky D., 2009, MNRAS, 1379
- Dressler & Gunn (1982) Dressler A., Gunn J. E., 1982, ApJ, 263, 533
- Dressler & Gunn (1992) Dressler A., Gunn J. E., 1992, ApJS, 78, 1
- Goto (2005) Goto T., 2005, MNRAS, 357, 937
- Gunn & Gott (1972) Gunn J. E., Gott J. R. I., 1972, ApJ, 176, 1
- Haines et al. (2006) Haines C. P., La Barbera F., Mercurio A., Merluzzi P., Busarello G., 2006, ApJ, 647, L21
- Haines et al. (2007) Haines C. P., Gargiulo A., La Barbera F., Mercurio A., Merluzzi P., Busarello G., 2007, MNRAS, 381, 7
- Jenkins et al. (2007) Jenkins L. P., Hornschemeier A. E., Mobasher B., Alexander D. M., Bauer F. E., 2007, ApJ, 666, 846
- Kawata & Mulchaey (2008) Kawata D., Mulchaey J. S., 2008, ApJ, 672, L103
- Kodama & Bower (2001) Kodama T., Bower R. G., 2001, MNRAS, 321, 18
- Kubo et al. (2007) Kubo J. M., Stebbins A., Annis J., Dell’Antonio I. P., Lin H., Khiabanian H., Frieman J. A., 2007, ApJ, 671, 1466
- Lin & Faber (1983) Lin D. N. C., Faber S. M., 1983, ApJ, 266, L21
- Lisker et al. (2007) Lisker T., Grebel E. K., Binggeli B., Glatt K., 2007, ApJ, 660, 1186
- Mahajan & Raychaudhury (2009) Mahajan S., Raychaudhury S., 2009, MNRAS, 400, 687
- Mahajan, Haines, & Raychaudhury (2010) Mahajan S., Haines C. P., Raychaudhury S., 2010, MNRAS, 404, 1745
- Mahajan, Mamon, & Raychaudhury (2010) Mahajan S., Mamon G. A., Raychaudhury S., 2010, submitted to MNRAS
- Mahajan, Raychaudhury & Pimbblet (2010) Mahajan S., Raychaudhury S., Pimbblet K. A., in preparation
- Nolan, Raychaudhury, & Kabán (2007) Nolan L. A., Raychaudhury S., Kabán A., 2007, MNRAS, 375, 381
- Poggianti et al. (1999) Poggianti B. M., Smail I., Dressler A., Couch W. J., Barger A. J., Butcher H., Ellis R. S., Oemler A. J., 1999, ApJ, 518, 576
- Poggianti et al. (2001) Poggianti B. M., et al., 2001, ApJ, 562, 689
- Poggianti et al. (2004) Poggianti B. M., Bridges T. J., Komiyama Y., Yagi M., Carter D., Mobasher B., Okamura S., Kashikawa N., 2004, ApJ, 601, 197
- Poggianti et al. (2009) Poggianti B. M., et al., 2009, ApJ, 693, 112
- Porter et al. (2008) Porter S. C., Raychaudhury S., Pimbblet K. A., Drinkwater M. J., 2008, MNRAS, 388, 1152
- Roychowdhury et al. (2009) Roychowdhury S., Chengalur J. N., Begum A., Karachentsev I. D., 2009, MNRAS, 397, 1435
- Smith et al. (2008) Smith R. J., et al., 2008, MNRAS, 386, L96
- Smith et al. (2009) Smith R. J., Lucey J. R., Hudson M. J., Allanson S. P., Bridges T. J., Hornschemeier A. E., Marzke R. O., Miller N. A., 2009, MNRAS, 392, 1265
- Tzanavaris et al. (2010) Tzanavaris P., et al., 2010, ApJ, 716, 556
- Yan et al. (2009) Yan R., et al., 2009, MNRAS, 398, 735
- Zabludoff et al. (1996) Zabludoff A. I., Zaritsky D., Lin H., Tucker D., Hashimoto Y., Shectman S. A., Oemler A., Kirshner R. P., 1996, ApJ, 466, 104