Long-term chromospheric activity in southern M dwarfs:
Gl 229 A and Gl 752 A
Abstract
Several late-type stars present activity cycles similar to that of the Sun. However, these cycles have been mostly studied in F to K stars. Due to their small intrinsic brightness, M dwarfs are not usually the targets of long-term observational studies of stellar activity, and their long-term variability is generally not known. In this work, we study the long-term activity of two M dwarf stars: Gl 229 A (M1/2) and Gl 752 A (M2.5). We employ medium resolution echelle spectra obtained at the 2.15 m telescope at the Argentinian observatory CASLEO between the years 2000 and 2010 and photometric observations obtained from the ASAS database. We analyzed Ca II K line-core fluxes and the mean V magnitude with the Lomb-Scargle periodogram, and we obtain possible activity cycles of 4 yr and 7 yr for Gl 229 A and Gl 752 A respectively.
1 Introduction
During the last years, a new interest on M dwarfs has emerged. One reason is because their low masses make them ideal targets around which to search for terrestrial planets in the habitable zone (e.g. Charbonneau et al. 2009). However, these stars can be very active and their activity signatures can hinder the detection of orbiting planets (e.g. Bonfils et al. 2007). Furthermore, the levels of UV radiation, which are strongly related to stellar activity, can also limit the habitability (Buccino et al., 2006, 2007).
The usually accepted model to describe the generation and intensification of magnetic fields in late F- to early M-type stars is the -dynamo first invoked to explain solar activity (Parker 1955). It is this model, where the large-scale magnetic field generation results from the interaction of differential rotation in the tachocline and the convective turbulence, which predicts a strong correlation between activity and rotation. Magnetic activity therefore decays with time as the star spins down due to braking by magnetized winds. However, recent results show that this decay happens in the first two Gyr of a star’s life, to be compared with lifetimes of late-type stars which are at least 2 times larger (Pace & Pasquini, 2004).
Since stars with spectral type later than M3 are believed to be fully convective, they should not be able to sustain a solar-like dynamo. Furthermore, most dM stars are usually slow rotators. In a recent survey of 123 M-dwarfs, Browning et al. (2010) found that only seven of them are rotating more rapidly than their detection threshold of . However, there is plenty of observational evidence that late-type slow rotators like dMe stars are very active and have strong magnetic fields (Johns-Krull & Valenti, 1996), with filling factors larger than for earlier stars (Mochnacki & Zirin, 1980; Hawley & Pettersen, 1991; Mauas & Falchi, 1994, 1996; Mauas et al., 1997). In fact, there is evidence that stellar spin-down and active lifetimes change near the mass where full convection sets in (Delfosse et al., 1998; Barnes, 2003; Reiners & Basri, 2008; West et al., 2008).
Chabrier & Küker (2006) proposed that for fully convective dM stars, large-scale magnetic fields could be produced by a pure dynamo, where activity would not decay with time since it does not involve rotation. Browning (2008) developed a 3-D dynamo model for M dwarfs, and found that fully convective stars can generate kG-strength magnetic fields without the aid of a shearing tachocline.
To date, activity cycles have been detected in several late-type stars (e.g. Baliunas et al. 1995; Buccino & Mauas 2008). However, these works are mainly concentrated on F to K stars, since due to the long exposure times needed to observe them, the red and faint M dwarfs are usually not the target of long-term observational studies of stellar activity. As a contribution to this subject, we have developed an observing program at the Argentinian observatory Complejo Astronomico El Leoncito (CASLEO) dedicated to periodically obtain medium resolution echelle spectra of southern late-type stars, including those stars which are fully-convective. Our program has been operating since 1999. From our data, we found evidences of cyclic activity for the dMe 5.5 star Prox Centauri, with P = 442 45 days (Cincunegui et al., 2007a), and for the dMe 3.5 spectroscopic binary Gl 375, with P=763 40 days (Díaz et al., 2007b).
In this work we study the long-term activity of the dM stars Gl 229 A and Gl 752 A. In section §2 we describe the spectroscopic observations obtained and the photometric data used to analyze these stars. In section §4 and §3 we report our results. In section §5 we analyze the role of H as an activity indicator in these stars.
2 Observations
Since 1999, we systematically observed more than 140 main-sequence stars from F5.5 to M5.5, with the echelle spectrograph on the 2.15 m telescope of the CASLEO Observatory located in the Argentinean Andes. To date, we have more than 4000 spectra, ranging from 3890 to 6690 Å with R =26400, which constitute an ideal dataset to study long-term activity. These spectra are calibrated in flux according to the method outlined in Cincunegui & Mauas (2004), and allow us to simultaneously study different spectral features, from the Ca II lines to H (e.g. Díaz et al. 2007a).
The usual indicator of chromospheric activity in dF to dK stars is the well known Mount Wilson index, essentially the ratio of the flux in the core of the Ca II H and K lines to the continuum nearby (Vaughan et al., 1978). Cincunegui et al. (2007b) defined a Ca II index from the CASLEO spectra, which was calibrated to the Mount Wilson index. Since CASLEO spectra are calibrated in flux, they also derived a conversion factor which translates known index to flux in the Ca II cores. However, due to the low intrinsic luminosity of M dwarfs, the low signal-to-noise in the Ca II H line in several CASLEO spectra and the fact that this line can be contaminated by the H line, the index is not suitable to study the chromospheric activity on the faint stars in this study. In this paper we use as a proxy of stellar activity the Ca II K line-core flux, integrated with a triangular profile of 1.09 Å FWHM to mimic the response of the Mount Wilson instrument.
We complement our data with photometry from the All Sky Automated Survey (ASAS). This project is dedicated to constant photometric monitoring of the whole available sky, including approximately 107 stars brighter than 14 magnitude (Pojmanski, 2002). Presently, ASAS consists of two observing stations, one in Las Campanas Observatory, Chile (since 1997) and the other on Haleakala, Maui (since 2006). Each site is equipped with two wide-field 200/2.8 instruments, observing simultaneously in the V and I bands111The public data are available at http://www.astrouw.edu.pl/asas/.. In this work we used the mean V magnitude of each observing season to analyze the long-term activity of the stars.
3 Gl 229 A - HD 42581
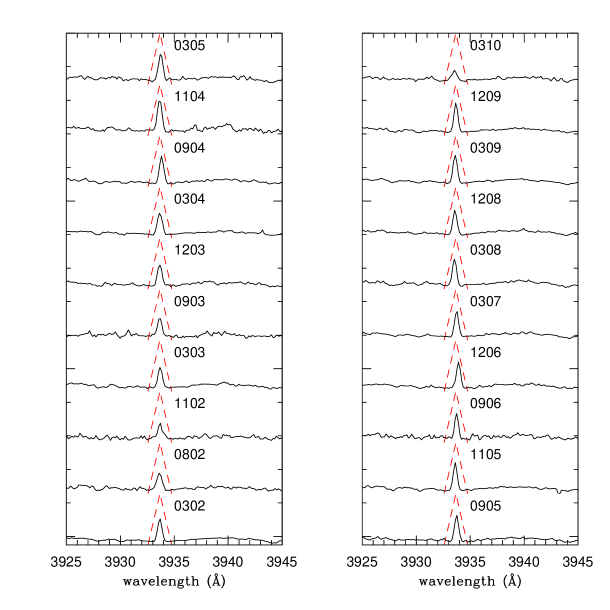
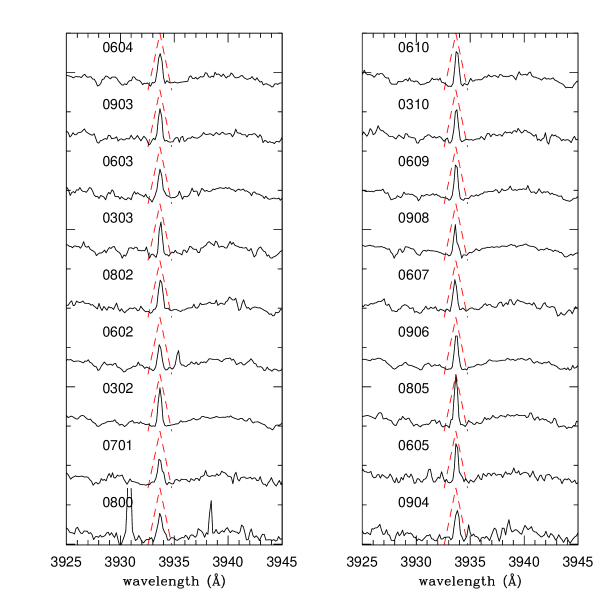
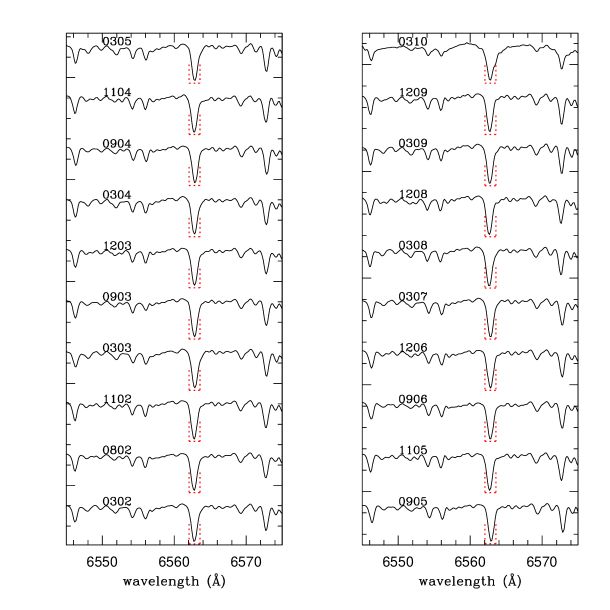
Gl 229 A is a moderately active dM1 flare star (Byrne et al., 1985), with a brown dwarf companion (Nakajima et al., 1995). We observed Gl 229 A for 20 nights between the years 2002 and 2010. In Fig. 1 we plot each spectrum, with a label which indicates the month and year of the observation (e.g. 0302 means that the observation was obtained in March, 2002). We excluded the spectrum obtained in November 2004 due to its low signal-to-noise near the Ca II lines and the one observed in March 2010 because it was obtained in a cloudy night.
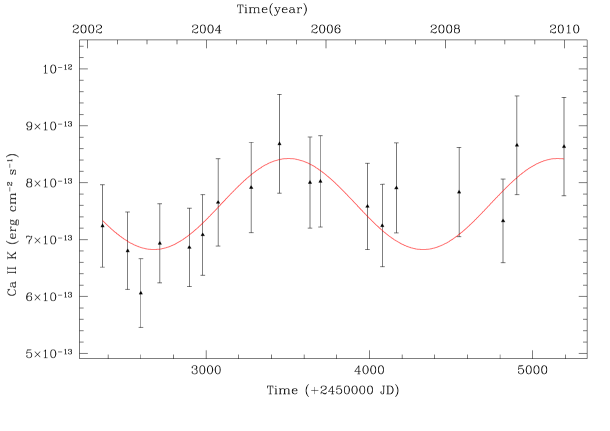
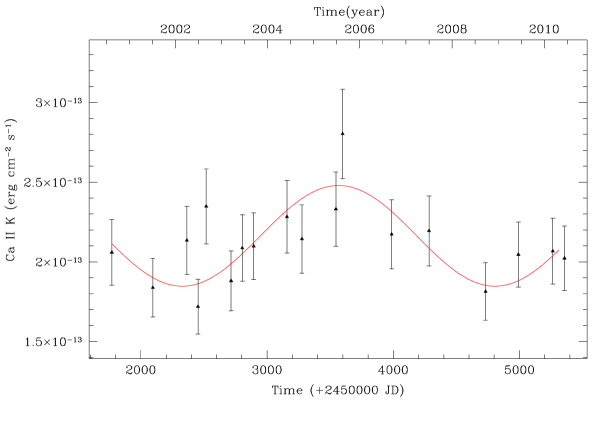
In Fig. 2 we plot the Ca II K fluxes measured on the CASLEO spectra vs. time, considering an error of 10% for the calibrated fluxes (Cincunegui & Mauas, 2004). In this figure we observe that the maximum of activity is reached in the year 2004, where the level of activity is 43% larger than at the minimum.
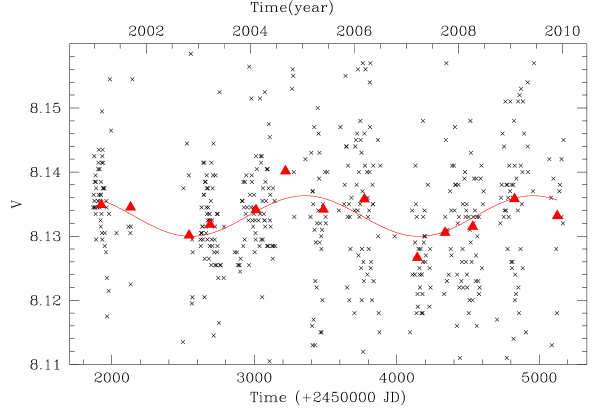
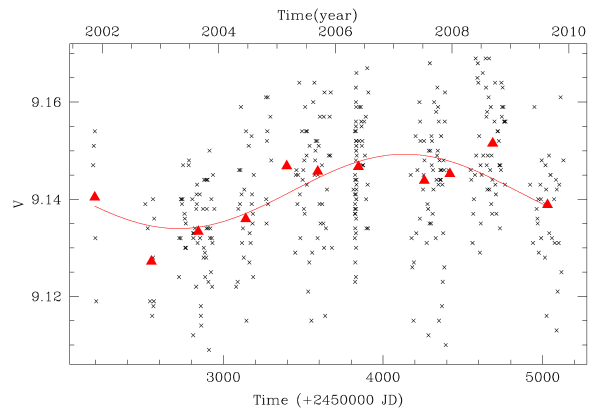
On the other hand, in Fig. 3 we plot the V magnitude obtained from the ASAS catalog. The ASAS data for this system cover the period between 2001 and 2010. We discarded all the observations that were not qualified as either A or B in the ASAS database (i.e. we retained only the best quality data), as well as 16 outlier observations. The final dataset consists of 469 points, with typical errors of around 30 mmag. The mean magnitude variation for the whole period is only 0.17% around , while the short-scale variations in the V magnitude have a 1% amplitude. To explore if these variations are governed by spots and active regions on the stellar surface, we analyzed if there is evidence of rotational modulation in the ASAS data, studying the dataset in each observing season with the Lomb-Scargle periodogram (Scargle, 1982; Horne & Baliunas, 1986). However, in agreement with Byrne et al. (1985), we did not find evidence of rotational modulation in the ASAS datasets.
To search for long-term chromospheric cycles, we analyzed both datasets with the Lomb-Scargle periodogram, and we computed the False Alarm Probability (FAP) of the obtained periods with a Monte Carlo simulation, as is explained in Buccino & Mauas (2009). For the Ca II K fluxes plotted in Fig. 2 we obtained a period days with a very good FAP=1.4%.
For the ASAS time series we obtained a peak at 1649 days with a FAP=. This extremely low FAP is related to the large number of points of this series (see Eq. 22 in Horne & Baliunas 1986). To reduce the number of points, and to eliminate short-term variations, we binned the data grouping together the observations corresponding to the same observing season. We weighted each value with the error reported in the ASAS database, and we computed the error of each mean V magnitude as the square root of the variance weighted mean (see Frodesen et al. 1979, Eq. 9.12). For this series we detected a similar period, days, with a FAP=7.2%. To check wether the period we obtained depends on the binning, we also analyzed the mean annual V magnitude with the same algorithm and we obtained a similar peak at days, altough with a larger FAP=70%.
To analyze the robustness of our results, we considered the series obtained by binning the data by observing season, and we analyzed the periodograms of the series obtained by alternatively eliminating each data point. We obtained between 1615 and 1799 days with FAPs15% (75% of them were =1649 days) and between 1493 and 1723 days with FAPs45%, and 62% were days. The fact that the periods are similar in all cases supports the intrepretation of an harmonic component with period 4 yr present in the ASAS series.
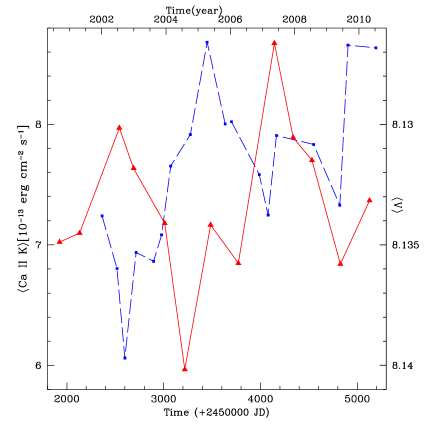
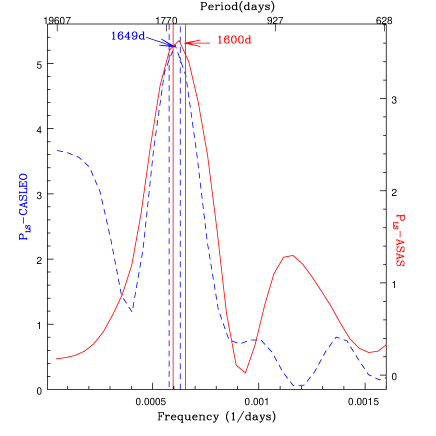
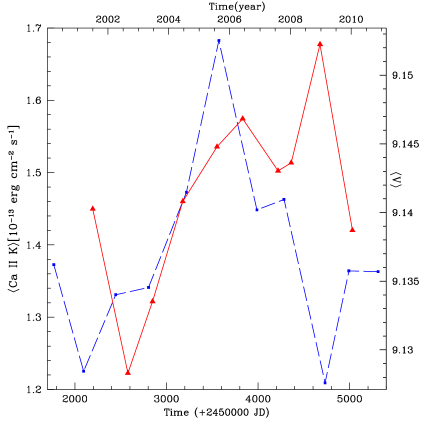
In Fig. 4(a) we plot the Ca II fluxes and the weighted mean V magnitudes per observing season together. The Lomb-Scargle periodogram of both series are shown in Fig. 4(b). Note that both periods coincide within the statistical errors.
Radick et al. (1998) studied long-term photometric and chromospheric emission variations in solar-type stars, and found that young, active stars become fainter as their chromospheric emission increases, whereas older, less active stars, including the Sun, tend to become brighter as their chromospheric emission increases. Since during active periods the surface of the star is covered by dark spots and bright faculae, a simple interpretation of this behavior is that long-term variability of young stars is spot-dominated, whereas for older stars it is faculae-dominated. Recently, Hall et al. (2009) confirmed the anti-correlation between brightness and chromospheric emission for active stars, and found that direct correlations are not prevalent for the less active solar-age stars.
In particular for Gl 229 A, the maximum Ca II K line-core emission nearly coincides with the minimum mean V magnitude, as in the Sun. In Fig. 4(a) we invert the V-magnitude scale and we observe that if we shift the chromospheric activity indicators by approximately 500 days, there is a good correlation between both series with a Pearson correlation coefficient R=0.59.
This timelag between photometric and magnetic variations has already been observed for stars of different spectral types, from Com (G0V) to Eri (K2V), including the binary Boo (see for example Gray & Baliunas 1995; Gray et al. 1996a, b). For the coolest star in their sample ( Eri) the timelag of temperature variations is about 0.3 years (110 days). Gray et al. (1996a) showed that, when different stars are compared, this timelag is anticorrelated with effective temperature (see their Fig. 8). However, the Sun does not fit this relation (Gray & Livingston, 1997). Recently, Díaz et al. (2007b) reported a 140-days (0.4 yr) timelag between chromospheric and photospheric activity in the Gl 375 system and Brown et al. (2008) obtained a 2-year lag for the K2 III star Arcturus. The physical explanation for these timelags remains unknown (Gray, 1998; Brown et al., 2008).
4 Gl 752 A - HD 180617
Gl 752 is a binary system composed by the BY Dra variable M2.5 star Gl 752 A and a fainter companion Gl 752 B (also known as VB10) of spectral class M8V. Pravdo & Shaklan (2009) reported that the astrometric variations detected in Gl 752 B could be an evidence of the first giant planet around an ultra cool star. However, Bean et al. (2010) discarded the posibility of a planetary companion around this star by radial velocity techniques.
The Gl 752 system is particularly interesting to study the dynamo processes as it is composed by two coeval stars with different internal structures. The primary star has a radiative core, where a solar-type dynamo could operate, and the secondary component is a fully-convective star. With this aim, Linsky et al. (1995) analyzed several UV lines from HST spectra of Gl 752 A and B. They detected a flare-like event in the M8 component, which is an indirect evidence of a dynamo operating in this fully-convective star.
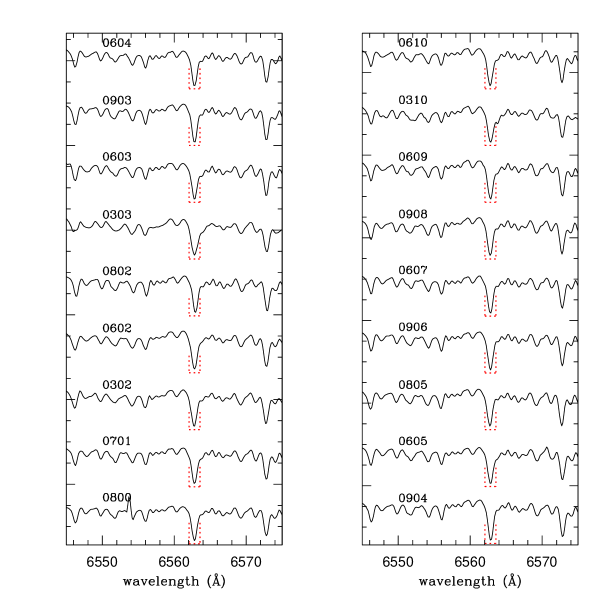
We observed Gl 752 A at CASLEO during 18 nights between the years 2000 and 2010. In Fig. 5 we plot the spectra obtained, where the labels are as in Fig. 1 with the month and year of the observation. The line-integration windows are also marked with a dashed line.
In Fig. 6 we plot the Ca II K fluxes measured on the CASLEO spectra vs. time. Following Cincunegui & Mauas (2004) we considered a 10% error in the calibrated fluxes. For our time interval, the yearly mean of the K-line flux varies by 35%, and the maximum is reached in 2005.
Finally, in Fig. 7 we plot the V magnitude available at the ASAS catalog. We selected the data of best quality and discarded 7 outlier points, resulting in a total of 398 points. From these data, we obtain a mean magnitude between 2001 and 2010, with a long-term variation of only 0.25% between minimum and maximum. However, short-time variations (month) of the V magnitude are more evident, and are between 0.3 to 1.5 %. As done for Gl 229 A, we analyzed if these variations were modulated by stellar rotation. In particular, from the projected rotational velocity published in Glebocki & Stawikowski (2000), Cincunegui et al. (2007b) estimated a rotational period days for this star. However, we did not find any significant periodicity neither in the seasonal datasets nor in the whole ASAS series.
To search for long-term chromospheric cycles we analyzed the Ca II K fluxes with the Lomb-Scargle periodogram, and we detected a period days with a Monte Carlo FAP=25%. This relatively large FAP is due to the large variations that can be seen in the data in 2002 and 2005. In both cases, these variations, obtained between observations taken a few months apart, cannot be caused by cyclic activity. If we smooth out these variations by averaging these points, we obtain a similar period with a more significant FAP.
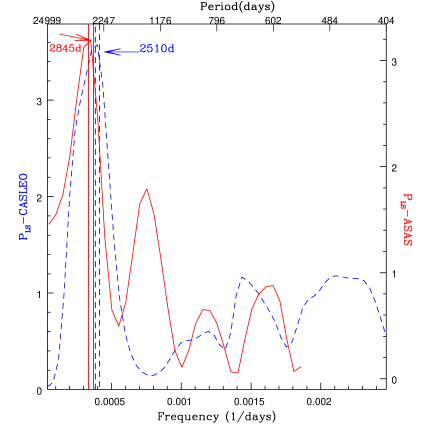
For the mean V magnitude per observing season the period found was days with a FAP=22%. In Fig. 8(b) both periodograms are plotted together. In the figure, it can be seen that both periods coincide within 2- errors. The periodogram derived from the ASAS data-sets exhibits a second peak near 1400 days, which is probably a subharmonic component of the time-series. For completeness, we also studied the periodogram obtained for the whole dataset, without binning, and obtained a significant peak at 2944 days, again with an extremely low FAP=. For the series obtained with the annual means, we detected a significant peak at 2833 days, with a FAP=50%. Again, all periods coincide.
To study the robustness of the periods detected in Fig. 8(b), we repeated the test explained in Section §3 for both series plotted in Fig. 8(a). For the series obtained from the CASLEO observations we detected between 2477 and 2505 days with FAPs55%, where nine of the eleven periods detected were 2477 days. From the ASAS dataset, we obtained eight series with between 2845 and 2990 days with FAPs, two series with between 3300 and 3495 days with FAPs and one with =1398 days. We remark that in this last periodogram there is a secondary maximum near 2985 days with FAP50%. This test shows that although we shorten the series by discarding their extremes the 7-year-period is still detected.
In contrst to Gl 229 A, in Fig. 8(a) we observe that Gl 752 A becomes fainter when the Ca II emission increases, implying that for this star spots dominate the emission.
On the other hand, in Fig. 8(a) the Ca II K line series precedes the mean V magnitude dataset. The chromospheric activity increased between 2001.2 and 2005.6, while the corresponding photospheric activity increment is between 2002.7 and 2006.5, as expressed by the Ca II fluxes and the V magnitude respectively. If we shift the chromospheric series in 360 days, both datasets coincide within the normalization constant with a Pearson correlation coefficient R=0.78.
5 H as an activity indicator
Another activity indicator usually employed in the study of dM stars is the flux in H. The flux in this line is generally considered to correlate well with the flux in the Ca II H and K lines and has the advantage of being located in a redder wavelength range than the Ca II lines, where M dwarfs are brighter. However, it has been reported by Cincunegui et al. (2007b) that the correlation between Ca II and H is not always valid. Cincunegui et al. (2007b) found that while some stars exhibit correlations between H and the Ca II lines, the slopes change from star to star. Furthermore, in several cases both fluxes were not correlated, as in the binary system Gl 375 (Díaz et al., 2007b), and other stars even exhibit anti-correlations. Recently, Walkowicz & Hawley (2009) analyzed the relation between simultaneous measurements of Ca II K and H fluxes in a sample of nearby M3 dwarfs, and found that the relationship between both tracers remains ambiguous for weak and intermediate activity stars. On the other hand, Meunier & Delfosse (2009) studied the contribution of plages and filaments in the H-Ca II relation in the Sun for different time scales, in an attempt to explain the results by Cincunegui et al. (2007b).
In this work, we checked whether an H-Ca II correlation exists for Gl 229 A and Gl 752 A. To do so, we computed the flux in the H line as the average surface flux in a 1.5 Å square passband centered in 6562.8 Å for all the spectra plotted in Fig. 9 and Fig. 10. For both stars the H line is in absorption, which indicate that Gl 229 A and Gl 752 A are not strongly active, since most active M dwarfs have H in emission. In Fig. 11(b) and 11(a) we plot the line-core fluxes in H vs. those in the Ca II K line. It can be seen that, within the errors, none of these stars exhibit any sign of correlation between the lines fluxes, as expressed by the Pearson correlation coefficients R=-0.09 for Gl 229 A and R=-0.11 for Gl 752 A. Therefore, the H line cannot be used as an activity indicator for these stars.
6 Conclusions
In this work we studied the long-term activity of two M dwarf stars: Gl 229 A and Gl 752 A. To do so, we analyzed the Ca II K line-core fluxes measured on our spectra obtained at the CASLEO Observatory since 2000, and the ASAS photometric data. Using the Lomb-Scargle periodogram, we obtained a possible activity cycle of 4 and 7 yrs for Gl 229 A and Gl 752 A, respectively. We note that, for both stars, similar periods are found in the photometry and in the Ca II fluxes, which constitute two completely independent datasets, a fact which strongly reinforces the significance of the results. As our program continues, we hope to confirm both periods in future work.
These periods are in agreement with evidences of periodic activity in M dwarfs which was previously reported for the dM stars Proxima Centauri (Cincunegui et al., 2007a) and the Gl 375 system (Díaz et al., 2007b).
Another interesting result of this work is that the chromospheric activity seems to precede the photometric data in yr. This time-lag was also reported in the dMe system Gl 375 (Díaz et al., 2007b). Although the physical explanation for this phenomenon remains unknown, one possible interpretation for the offset between the photometric and chromospheric variations is that the chromosphere gets heated before spots are formed. The time-lag detected in Gl 229 A and Gl 752 A’s data-sets bring further evidences of this phenomenon in late-type stars.
On the other hand, since the chromospheric emission in Gl 752 A is larger when the system is fainter, we conclude that the emission of this star should be dominated by dark spots rather than bright active regions. In contrast, in the case of Gl 229 A, the data evidence that the active regions dominate the emission. These results are consistent with the chromospheric-photospheric relations observed in solar-type stars in the literature (Radick et al., 1998; Lockwood et al., 2007; Hall et al., 2009).
We also analyzed simultaneous measurements of Ca II K and H fluxes obtained from our CASLEO spectra, and found no evident correlation between both indices, in agreement with previous results by Cincunegui et al. (2007b). Also, Walkowicz & Hawley (2009) found some correlation for the most active stars, but it breaks down for weakly active stars like the ones we study in the present paper.
References
- Baliunas et al. (1995) Baliunas, S. L., Donahue, R. A., Soon, W. H., Horne, J. H., Frazer, J., Woodard-Eklund, L., Bradford, M., Rao, L. M., Wilson, O. C., Zhang, Q., Bennett, W., Briggs, J., Carroll, S. M., Duncan, D. K., Figueroa, D., Lanning, H. H., Misch, T., Mueller, J., Noyes, R. W., Poppe, D., Porter, A. C., Robinson, C. R., Russell, J., Shelton, J. C., Soyumer, T., Vaughan, A. H., & Whitney, J. H. 1995, ApJ, 438, 269
- Barnes (2003) Barnes, S. A. 2003, ApJ, 586, 464
- Bean et al. (2010) Bean, J. L., Seifahrt, A., Hartman, H., Nilsson, H., Reiners, A., Dreizler, S., Henry, T. J., & Wiedemann, G. 2010, ApJ, 711, L19
- Bonfils et al. (2007) Bonfils, X., Mayor, M., Delfosse, X., Forveille, T., Gillon, M., Perrier, C., Udry, S., Bouchy, F., Lovis, C., Pepe, F., Queloz, D., Santos, N. C., & Bertaux, J. 2007, A&A, 474, 293
- Brown et al. (2008) Brown, K. I. T., Gray, D. F., & Baliunas, S. L. 2008, ApJ, 679, 1531
- Browning (2008) Browning, M. K. 2008, ApJ, 676, 1262
- Browning et al. (2010) Browning, M. K., Basri, G., Marcy, G. W., West, A. A., & Zhang, J. 2010, AJ, 139, 504
- Buccino et al. (2006) Buccino, A. P., Lemarchand, G. A., & Mauas, P. J. D. 2006, Icarus, 183, 491
- Buccino et al. (2007) —. 2007, Icarus, 192, 582
- Buccino & Mauas (2008) Buccino, A. P., & Mauas, P. J. D. 2008, A&A, 483, 903
- Buccino & Mauas (2009) —. 2009, A&A, 495, 287
- Byrne et al. (1985) Byrne, P. B., Doyle, J. G., & Menzies, J. W. 1985, MNRAS, 214, 119
- Chabrier & Küker (2006) Chabrier, G., & Küker, M. 2006, A&A, 446, 1027
- Charbonneau et al. (2009) Charbonneau, D., Berta, Z. K., Irwin, J., Burke, C. J., Nutzman, P., Buchhave, L. A., Lovis, C., Bonfils, X., Latham, D. W., Udry, S., Murray-Clay, R. A., Holman, M. J., Falco, E. E., Winn, J. N., Queloz, D., Pepe, F., Mayor, M., Delfosse, X., & Forveille, T. 2009, Nature, 462, 891
- Cincunegui et al. (2007a) Cincunegui, C., Díaz, R. F., & Mauas, P. J. D. 2007a, A&A, 461, 1107
- Cincunegui et al. (2007b) —. 2007b, A&A, 469, 309
- Cincunegui & Mauas (2004) Cincunegui, C., & Mauas, P. J. D. 2004, A&A, 414, 699
- Delfosse et al. (1998) Delfosse, X., Forveille, T., Perrier, C., & Mayor, M. 1998, A&A, 331, 581
- Díaz et al. (2007a) Díaz, R. F., Cincunegui, C., & Mauas, P. J. D. 2007a, MNRAS, 378, 1007
- Díaz et al. (2007b) Díaz, R. F., González, J. F., Cincunegui, C., & Mauas, P. J. D. 2007b, A&A, 474, 345
- Frodesen et al. (1979) Frodesen, G. A., Skjeggestad, O., & Tofte, H. 1979, Probability and Statistics in Particle Physics (Universitetsforlaget)
- Glebocki & Stawikowski (2000) Glebocki, R., & Stawikowski, A. 2000, Acta Astronomica, 50, 509
- Gray (1998) Gray, D. F. 1998, in Astronomical Society of the Pacific Conference Series, Vol. 154, Cool Stars, Stellar Systems, and the Sun, ed. R. A. Donahue & J. A. Bookbinder, 193–+
- Gray & Baliunas (1995) Gray, D. F., & Baliunas, S. L. 1995, ApJ, 441, 436
- Gray et al. (1996a) Gray, D. F., Baliunas, S. L., Lockwood, G. W., & Skiff, B. A. 1996a, ApJ, 465, 945
- Gray et al. (1996b) —. 1996b, ApJ, 456, 365
- Gray & Livingston (1997) Gray, D. F., & Livingston, W. C. 1997, ApJ, 474, 802
- Hall et al. (2009) Hall, J. C., Henry, G. W., Lockwood, G. W., Skiff, B. A., & Saar, S. H. 2009, AJ, 138, 312
- Hawley & Pettersen (1991) Hawley, S. L., & Pettersen, B. R. 1991, ApJ, 378, 725
- Horne & Baliunas (1986) Horne, J. H., & Baliunas, S. L. 1986, ApJ, 302, 757
- Johns-Krull & Valenti (1996) Johns-Krull, C. M., & Valenti, J. A. 1996, ApJ, 459, L95+
- Linsky et al. (1995) Linsky, J. L., Wood, B. E., Brown, A., Giampapa, M. S., & Ambruster, C. 1995, ApJ, 455, 670
- Lockwood et al. (2007) Lockwood, G. W., Skiff, B. A., Henry, G. W., Henry, S., Radick, R. R., Baliunas, S. L., Donahue, R. A., & Soon, W. 2007, ApJS, 171, 260
- Mauas & Falchi (1994) Mauas, P. J. D., & Falchi, A. 1994, A&A, 281, 129
- Mauas & Falchi (1996) —. 1996, A&A, 310, 245
- Mauas et al. (1997) Mauas, P. J. D., Falchi, A., Pasquini, L., & Pallavicini, R. 1997, A&A, 326, 249
- Meunier & Delfosse (2009) Meunier, N., & Delfosse, X. 2009, A&A, 501, 1103
- Mochnacki & Zirin (1980) Mochnacki, S. W., & Zirin, H. 1980, ApJ, 239, L27
- Nakajima et al. (1995) Nakajima, T., Oppenheimer, B. R., Kulkarni, S. R., Golimowski, D. A., Matthews, K., & Durrance, S. T. 1995, Nature, 378, 463
- Pace & Pasquini (2004) Pace, G., & Pasquini, L. 2004, A&A, 426, 1021
- Parker (1955) Parker, E. N. 1955, ApJ, 122, 293
- Pojmanski (2002) Pojmanski, G. 2002, Acta Astronomica, 52, 397
- Pravdo & Shaklan (2009) Pravdo, S. H., & Shaklan, S. B. 2009, ApJ, 700, 623
- Radick et al. (1998) Radick, R. R., Lockwood, G. W., Skiff, B. A., & Baliunas, S. L. 1998, ApJS, 118, 239
- Reiners & Basri (2008) Reiners, A., & Basri, G. 2008, ApJ, 684, 1390
- Scargle (1982) Scargle, J. D. 1982, ApJ, 263, 835
- Vaughan et al. (1978) Vaughan, A. H., Preston, G. W., & Wilson, O. C. 1978, PASP, 90, 267
- Walkowicz & Hawley (2009) Walkowicz, L. M., & Hawley, S. L. 2009, AJ, 137, 3297
- West et al. (2008) West, A. A., Hawley, S. L., Bochanski, J. J., Covey, K. R., Reid, I. N., Dhital, S., Hilton, E. J., & Masuda, M. 2008, AJ, 135, 785