On the Origin of Ultraviolet Emission and the Accretion Model of Low-luminosity AGNs
Abstract
Low-luminosity active galactic nuclei (LLAGNs) are generally believed to be powered by an inner radiatively inefficient, advection-dominated accretion flow (ADAF), an outer truncated thin disk, and a jet. Maoz (2007) recently challenged this picture based on the observation that the strength of ultraviolet emission relative to the X-ray and radio bands does not depart from empirical trends defined by more luminous sources. He advocates that AGNs across all luminosities have essentially the same accretion and radiative processes, which in luminous sources are described by a standard optically thick, geometrically thin disk. We calculate ADAF models and demonstrate that they can successfully fit the observed spectral energy distributions of the LLAGNs in Maoz’s sample. Our model naturally accommodates the radio and X-ray emission, and the ultraviolet flux is well explained by a combination of the first-order Compton scattering in the ADAF, synchrotron emission in the jet, and black body emission in the truncated thin disk. It is premature to dismiss the ADAF model for LLAGNs. The UV data can be fit equally well using a standard thin disk, but an additional corona and jet would be required to account for the X-ray and radio emission. We argue that there are strong theoretical reasons to prefer the ADAF model over the thin disk scenario. We discuss testable predictions that can potentially discriminate between the two accretion models.
1 Introduction
Supermassive black holes (BHs) reside in the nuclei of most large galaxies. The luminosity of the nuclei of these galaxies spans at least 10 orders of magnitude, from the most active and luminous AGNs, to less active low-luminosity AGNs (LLAGNs), down to nearly quiescent systems such as our Galaxy. It is now well known that they are powered by gas accretion onto the supermassive BH.
Some of the most important information about the physics of AGNs comes from their spectral energy distribution (SED). The SEDs of luminous, unobscured AGNs are relatively straightforward to obtain. One of their most distinguishing features in the optical and ultraviolet (UV) bands is the “big blue bump”, which is conventionally interpreted as thermal emission arising from a standard optical thick, geometrically thin accretion disk (Shakura & Sunyaev 1973; Shields 1978; Malkan & Sargent 1982). By contrast, the intrinsic weakness of LLAGNs poses practical challenges to obtaining reliable data to construct their SEDs. Nevertheless, by now a sufficiently large number of LLAGNs have been adequately studied with multiwavelength observations (e.g., Ho 1999; M 81, Markoff et al. 2008; M 87, Di Matteo et al. 2003; NGC 3998, Ptak et al. 2004; NGC 4594, Pellegrini et al. 2003) to demonstrate that that their SEDs are markedly different from those of luminous AGNs. In addition to their low luminosity, other distinctive observational features of LLAGNs include: extremely low Eddington ratios, low inferred radiative efficiencies, the lack of the big blue bump, the weakness or lack of reflection features in the X-ray band, the narrowness of the iron K line, ubiquity of compact radio cores or jets, the frequent detection of double-peaked broad Balmer lines, and prevalence of low-ionization nebular conditions (e.g., Ho 1999, 2009; Ho et al. 2000; Terashima et al. 2002; Ptak et al. 2004; see Ho 2008 for a review). Compared to luminous AGNs, the dim emission in the UV band relative to the optical and X-ray bands leads to a steep optical-UV slope and tends to make these sources systematically “X-ray loud” (relative to the UV band).
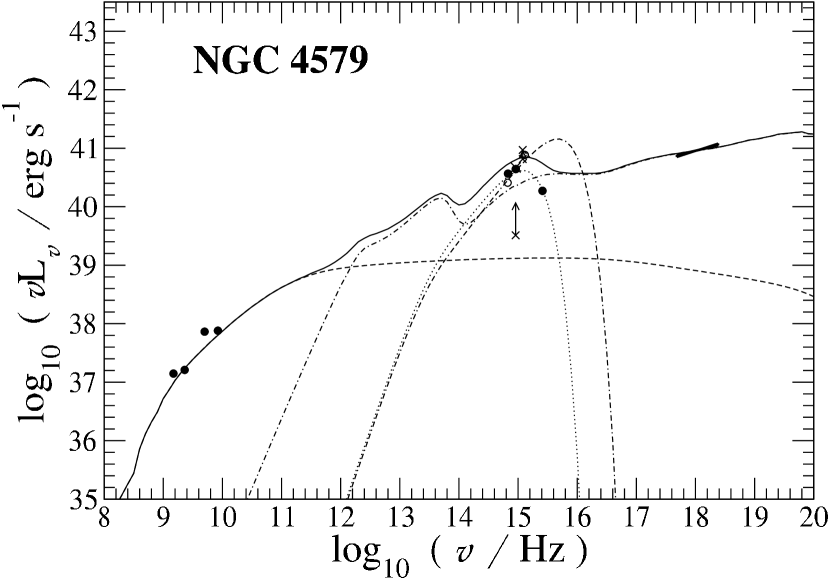
The lack of the big blue bump in LLAGNs indicates that the thin disk must be absent or truncated. Within the truncation radius, the accretion flow is believed to be replaced by an advection-dominated accretion flow (ADAF; Narayan & Yi 1994, 1995; Abramowicz et al. 1995; see Yuan 2007 for a review of observational evidence for the ADAF model of LLAGNs)111In addition to “ADAF”, another widely used term is “RIAF” (radiatively inefficient accretion flow; e.g., Quataert 2003; Yuan et al. 2003; Ho 2008). The reason for inventing this term is perhaps because it was realized that mass loss in the form of outflows plays an important role in reducing the radiative efficiency of this kind of accretion flow (see Section 2.2 of the present paper). However, detailed studies indicate that mass loss is not the dominant factor for the low efficiency. For example, the total radiative efficiency of Sgr A* is . Mass loss contributes about (since of the gas is lost in the outflow), while the remaining factor of is attributed to energy advection of electrons (see Yuan et al. 2003; Yuan 2007). Although direct electron heating is significant in an ADAF (i.e., ), most of the energy is stored in the electrons and advected into the black hole (Fig. 1 in Yuan 2006). For other LLAGNs, since is smaller than that in Sgr A*, the outflow loss is weaker and energy advection plays a relatively more important role for the low efficiency of the system.. Compared to the standard thin disk, the radiative efficiency of an ADAF is much lower. This explains why the luminosity of LLAGNs is so low even though there is a relatively large amount of gas available for fueling (Ho 2008, 2009). This picture is further strengthened by the narrowness of the iron K line, since the broad iron line is attributed to X-ray fluorescence off of a cold accretion disk extending to small radii (e.g., Nandra et al. 1997). The frequently detected double-peaked broad Balmer lines also require that the cool accretion disk must have a relatively large inner radius (Chen & Halpern 1989; Ho et al. 2000). Quataert et al. (1999) modeled the optical/UV spectra of M 81 and NGC 4579 and argued that they are better fit with a truncated thin disk than a standard thin disk extending to the innermost stable circular orbit222Using updated data, we reach a different conclusion regarding M 81 later in this paper.. Ptak et al. (2004) reached a similar conclusion based on the lack of any reflection feature in the X-ray spectrum of NGC 3998. In another well-studied LINER, NGC 1097, we can get the value of the truncation radius from fitting its double-peaked Balmer emission-line profile; this value is in good agreement with that required to fit its SED with a truncated thin disk model (Nemmen et al. 2006).
Further strong evidence for the ADAF plus truncated thin disk model comes from the study of the BH X-ray binary XTE J1118+480 in its low, hard state (Yuan et al. 2005). Except for the difference in BH mass, the hard state of BH X-ray binaries is widely believed to be physically similar to the conditions in LLAGNs. This source is special because it has an exceptional complete multiwaveband SED, especially in the EUV. To fit the EUV data clearly requires the thin disk to be truncated at (Chaty et al. 2003; Yuan et al. 2005). Furthermore, a quasi-periodic oscillation (QPO) with a frequency of Hz was detected in this source. As suggested by Giannios & Spruit (2004), the QPO can be excited by the interaction of the inner hot accretion flow and an outer thin disk. The QPOs then result from the basic -mode oscillations of the inner ADAF with a frequency roughly equal to the Keplerian frequency at the truncation radius. The Keplerian frequency at is Hz, which is roughly consistent with the observed QPO frequency of Hz.
Another distinguishing characteristic of LLAGNs is that they almost always contain compact radio cores, whose strength (relative to either the optical or X-rays) often formally qualifies them as being “radio-loud.” This is true not only of LINERs (Ho 1999, 2002, 2008; Terashima & Wilson 2003), but also of many lower luminosity Seyferts (Ho & Peng 2001). Generally the radio emission is too strong to be attributed to an ADAF and is more consistent with a jet origin (e.g., Ulvestad & Ho 2001; Anderson et al. 2004). This trend is again qualitatively consistent with the observed properties of X-ray binaries in their low state (e.g., Fender & Belloni 2004).
Maoz (2007; see also Pian et al. 2010) presents a different point of view. Using observations of 13 LLAGNs, focusing especially on data from the radio, UV, and X-ray bands, he shows that the UV/X-ray ratio (parameterized as the two-point spectral index ) of LLAGNs is similar to that of high-luminosity Seyfert galaxies, although LLAGNs generally lie below the extrapolation of the correlation between and UV luminosity defined by more luminous systems (e.g., Steffen et al. 2006). He asserts that there is no evidence for a change in SED shape in LLAGNs compared to luminous AGNs. His sample confirms the previous finding that LLAGNs tend to be radio-loud (defined via the radio/UV ratio), but he dismisses this as indicative that LLAGNs occupy a physically distinctive state compared to luminous sources, on the grounds that the AGN population as a whole shifts to greater radio dominance at lower luminosity or Eddington ratio (Ho 2002; Sikora et al. 2007). These two findings lead Maoz to conclude that LLAGNs do not form a distinct population compared to luminous AGNs and that the accretion flow in LLAGNs can still be described by a standard thin disk.
We disagree with the above conclusion because of the following reasons. First of all, it is hard to conclude that all AGNs must obey the same accretion flow model just because they follow similar empirical correlations. To date, we do not have a definitive accretion disk model that can self-consistently explain the origin of X-ray emission in luminous AGNs, and thus a rigorous explanation for the -luminosity correlation is still lacking. Secondly, even if we do attempt to constrain accretion models from these correlations, the fact that LLAGNs lie below the extrapolation established in high-luminosity AGNs can be interpreted as evidence that LLAGNs have a different accretion mode than luminous AGNs. The overall similarity of for AGNs of different luminosities and the roughly monotonic behavior of the -luminosity correlation do indicate that there is no dramatic discontinuity between the accretion modes of low- and high-luminosity sources. However, we should not be surprised by this result. Suppose that at some accretion rate luminous AGNs make a transition to LLAGNs. In the ADAF model of LLAGNs, the UV emission comes from the sum of the radiations of the truncated thin disk and the ADAF333The contribution of the jet can be neglected if the accretion rate is not too low.. Just after the transition the accretion rate of LLAGNs is still relatively high; thus, its efficiency is similar to that of a thin disk, and the truncation radius of the thin disk is small (Yuan & Narayan 2004). In this case, we do not expect the emission from the thin disk and ADAF to be that distinctive from that before transition. The main properties of the system (e.g., ) should remain roughly continuous during the transition. The observed trend of increasing radio output or jet power toward lower luminosity or Eddington ratio has no simple explanation within the context of the standard thin disk model. We simply remark that a number of theoretical studies suggest that the physical conditions of an ADAF may be more conducive to launching jets and outflows (Livio et al. 1999; Meier 2001; Narayan 2005).
The above arguments are still largely qualitative. To put them on a more quantitative footing, in this paper we calculate the emitted spectrum of ADAF model and compare it with the observed SEDs of the LLAGNs presented in Maoz (2007). The aim is to see whether the ADAF model can provide a reasonable explanation of the SEDs, especially in the UV band. We will show that the radio, UV, and X-ray emission of most sources can be reasonably reproduced in the ADAF model without deliberately adjusting the model parameters.
2 SED Modeling
2.1 Sample Constructions
We revisit the SEDs of the LLAGNs in the sample of Maoz (2007), except NGC 404 and NGC 3486, which, as explained by Maoz, may be significantly contaminated by emission from a central star cluster. The sample is summarized in Table 1. All of these 11 sources are UV-variable, and the variable UV flux provides a firm lower limit to the intrinsic AGN UV emission. All the sources in the sample have UV observations obtained with the Hubble Space Telescope (HST) in the F250W and F330W filters using the ACS/HRC (Maoz et al. 2005; Maoz 2007). Unresolved UV nuclei were found in all of these sources. To construct more complete SEDs, we collected additional UV data points, as well as data at radio and X-ray bands, from the literature (e.g., Ho 1999; Di Matteo et al. 2003; Ptak et al. 2004; L. C. Ho, in preparation) or from NED444http://nedwww.ipac.caltech.edu/. To mitigate contamination from the host galaxy, we were careful to choose only data observed at the highest possible angular resolution. In practice, this restricts our selection to interferometric data for the radio, HST for the UV, and Chandra and XMM-Newton for the X-rays. Where they overlap, and taking into consideration variability, the new, additional UV data show good general agreement with the UV data of Maoz et al. (2005).
2.2 The ADAF-jet model
We use the coupled ADAF-jet model to fit the SEDs of our sample. We only briefly describe the model here, the details of which can be found in Yuan et al. (2005, 2009). The accretion flow consists of two parts: an ADAF within a “truncation” radius and a truncated thin disk outside of . Both observations and theoretical studies indicate that the value of is a function of the accretion rate or luminosity (Liu et al. 1999; Meyer et al. 2000; Yuan & Narayan 2004). In this work, we set as a free parameter. It mainly determines the emitted spectrum of the truncated thin disk, while its effect on the ADAF is very small since the radiation of ADAF comes from the innermost region of the accretion flow. We find that the fitted values are roughly consistent with the correlation shown in Yuan & Narayan (2004; their Fig. 3). In the inner region of the accretion flow, a fraction of the material is assumed to be transferred into the vertical direction to form a jet. In the ADAF model, we parameterize the accretion rate with a parameter , defined such that , where is the accretion rate at . This is because simulations of both non-radiative (e.g., Igumenshchev & Abramowicz 1999; Stone et al. 1999) and strongly radiative (Yuan & Bu 2010) accretion flows indicate that hot accretion flows are strongly convectively unstable. As a result, only a fraction of the gas available at large radius actually accretes onto the BH, and the rest of the gas is lost into a convective outflow. Other parameters for calculating the global dynamical solution of ADAFs are the viscosity parameter , magnetic parameter , and , the fraction of the turbulent dissipation that directly heats the electrons. In most cases, we adopt their “typical” values widely used in the literature: , , , and , except that in a few cases we also try other values of , given the large uncertainty of the microphysics of direct electron heating (e.g., Sharma et al. 2007). This assumption is justified because we believe that these parameters should have the same values in various objects; they should be determined by the microphysics of the accretion flow or jet, which is usually independent of the accretion (or loss) rate and black hole mass. For example, numerical simulations of accretion flows with significantly different accretion rates show that the value of is identical (Stone et al. 1999; Yuan & Bu 2010). Holding these microphysics parameters fixed should not affect the qualitative features of our conclusions.
The radiation model of the jet is based on the internal shock scenario of gamma-ray burst afterglows (see Yuan et al. 2005 for details). Compared to the accretion flow, there are more uncertainties in the jet model. The main parameters include the mass loss rate , the half-opening angle , the bulk Lorentz factor , the power-law index of the accelerated relativistic electrons in the jet, and the fraction of the shock energy that enters into the electrons and magnetic field, and . Throughout this paper we adopt “typical” values of and , so they are not free parameters. All other parameters are treated to be free, although some theoretical constraints are expected. For example, shock acceleration theory typically gives . However, there is still some uncertainty in our understanding of shock acceleration, and, more generally, the acceleration mechanism of electrons in jets. For instance, magnetic reconnection may be another relevant mechanism in addition to shocks. Thus, we also try values of . Medvedev (2006) showed that electron acceleration in relativistic shocks should roughly follow .
The three components in our model are coupled, and thus their parameters are not completely free but related with each other. The ADAF and the truncated thin disk are connected at , and the accretion rates of the two components at must be identical (i.e., ). The mass loss rate in the jet must be a reasonable fraction of the mass accretion rate of the ADAF in the inner region where the jet is launched; there are large theoretical uncertainties involved, but typical values generally lie in the range . Moreover, the minimum Lorentz factor of the accelerated electrons in the jet, which is an important parameter affecting the radiation of the jet, is also partly constrained by the electron temperature of the ADAF.
The process of our modeling is as follows. We first guess the value of the two free parameters of the ADAF compoment, and . Note that these two parameters are not completely free, as explained above. Combined with the other model parameters (e.g., black hole mass, , etc.), we solve the radiation hydrodynamical equations of an ADAF to get the global solution. This yields all dynamical quantities of the system, such as density, temperature, and magnetic field. We then calculate the radiative transfer to obtain the emitted spectrum. Using and , the spectrum emitted from the truncated thin disk can be easily computed. The radiation of the jet can be obtained once the values of , , , and are given. From the discussion in the last paragraph, we know that must satisfy some general constraints. We then sum the radiation from the the ADAF, the truncated thin disk, and the jet, and compare the result with the observed multi-waveband spectrum. We adjust the parameters so that their sum can fit the overall spectrum satisfactorily, ranging from radio, optical, UV, to X-rays.
We do not perform any rigorous statistical analysis to test the goodness of fit, nor are fits themselves always unique. The primary reason is technical. Because of the great difficulty in obtaining a transonic global solution of an ADAF, it would be very time-consuming, if not impossible, to do a complete parameter survey for every object. Our aim is not to explore the full allowed parameter space of ADAF-jet-disk models, but rather to find one such model for each object that is roughly consistent with its data. We judge the goodness of the fit simply by “eye.” For the problem at hand, we think that it is physically not appropriate to perform a rigorous comparison between the theoretical prediction and the observational data. As in most other theoretical models, all three components of our model have large and hard-to-quantify uncertainties, since many simplifications and approximations have to be adopted. Under these circumstances, the results of any rigorous quantitative statistical analysis will be completely meaningless. Given the approximate nature of the model, the comparison between theoretical prediction and data is, by necessity at this point, semi-subjective.
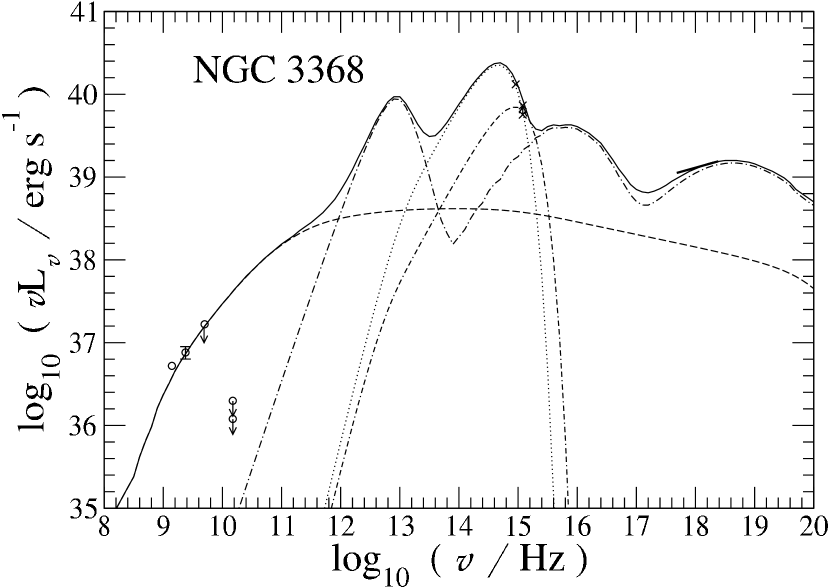
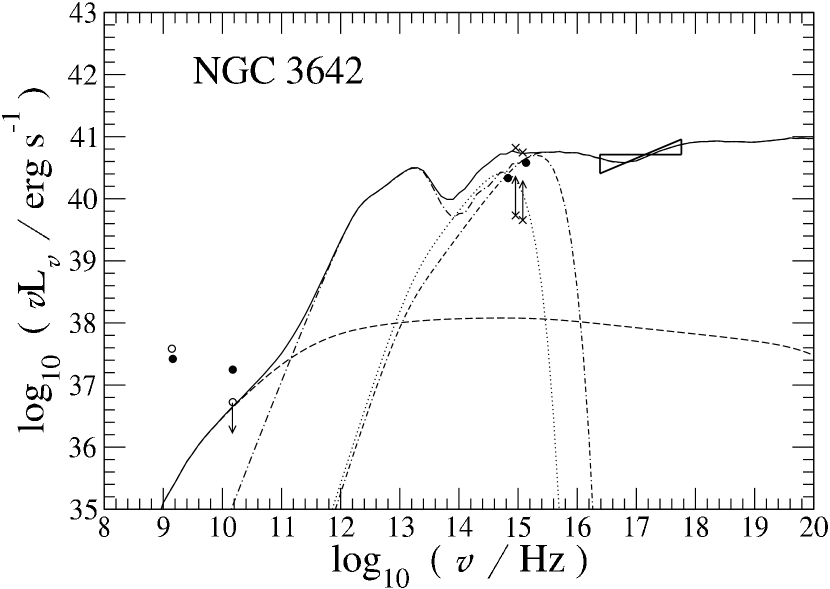
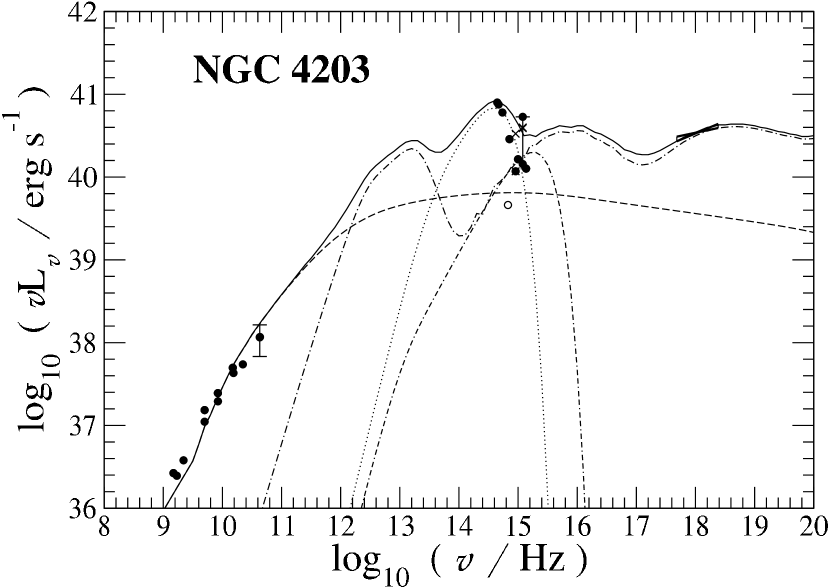
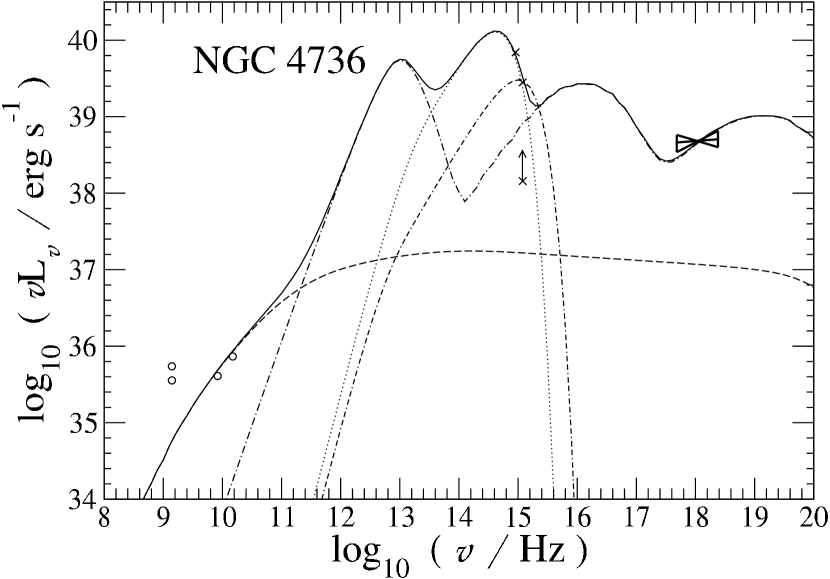
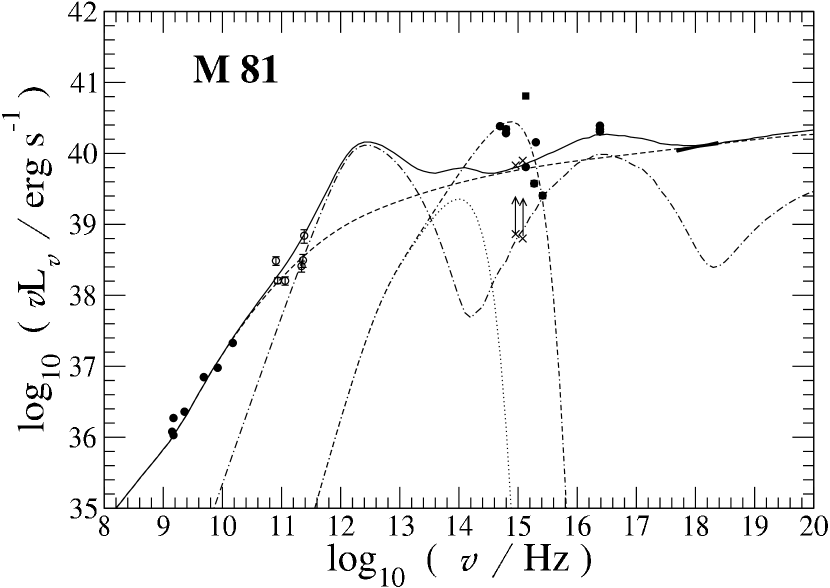
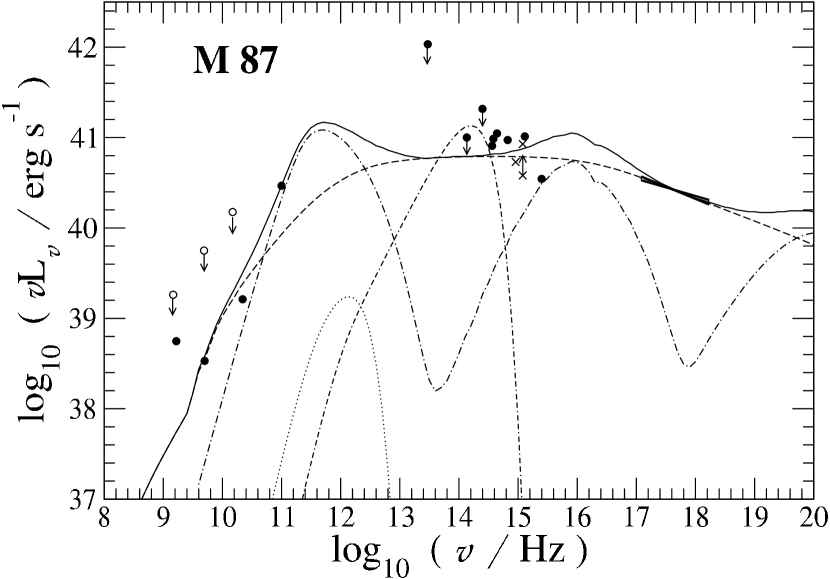
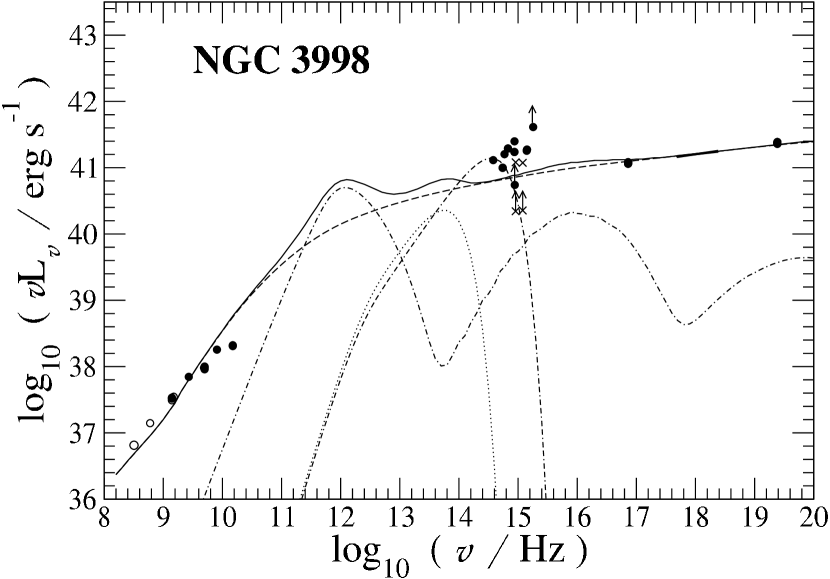
It is worth emphasizing that this is not an easy task, and the flexibility of the model is actually not large. For example, for the sources presented in Figure 1, the X-ray spectrum is dominated by the ADAF. It is rather challenging to fit both the normalization and the shape of the spectrum while not violating the data at other spectral bands using only one parameter (). Thus, a successful fit of the X-ray spectrum by the ADAF component is a nontrivial task. For the sources presented in Figure 2, the contribution of the ADAF to the X-ray spectrum is negligible. If we increase , the model will overpredict the radio flux. For the jet component, we have four free parameters. Their values are well constrained by fitting the radio spectrum, and we have little room to adjust the contribution of the jet in the optical, UV, and X-ray bands. Regarding the truncated thin disk component, we do have some freedom on the value of , although not so much since its value is correlated with . But the value of only determines where the spectrum emitted by the truncated thin disk is cut off.
2.3 Results
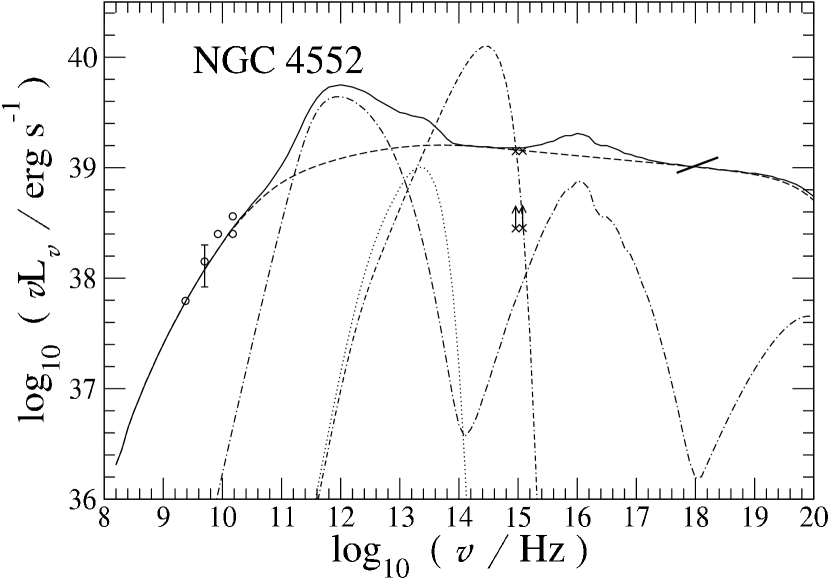
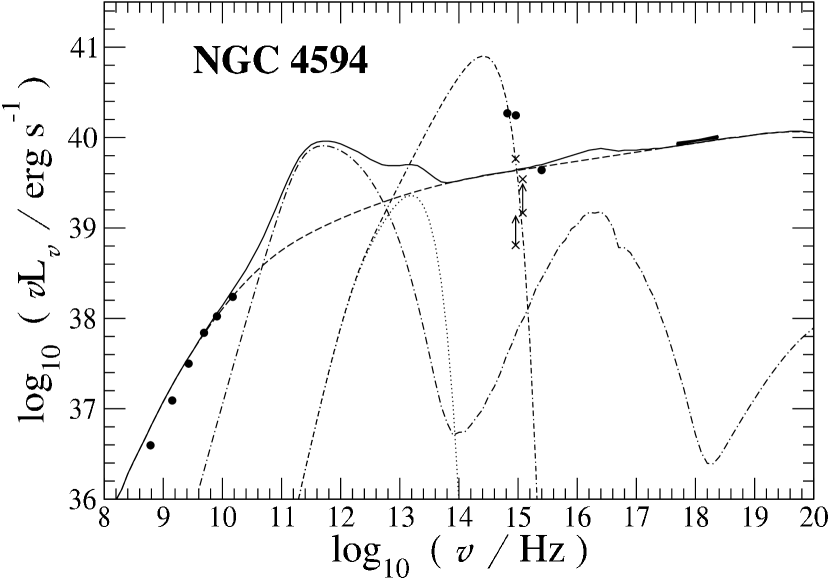
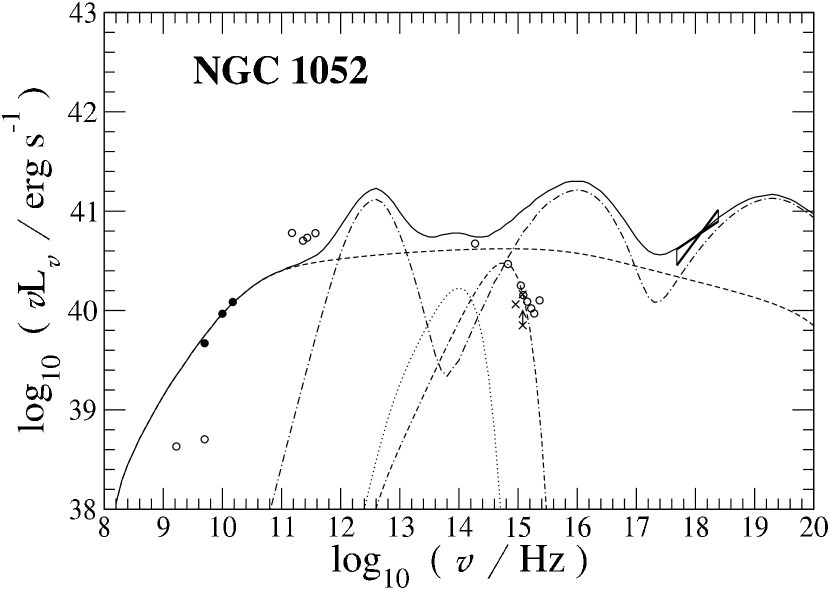
We fit the radio to X-ray spectrum of all sources in the sample using the coupled ADAF-jet model. The results are shown in Figures 1–3, and the adopted parameters of each source are listed in Table 1. The main results are as follows.
First, with the exception of one object (NGC 1052), the model can successfully fit the SEDs of these sources ranging from the radio to the hard X-rays. In particular, the model fits the UV flux reasonably well. We want to point out that since the values of the free parameters in our model have almost been fixed when fitting the spectrum in the radio and X-ray bands, there is little room for us to adjust them to fit the UV data points. One interesting result is that for most sources in our sample the UV and X-rays have the same origin, usually the jet component. From Table 1 we see that the values of the model parameter for the power-law index of the relativistic electrons are all in their “reasonable” range, and that the relation between and follows the trend suggested by Medvedev (2006). The values of other parameters are also “typical.” Exceptions are NGC 3368 and NGC 4736, where we have to adopt smaller values of and 0.01, respectively. We note in this context that large uncertainties exist in the value of (Sharma et al. 2007). The non-standard value of in these two sources could also be because the values of some parameters such as and we fix in the model change from source to source. In summary, the overall good fitting results implies that, the UV emission of all these sources generally can be well fitted by the emission from the ADAF-jet model. The one exception is NGC 1052, whose predicted UV flux is much higher than observed (Fig. 3). We note that the ratio of UV to X-ray flux of this source is very small, actually the smallest in our sample. This source is also very radio-loud, with a value for its radio-loudness parameter as large as (Maoz 2007). The UV flux adopted by Maoz et al. (2005) at 2500 Å and 3300 Å was observed only once by HST in 2002, which was only roughly half the flux observed in 1997 by Gabel et al. (2000). Maoz et al. (2005) concluded that the factor of 2 variation was real, and that this meant that the UV flux of the nucleus contains a significant AGN contribution.
Yuan & Cui (2005) predicted that the X-ray emission of the system should be dominated by the jet rather than by the ADAF when the X-ray luminosity in the 2–10 keV band, , is lower than a critical value :
| (1) |
This is because the X-ray emission from the ADAF is roughly proportional to , whereas the synchrotron emission from the jet is proportional to or . Hence, as decreases below a certain threshold, the synchrotron emission from the jet will finally dominate the X-ray emission. This prediction has been recently confirmed convincingly by modeling 16 LLAGNs with good radio and X-ray spectra (Yuan, Yu & Ho 2009). Here we can see from Figures 1 and 2 that the current modeling results further confirm it. Eight out of the 10 sources in our sample with hard X-ray data555NGC 3652 has no data in the 2–10 keV band. are consistent with the prediction of Yuan & Cui (2005). The exceptions are M 81 and NGC 3998, which, despite having , are dominated by jets. However, as pointed out in Yuan et al. (2009), the correlation is correct only in statistical sense, and thus some outliers are not unexpected.
Regarding the spectrum in the UV, we note that for most sources, because the data are quite heterogeneous and span a narrow range of frequency, the uncertainty of the continuum shape is large. Given this situation, we regard the overall match between data and model to be satisfactory.
As a comparison, we have also tried to fit the UV spectrum of each source with a standard thin disk model with the inner edge located at the innermost stable circular orbit. We adjust the accretion rate to fit the UV data. The results are shown by the dot-dashed-dashed line in each panel of the figures; the parameters of the fit are listed in Table 1. For most sources, the goodness of the fit is similar to the ADAF model. Compared to the ADAF model, for NGC 4552 and especially M 87, the standard thin disk fit is clearly worse. By contrast, for M 81 and NGC 1052, the fit for the standard thin disk actually looks better; the emission from the jet and ADAF seems to overpredict the UV flux. We note that this is also the case for the pure jet model of Markoff et al. (2008) for M 81. The UV flux falls far below the X-ray flux. Such a large X-ray/UV ratio is also hard to be explained in the framework of the “disk-corona” scenario, as we explain in the following paragraph. One possible culprit is inadequate correction for intrinsic absorption, although no strong evidence for internal reddening is seen in the analysis of the UV spectrum by Ho et al. (1996). Alternatively, the X-ray emission of these two sources does not originate from a jet or “standard” ADAF, but from a “modified” ADAF in which there are some cool clumps embedded in the hot flow. The black body radiation of the cool clumps explains the origin of the UV, while the Compton scattering of these UV photons produces the X-ray emission.
Although a standard thin disk can account for the UV emission in M 81 and NGC 1052, it cannot, as is well known for AGNs in general, explain the X-ray emission. The UV emission in M 81 represents the X-ray luminosity; in NGC 1052, it is only . If we adopt a disk-corona model (e.g., Haardt & Maraschi 1991), we have to require that most of the gravitational energy be dissipated in the corona rather than in the disk. This is the case for most sources in our sample. From Table 1 (Col. 15) we can see that the UV luminosity is on average only of the bolometric luminosity of each source. This is hard to understand theoretically. While most disk-corona models so far are only phenomenological (e.g., Haardt & Maraschi 1991; Svensson & Zdziarski 1994), recent three-dimensional radiation magneto-hydrodynamical simulations of the vertical structure of a local patch of a standard thin accretion disk shows that most of the dissipation occurs in the midplane of the disk, with very little dissipation in the corona (Hirose et al. 2006; Blaes 2007). This simulation result may not be the final answer to the question, but it is in good agreement with the observations of the high state of BH X-ray binaries. The standard model for the high state is a standard thin disk (Zdziarski & Gierliński 2004; Done et al. 2007), which is well fitted by a multi-temperature black body spectrum, with very weak hard X-ray emission. On the other hand, even if enough dissipation can occur in the corona to generate the requisite high X-ray/UV ratios, the structure and emitted spectrum of the underlying thin disk would be violently changed compared to the standard thin disk, and it is unclear whether in that case the model can still fit the UV spectrum.
3 Summary and Discussion
The accretion flow in LLAGNs is believed to be described by an ADAF, which is different from the standard thin disk invoked for luminous AGNs. Maoz (2007) disagrees. Using new UV observations of a sample of 13 LLAGNs, he shows that their X-ray/UV and radio/UV ratios are similar to those of more powerful sources. Because of this, he maintains that AGNs across all luminosities have essentally the same accretion and radiative processes.
In this paper, we fit the SEDs of Maoz’s sample using a model consisting of an accretion flow described by central ADAF within a truncation radius plus a thin disk outside of this radius. In the innermost region a jet is included. We find that for almost all sources in our sample, our model can give a good fit to the SED ranging from radio, optical/UV, to X-rays, without the need of a standard thin disk extending to the innermost stable circular orbit. We would like to emphasize that the free parameters in our model are almost completely fixed by the radio and X-ray data. In other words, we have almost no room to adjust model parameters to fit the UV data. This result strongly demonstrates that the apparent similarity of the SEDs of low- and high-luminosity AGNs cannot rule out the ADAF model.
We have also tried to fit the UV data using the standard thin disk model alone. Compared to the ADAF fitting result, the goodness of the standard thin disk model fitting is similar; two sources seem to be better fitted, while two are worse. As is well known, the standard thin disk model can only fit the UV. To explain other data, such as the radio and X-rays, in the framework of the standard thin disk, two additional components, namely a jet and a corona, are required. This situation is similar to the ADAF model where three components are also required. The ADAF model is superior to the thin disk scenario because of the following reasons. First, the dynamics of an ADAF are better understood than those in the disk-corona model. The latter contains many more theoretical uncertainties, such as the main heating mechanism of the corona and the physics of magnetic reconnection. Second, theoretical studies indicate that a jet — a near-ubiquitous component observed in LLAGNs and X-ray binaries in their low-state — arises much more naturally in an ADAF than in a thin disk. Third, although it is in principle possible to produce the X-ray spectrum by a disk-corona model, it is questionable whether enough gravitational energy can be dissipated in the corona to account for the typically low UV/X-ray flux ratios that characterize LLAGNs. Currently the most serious attempts to address this question comes from three-dimensional magneto-hydrodynamical simulations of a patchy disk. The result shows that little dissipation occurs in the corona. On the other hand, even if most of the energy were dissipated in the corona the emitted spectrum from the thin disk in this case would be quite different from that of a pure standard thin disk, and it is questionable whether such a “modified” thin disk can still explain the UV spectrum. In fact, observations of the high/soft state of black hole X-ray binaries, which are widely believed to be powered by a standard thin disk, support the above two arguments, namely that the thin disk launches no jet and produces extremely weak X-ray emission. Lastly, the SED is only one of several characteristics of LLAGNs that needs to be explained. As discussed in the Introduction, LLAGNs possess a set of other distinctive properties, and any successful model should try to simultaneously account for them all. As outlined in Ho (2008), a three-component central engine consisting of an ADAF, a truncated thin disk, and a jet provides a promising, observationally and physically well-motivated framework for understanding LLAGNs.
We propose a set of diagnostics that can distinguish the origin of the UV emission. 1) Since the UV radiation in the ADAF model comes from the combination of an inner hot flow, a truncated thin disk, and a jet, in general we do not expect a blackbody-like bump in the optical/UV band, as predicted by a standard thin disk. So it will be useful to have reliable, broader wavelength coverage across the SED, especially over the near-infrared, optical, and UV bands. The current spectral range is too narrow and the data too heterogeneous to constrain models. 2) The emission from the standard thin disk is very steady. This is evidenced by the very weak variability of the soft state of BH X-ray binaries in which a thin disk is believed to be present. By contrast, the variability from an ADAF is expected to be stronger (Manmoto et al. 1996; Igumenshchev & Abramowicz 1999). So we predict that UV variability should be significant and correlated with X-ray emission. 3) When the source is very dim, with as defined in Equation (1), the UV spectrum is dominated by the synchrotron emission of the jet. In this case, we expect the UV spectrum to be similar to that in the X-rays. If described by a power-law, , we expect if the relativistic electrons in the jet are accelerated by shocks. 4) In this case, we also expect a high level of linear polarization in the UV band; the magnitude and angle of the polarization should be similar to those in the X-ray band.
| Object | Ref. | (∘) | log | |||||||||||||
|---|---|---|---|---|---|---|---|---|---|---|---|---|---|---|---|---|
| (1) | (2) | (3) | (4) | (5) | (6) | (7) | (8) | (9) | (10) | (11) | (12) | (13) | (14) | (15) | ||
| M 81 | 100. | 5,6,8,11 | 10 | 25 | 0.25 | 0.02 | 1.8 | -0.54 | ||||||||
| M 87 | 1,5,13 | 70 | 19 | 0.2 | 0.02 | 2.5 | -0.77 | |||||||||
| NGC 1052 | 75. | 5 | 10 | 60 | 0.2 | 0.02 | 2.3 | -1.37 | ||||||||
| NGC 3368 | 40. | 5 | 10 | 60 | 0.1 | 0.01 | 2.3 | -0.36 | ||||||||
| NGC 3642 | 60. | … | 4,5 | 10 | 60 | 0.2 | 0.02 | 2.2 | -0.94 | |||||||
| NGC 3998 | 100. | 5,7,10 | 10 | 20 | 0.2 | 0.02 | 1.8 | -0.94 | ||||||||
| NGC 4203 | 250. | 5,12 | 10 | 25 | 0.1 | 0.02 | 2.2 | -1.04 | ||||||||
| NGC 4552 | 300. | 5 | 10 | 60 | 0.15 | 0.01 | 2.1 | -0.04 | ||||||||
| NGC 4579 | 50. | 2,5,12 | 10 | 60 | 0.2 | 0.01 | 2.3 | -0.59 | ||||||||
| NGC 4594 | 300. | 2,3,5,9 | 10 | 45 | 0.3 | 0.02 | 1.8 | -0.16 | ||||||||
| NGC 4736 | 75. | 5 | 10 | 60 | 0.1 | 0.01 | 2.1 | -0.37 |
Note. — Col. (1): Name of object. Col. (2): Mass of the BH. Col. (3): Truncation radius. Col. (4): Luminosity in the 2–10 keV band. Col. (5) The critical luminosity from Equation (1). Col. (6): References from which part of the observational data come from. Col. (7): Mass accretion rate extrapolated from . Col. (8): Mass lost rate in the jet. Col. (9): Lorentz factor of the jet. Col. (10): Viewing angle of the jet. Col. (11): Fraction of shock energy entering into electrons. Col. (12): Fraction of shock energy entering into magnetic field. Col. (13): Spectral index of power-law electrons. Col. (14): Accretion rate of the standard thin disk extending to the innermost stable circular orbit. Col. (15): Ratio between the luminosity of the standard thin disk and the bolometric luminosity.
References. — (1) Evans et al. 2006; (2) Ho 1999; (3) Hummel et al. 1984; (4) Komossa et al. 1999; (5) Maoz 2007; (6) Markoff et al. 2008; (7) Pellegrini et al. 2000b; (8) Pellegrini et al. 2000a; (9) Pellegrini et al. 2003; (10) Ptak et al. 2004; (11) Schödel et al. 2007; (12) Terashima et al. 2002; (13) Wilson & Yang 2002.
References
- (1) Abramowicz, M. A., Chen, X., Kato, S., Lasota, J. P., & Regev, O. 1995, ApJ, 438, L37
- (2) Anderson, J. M., Ulvestad, J. S., & Ho, L. C. 2004, ApJ, 603, 42
- (3) Blaes, O. 2007, in The Central Engine of Active Galactic Nuclei, ed. L. C. Ho & J.-M. Wang (San Francisco: ASP), 75
- (4) Chaty, S., Haswell, C. A., Malzac, J., Hynes, R. I., Shrader, C. R., & Cui, W. 2003, MNRAS, 346, 689
- (5) Chen, K., & Halpern, J. P. 1989, ApJ, 344, 115
- (6) Di Matteo, T., Allen, S. W., Fabian, A. C., Wilson, A. S., & Young, A. J. 2003, ApJ, 582, 133
- (7) Done, C., Gierliński M., & Kubota, A. 2007, A&ARv, 15, 1D
- (8) Evans, D. A., Worrall, D. M., Hardcastle, M. J., Kraft, R. P., & Birkinshaw, M. 2006, ApJ, 642, 96
- (9) Fender, R. P., & Belloni, T. 2004, ARA&A, 42, 317
- (10) Gabel, J. R., Bruhweiler, F. C., Crenshaw, D. W., Kraemer, S. B., & Miskey, C. L. 2000, ApJ, 532, 883
- (11) Giannios, D., & Spruit, H. C. 2004, A&A, 427, 251
- (12) Haardt, F., & Maraschi, L. 1991, ApJ, 380, 51
- (13) Hirose, S., Krolik, J., & Stone, J. M. 2006, ApJ, 640, 901
- (14) Ho, L. C. 1999, ApJ, 516, 672
- (15) Ho, L. C. 2002, ApJ, 564, 120
- (16) Ho, L. C. 2008, ARA&A, 46, 475
- (17) Ho, L. C. 2009, ApJ, 699, 626
- (18) Ho, L. C., Filippenko, A. V., & Sargent, W. L. W. 1996, ApJ, 462, 183
- (19) Ho, L. C., & Peng, C. Y. 2001, ApJ, 555, 650
- (20) Ho, L. C., Rudnick, G., Rix, H.-W., Shields, J. C., McIntosh, D. H., Filippenko, A. V., Sargent, W. L. W., & Eracleous, M. 2000, ApJ, 541, 120
- (21) Hummel, E., van der Hulst, J. M., & Dickey, J. M. 1984, A&A, 134, 207
- (22) Igumenshchev, I. V., & Abramowicz, M. 1999, MNRAS, 303, 309
- (23) Komossa, S., Böhringer, H., & Huchra, J. 1999, A&A, 349, 88
- (24) Liu, B., Yuan, W., Meyer, F., Meyer-Hofmeister, E., & Xie, G. Z. 1999, ApJ, 527, L17
- (25) Livio, M., Ogilvie, G. I., & Pringle, J. E. 1999, ApJ, 512, 100
- (26) Malkan, M. A., & Sargent, W. L. W. 1982, ApJ, 254, 22
- (27) Manmoto, T., Takeuchi, M., Mineshige, S., Matsumoto, R., & Negoro, H. 1996, ApJ, 464, L135
- (28) Maoz, D. 2007, MNRAS, 377, 1696
- (29) Maoz, D., Nagar, N. M., Falcke, H., & Wilson, A. S. 2005, ApJ, 625, 699
- (30) Markoff, S., et al. 2008, ApJ, 681, 905
- (31) Medvedev, M. V. 2006, ApJ, 651, L9
- (32) Meier, D. L. 2001, ApJ, 548, L9
- (33) Meyer, F., Liu, B. F., & Meyer-Hofmeister, E. 2000, A&A, 354, L67
- (34) Nandra, K., George, I. M., Mushotzky, R. F., Turner, T. J., & Yaqoob, T. 1997, ApJ, 477, 602
- (35) Narayan, R. 2005, ApS&S, 300, 177
- (36) Narayan, R., & Yi, I. 1994, ApJ, 428, L13
- (37) Narayan, R., & Yi, I. 1995, ApJ, 444, 231
- (38) Nemmen, R. S., Storchi-Bergmann, T., Yuan, F., Eracleous, M., Terashima, Y., & Wilson, A. S. 2006, ApJ, 643, 652
- (39) Pellegrini, S., Baldi, A., Fabbiano, G., & Kim, D.-W. 2003, ApJ, 597, 175
- (40) Pellegrini, S., Cappi, M., Bassani, L., Della Ceca, R. & Palumbo, G. G. C. 2000a, A&A, 360, 878
- (41) Pellegrini, S., Cappi, M., Bassani, L., Malaguti, G., Palumbo, G. G. C., & Persic, M. 2000b, A&A, 353, 447
- (42) Pian, E., Romano, P., Maoz, D., Cucchiara, A., Pagani, C., & La Parola, V. 2010, MNRAS, 401, 677
- (43) Ptak, A., Terashima, Y., Ho, L. C., & Quataert, E. 2004, ApJ, 606, 173
- (44) Quataert, E. 2003, Astronomische Nachrichten, Supplementary Issue 1, 435
- (45) Quataert, E., Di Matteo, T., Narayan, R., & Ho, L. C. 1999, ApJ, 525, L89
- (46) Schödel, R., Krips, M., Markoff, S., Neri, R., & Eckart, A. 2007, A&A, 463, 551
- (47) Shakura, N. I., & Sunyaev, R. A. 1973, A&A, 24, 337
- (48) Sharma, P., Quataert, E., Hammett, G. W., & Stone, J. M. 2007, ApJ, 667, 714
- (49) Sharma, P., Quataert, E., & Stone, J. M. 2007, ApJ, 671, 1696
- (50) Shields, G. A. 1978, Nature, 272, 706
- (51) Sikora, M., Stawarz, L., & Lasota, J.-P. 2007, ApJ, 658, 815
- (52) Steffen, A. T., et al. 2006, AJ, 131, 2826
- (53) Stone, J. M., Pringle, J. E., & Begelman, M. C. 1999, MNRAS, 310, 1002
- (54) Svensson, R., & Zdziarski, A.A. 1994, ApJ, 436, 599
- (55) Terashima, Y., Iyomoto, N., Ho, L. C., & Ptak, A. F. 2002, ApJS, 139, 1
- (56) Terashima, Y., & Wilson, A. S. 2003, ApJ, 583, 145
- (57) Ulvestad, J. S., & Ho, L. C. 2001, ApJ, 562, L133
- (58) Wilson, A. S., & Yang, Y. 2002, ApJ, 586, 133
- (59) Yuan, F. 2006, Journal of Physics: Conference Series, Volume 54, Proceedings of The Universe Under the Microscope - Astrophysics at High Angular Resolution, ed. Rainer Schoedel, Andreas Eckart, Susanne Pfalzner and Eduardo Ros, 427
- (60) Yuan, F. 2007, in The Central Engine of Active Galactic Nuclei, ed. L. C. Ho & J.-M. Wang (San Francisco: ASP), 95
- (61) Yuan, F., & Bu, D. 2010, MNRAS, 408, 1051
- (62) Yuan, F., & Cui, W. 2005, ApJ, 629, 408
- (63) Yuan, F., Cui, W., & Narayan, R. 2005, ApJ, 620, 905
- (64) Yuan, F., Quataert, E., & Narayan, R. 2003, ApJ, 598, 301
- (65) Yuan, F., & Narayan, R. 2004, ApJ, 612, 724
- (66) Yuan, F., Yu, Z., & Ho, L. C. 2009, ApJ, 703, 1034
- (67) Zdziarski, A. A., & Gierliński, M. 2004, PThPS, 155, 99