SDSS-III/APOGEE: Detailed Abundances of Galactic Star Clusters
Abstract
The Sloan Digital Sky Survey III/Apache Point Observatory Galactic Evolution Experiment (SDSS-III/APOGEE) is a large-scale spectroscopic survey of Galactic stars and star clusters. The SDSS-III/APOGEE survey is designed to produce high-, 27,500–31,000 spectra that cover a wavelength range of 1.51 to 1.68 microns. By utilizing APOGEE’s excellent kinematics (error 0.5 km s-1) and abundances (errors 0.1 dex), we will be able to study star cluster kinematics and chemical properties in detail. Over the course of the 3-year survey beginning in 2011, APOGEE will target 25–30 key open and globular clusters. In addition, the large area coverage of the SDSS focal plane will also allow us to target stars in 100–200 additional star clusters during the main survey observations. We present the strength of APOGEE for both open and globular star cluster studies and the methods of identifying probable clusters members utilizing 2MASS and IRAC/WISE data.
1 Introduction
Star clusters represent a key tracer for the dynamical and chemical evolution of galaxies. The one galaxy for which we can investigate in detail is our own Milky Way galaxy. While there have been wide ranging studies of Galactic star clusters, there remains a key problem with studying Galactic evolution: lack of large uniform samples. For photometric studies, this is starting to be possible with large-area surveys (e.g., 2MASS, SDSS-I, VVV, Skymapper, LSST). Large kinematic samples have begun to be derived utilizing proper motions (e.g., glush ; baum ; dias01 ; dias02 ; dias06 ) and radial velocities (e.g., pm08 ). However, high-resolution spectroscopy studies, yielding high accuracy radial velocities and detailed chemical abundances, are still limited to small sets of clusters111High-resolution studies of up to ten open clusters are starting to be published using CTIO/WIYN Hydra (e.g., jacobson09 ; friel10 ) and VLT/Flames+UVES (e.g., sestito06 ; bragaglia08 ; sestito08 ). The soon to be commissioned Sloan Digital Sky Survey III/Apache Point Observatory Galactic Evolution Experiment (SDSS-III/APOGEE) will provide for uniform data and analysis for a survey of up to 200 star clusters.
2 SDSS-III/APOGEE
The SDSS-III/APOGEE project is three-year high-resolution spectroscopic survey that will cover all major Galactic populations (thin disk, thick disk, bulge/bar, and halo). The project utilizes a new 300-fiber-fed -band (1.51 to 1.68 m) spectrograph apogeeinst . The spectrograph will yield = 27,500-31,000 spectra with per pixel for stars with . The goal of the survey is to derive precision radial velocities ( km s-1) and abundances ( dex) for stars. The survey has planned to study 15 different elements (including Fe, C, N, O, -elements, odd- elements, iron peak elements, possibly even neutron capture). The survey will coordinate observations with another SDSS-III survey, the Multi-object APO Radial Velocity Exoplanet Large-area Survey (SDSS-III/MARVELS) survey, which will necessitate that 75% of the observing time be spent in 58 key fields (which contain 60 star clusters). The total APOGEE survey plans to target 220–230 unique field centers covering deg2 of the sky.
2.1 APOGEE Calibration Clusters
One area of APOGEE science and calibration is the study of key star clusters listed in Table 2.1, with parameters taken from Harris catalog harris for globular clusters and the Dias catalog diascat for the open clusters. These key clusters will have at least one 7 deg2 plate configuration, up to 250 fibers, dedicated to likely cluster member stars. For some of the open clusters (e.g., M67, NGC 188, NGC 6819) we have kinematic membership and binary information available from the WIYN Open Cluster Study (WOCS; mathieu ; geller ; hole )
We will explicitly target many stars which have already been observed at high resolution () in the optical or near infrared to be used to compare SDSS-III/APOGEE to other high-resolution studies. For these “calibration” cluster targets, we will obtain large numbers of members that will be used to fully characterize the clusters bulk chemical properties, but also allow science ranging for looking for abundance variations on the individual element level to investigating isotopic abundance variations as keys to understanding evolution along the red giant branch.
| Name | Type | Diam | [Fe/H] | Age (Yr) | Log(Age) | Dist(pc) | ||||||||
|---|---|---|---|---|---|---|---|---|---|---|---|---|---|---|
| \svhline NGC 188 | Open Cl | 17’ | -0.01 | 0.09 | 4.2 Gyr | 9.632 | 2047 | |||||||
| Pleiades | Open Cl | 110’ | -0.03 | 0.06 | 135 Myr | 8.131 | 150 | |||||||
| Hyades | M45 | Open Cl | 330’ | +0.13 | 0.06 | 787 Myr | 8.896 | 45 | ||||||
| NGC 2168 | M35 | Open Cl | 25’ | -0.16 | 0.09 | 95 Myr | 7.979 | 816 | ||||||
| NGC 2243 | Open Cl | 5’ | -0.49 | 0.05 | 1.1 Gyr | 9.032 | 4458 | |||||||
| Melotte 71 | Open Cl | 7’ | -0.30 | 0.06 | 235 Myr | 8.371 | 3154 | |||||||
| NGC 2420 | Open Cl | 5’ | -0.40 | 2.8 Gyr | 9.45 | 2290 | ||||||||
| NGC 2682 | M67 | Open Cl | 25’ | -0.15 | 0.05 | 2.5 Gyr | 9.409 | 908 | ||||||
| NGC 6171 | M107 | Globular | 17’ | -0.90 | 0.10 | GC | GC | 6400 | ||||||
| NGC 6205 | M13 | Globular | 25’ | -1.51 | 0.10 | GC | GC | 7700 | ||||||
| IC 4725 | M25 | Open Cl | 29’ | +0.17 | 0.06 | 92 Myr | 7.965 | 620 | ||||||
| NGC 6791 | Open Cl | 10’ | +0.35 | 0.02 | 4.4 Gyr | 9.643 | 5853 | |||||||
| NGC 6819 | Open Cl | 5’ | +0.07 | 3.1 Gyr | 9.490 | 2360 | ||||||||
| NGC 6838 | M71 | Globular | 9’ | -0.79 | 0.10 | GC | GC | 6700 | ||||||
| NGC 7078 | M15 | Globular | 21’ | -2.20 | 0.10 | GC | GC | 10300 | ||||||
| NGC 7089 | M2 | Globular | 21’ | -1.62 | GC | GC | 11500 | |||||||
| NGC 7789 | Open Cl | 25’ | -0.20 | 1.7 Gyr | 9.230 | 1820 |
3 APOGEE Candidate Cluster Analysis
3.1 Photometry Analysis
The only all-sky photometry that will be available for APOGEE targeting will come from two sources Two-Micron All-Sky Survey (2MASS ; 2mass ) and the soon to be released Wide-field Infrared Survey Explorer (WISE; wise ) mission. However, since many of the targets will be in the Galactic midplane, and WISE has poor resolution ( arcsec), we will also supplement our data set with Spitzer/IRAC Galactic Legacy Infrared Mid-Plane Survey Extraordinaire (GLIMPSE I, II, 3D, 360; glimpse ) surveys, which provide better resolution in the needed [3.6] and [4.5] micron bandpasses.
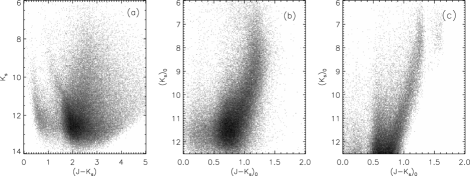
These surveys will provide five-band photometry [3.6][4.5] data which allow us to derive star-by-star extinctions utilizing the Rayleigh-Jeans Color Excess (RJCE) method (see Figure 1), fully described in Majewski et al. RJCE . The RJCE method allows us to explicitly determine the extinction to each star by using the observed [4.5] color that is nearly constant for a large range of common spectral types. The ability to derive extinctions and correct to relative distance ranges is essential for a survey of the Galactic plane and bulge, and we can utilize this tool to isolate potential cluster stars from the field population.
3.2 Cluster Analysis
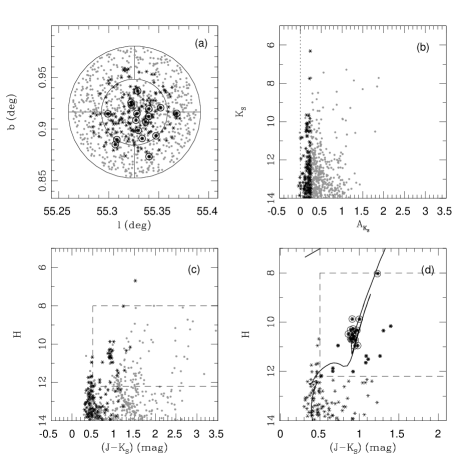
In order to distinguish and isolate star clusters from foreground and background contamination, we utilize the values derived from the RJCE technique described above. We isolate a region of approximately twice the clusters catalog radius diascat and divide it into 5 regions (see Figure 2a). We utilize four “background” regions and the cluster region (radius = ). The background is divided in order to account for dust clouds, clusters near the edge of the GLIMPSE survey reigion, and any other source of background variability. We difference the mean field/background star numbers to the “cluster” star numbers within a given range, and scan this range across all available values that have at least 15 stars (Mean field + cluster stars ; see Figure 2b). The window of extinction with the highest concentration of stars within the inner radius will reveal the cluster (Figure 2c & d). We then work to optimize the cluster isolation surveying a grid of width, stepsize, and allowed values.
3.3 Preliminary Results
We present a first analysis for the cluster NGC 6802 to demonstrate the technique, shown in Figure 2. Figure 2a first shows the area explored by our analysis in Galactic latitude and longitude. As desribed above, we selected likely cluster members utilizing the as shown in Figure 2b. For NGC 6802 we find a low, but non-negligible extinction or reddening to the cluster. A color magnitude diagram (CMD) of the clusters (Figure 2c) is generated which highlights the member stars with values within the window of extinction, where the dashed box in the center denotes the area where the upcoming SDSS-III/APOGEE project will be targeting ( and ). Finally, we compare our “cleaned” cluster CMD to the Padova isochrone utilizing catalog values diascat for NGC 6802 and find a good match. By comparing the CMD with isochrone values, when available, we are able to isolate candidate cluster stars with a high probablility for membership. The APOGEE project requires this cleaning for most clusters for two reasons: 1) most open clusters are found a low Galactic latitude and thereby are heavily contaminated with field stars. 2) Due to the large SDSS telescope field of view sdsstel , the minimum fiber-to-fiber distance is fairly large arcmin, which only allows for the targeting of a handfull of stars () per cluster for the most poorly studied, distant, and reddened clusters.
Acknowledgements.
SDSS-III is managed by the Astrophysical Research Consortium for the Participating Institutions of the SDSS-III Collaboration including the University of Arizona, the Brazilian Participation Group, Brookhaven National Laboratory, University of Cambridge, University of Florida, the French Participation Group, the German Participation Group, the Instituto de Astrofisica de Canarias, the Michigan State/Notre Dame/JINA Participation Group, Johns Hopkins University, Lawrence Berkeley National Laboratory, Max Planck Institute for Astrophysics, New Mexico State University, New York University, the Ohio State University, University of Portsmouth, Princeton University, University of Tokyo, the University of Utah, Vanderbilt University, University of Virginia, University of Washington, and Yale University. This work is based in part on observations made with the Spitzer Space Telescope, which is operated by the Jet Propulsion Laboratory, California Institute of Technology under a contract with NASA. Support for this work was provided by NASA through an award issued by JPL/Caltech. Additionally KJ was supported by an NSF REU grant (NSF 0851558) and funding from Texas Christian University, including a Science and Engineering Research Center (TCU-SERC) grant.References
- (1) Baumgardt, H., Dettbarn, C., Wielen, R. 2000, A&AS, 146, 251
- (2) Bragaglia, A., Sestito, P., Villanova, S., Carretta, E., Randich, S., Tosi, M. 2008, A&A, 480, 79
- (3) Churchwell, E., et al., 2009, PASP, 121, 213
- (4) Dias W. S., Lépine J. R. D., Alessi B. S., 2001, A&A 376, 441
- (5) Dias W. S., Lépine J. R. D., Alessi B. S., 2002, A&A 388, 168
- (6) Dias W.S., Alessi B.S., Moitinho A., Lepine J.R.D. 2002, A&A, 389, 871
- (7) Dias W. S., Assafin, M., Flório, V., Alessi B. S., Líbero, V. 2006, A&A, 446, 949
- (8) Friel, E.D., Jacobson, H.R., Pilachowski, C.A. 2010, AJ, 139, 1942
- (9) Frinchaboy, P.M. & Majewski, S.R. 2008, AJ, 136, 118
- (10) Geller, A.M., Mathieu, R.D., Harris, H.C., McClure, R.D. 2008, AJ, 135, 2264
- (11) Girardi, L., Groenewegen, M. A. T., Hatziminaoglou, E., da Costa, L. 2005, A&A, 436, 895
- (12) Glushkova, E. V., Zabolotskikh, M. V., Rastorguev, A. S., Uglova, I. M., Fedorova, A. A. 1997, AstL, 23, 71
- (13) Gunn, J.E., et al., 2006, AJ, 131, 2332
- (14) Harris, W.E. 1996, AJ, 112, 1487
- (15) Hole, K.T., Geller, A.M., Mathieu, R.D., Platais, I., Meibom, S., Latham, D.W. 2009, AJ, 138, 159
- (16) Jacobson, H.R., Friel, E.D., Pilachowski, C.A. 2009, AJ, 137, 4753
- (17) Majewski, S.R, Zasowski, G., Nidever D.L., 2010, AJ, submitted
- (18) Marigo, P., Girardi, L., Bressan, A., Groenewegen, M. A. T., Silva, L., Granato, G. L. 2008, A&A, 482, 883
- (19) Mathieu, R.D., Latham, D.W., Griffin, R.F., Gunn, J.E. 1986, AJ, 92, 1100
- (20) Sestito, P., Bragaglia, A., Randich, S., Carretta, E., Prisinzano, L., Tosi, M. 2006, A&A, 458, 121
- (21) Sestito, P., Bragaglia, A., Randich, S., Pallavicini, R., Andrievsky, S. M., Korotin, S. A. 2008, A&A, 488, 943
- (22) Skrutskie, M. F., et al., 2006, AJ, 131, 1163
- (23) Wilson, J.C., et al., 2010, SPIE, 7735, 46
- (24) Wright, E.L., et al., 2010, AJ, submitted (arXiv:1008.0031)