MUSTANG 3.3 Millimeter Continuum Observations of Class 0 Protostars
Abstract
We present observations of six Class 0 protostars at mm ( GHz) using the 64-pixel MUSTANG bolometer camera on the 100-m Green Bank Telescope. The mm photometry is analyzed along with shorter wavelength observations to derive spectral indices () of the measured emission. We utilize previously published dust continuum radiative transfer models to estimate the characteristic dust temperature within the central beam of our observations. We present constraints on the millimeter dust opacity index between mm, mm, and mm. typically ranges from to for Class 0 sources. The relative contributions from disk emission and envelope emission are estimated at 3.3 mm. L483 is found to have negligible disk emission at 3.3 mm while L1527 is dominated by disk emission within the central beam. The for L1527 indicates that grain growth is likely occurring in the disk. The photometry presented in this paper may be combined with future interferometric observations of Class 0 envelopes and disks.
1 Introduction
One of the fundamental problems in studies of low-mass ( few M⊙) star formation is to track the flow of material from the dense molecular cloud core through the disk and onto the protostar. Several theoretical models exist that describe the hydrodynamic collapse of protostellar envelopes (e.g., Larson 1969; Penston 1969; Hunter 1977; Shu 1977; Tereby, Shu, & Cassen 1984; Whitworth & Summers 1985; Foster & Chevalier 1993; Galli et al. 1993; Li & Shu 1996; McLaughlin & Pudritz 1997; Fatuzzo et al. 2004; Adams & Shu 2007). Observations of the density, temperature, and kinematic structure of the dense cores and disk can distinguish between these theoretical models.
Since the timescale for formation of a solar mass star is typically longer than a million years, we must track the evolution of material by observing protostellar objects in different evolutionary states and piece together an evolutionary theory for the collapse of dense cores and the subsequent growth and dissipation of a protostellar disk (e.g, Shu, Adams, & Lizano 1987; André et al. 1993, 2000). The Class 0 phase is of particular interest because it represents the earliest phase of star formation after the formation of a first hydrostatic core. Class 0 objects are defined as protostars that have yet to accrete the majority of their final mass (André et al. 2000) although in practice this definition is difficult to confirm for individual objects. Observationally, Class 0 protostars are defined as protostars which emit more than % of their luminosity at wavlengths longer than µm (see André et al. 1993). They are deeply-embedded in a dense gas and dust envelope (Shirley et al. 2000), they typically drive strong molecular outflows (Bontemps et al. 1996), and their luminosities are dominated by a variable accretion luminosity (Evans et al. 2009). Over the past decade, deep mid-infrared surveys have cataloged the population of Class 0 protostars in nearby molecular clouds (Dunham et al. 2008, Evans et al. 2009).
Observations at submillimeter and millimeter wavelengths of Class 0 protostars are useful for constraining the density and temperature structure of envelopes and disks. The emission is dominated by optically thin dust continuum emission (Adams 1991, Shirley et al. 2003). Radiative transfer modeling of the submillimeter continuum has determined the envelope density structure for several Class 0 protostars (e.g., Shirley et al. 2002, Jørgensen et al. 2002) which is a particularly good discriminant between theoretical models of inflow and collapse in the protostellar envelope (see Myers et al. 2000; André et al. 2000). The majority of the modeling has been focused on single-dish (sub)millimeter observations with modest (″) resolution; but, in order to study the connection between the envelope and the disk and in order to study the properties of Class 0 disks themselves, (sub)millimeter interferometric observations are needed; however, the interferometric observations must be modeled in combination with single-dish observations (which provide the zero spacing data) to constrain the amplitude of model visibilities. Furthermore, combined interferometric plus single-dish observations are needed at multiple wavelengths to constrain the properties of the dust emission (i.e. , the dust opacity index) which is a large source of uncertainty in the state-of-the-art radiative transfer models.
The spectral energy distribution (SED) of several famous Class 0 sources have been observed from mid-infrared through centimeter wavelengths; however, there is a gap in the observations of an order of magnitude in wavelength in the millimeter spectrum. Traditionally, the longest wavelength bolometer arrays utilized for star formation studies operate in the 1 mm band (e.g. MAMBO 1.25 mm, SIMBA 1.2 mm, BOLOCAM 1.1mm, AzTEC 1.1 mm). Recently, a new bolometer camera, MUSTANG, that operates at 3.3 mm (90 GHz) was built for the 100-m Green Bank Telescope111The Green Bank Telescope is operated by the National Radio Astronomy Observatory. The National Radio Astronomy Observatory is a facility of the National Science Foundation operated under cooperative agreement by Associated Universities, Inc. This region of the spectrum is of interest because observations at longer wavelengths provide a larger lever-arm for calculating dust opacity properties. At these long wavelengths, the emission from a protostellar disk may become an important component to the total flux. MUSTANG observations can provide the zero spacing data for future interferometric observations (e.g. with ALMA) of these sources to study the envelope and disk emission at a longer millimeter wavelength than previously possible.
In this study, we have observed six Class 0 protostars with MUSTANG at 3.3 mm. We describe the reduction techniques and present calibrated photometry for the sources (§2). We present an analysis of the spectral indices between the observed bands and published fluxes short-ward of our 3.3 mm observations. We constrain the properties of the dust emission (§3), accounting for emission from both the envelope (§3.1) and disk (§3.2).
2 MUSTANG Observations and Image Reduction
We observed six Class 0 protostars (see Table 1) with the MUSTANG 3.3 mm camera (Dicker et al. 2006, 2008) using the 100-m Green Bank Telescope (GBT, Jewell & Prestage 2004). MUSTANG is a 64-pixel bolometer camera with an 18 GHz wide continuum filter centered at 90 GHz (3.3 m). The pixels are transition edge-sensors spaced at with an instantaneous field-of-view of ″. The theoretical beamsize is ″ on the GBT , however, the illumination pattern plus surface inaccuracies result in slightly larger beamsizes of which we characterize with frequent measurements of bright secondary calibrator sources in each observing run. Observations were made over three days (February 6, April 24, and May 8) in 2009. At the start of each run, observations of a bright compact source (e.g. quasars) are used to solve for primary aperture wavefront phase errors using the “Out of Focus” (OOF) holography technique (Nikolic et al. 2007; Schwab & Hunter, in preparation). The solutions were applied to the active GBT surface. After the surface is calibrated, we observed the protostars using a centrally-weighted daisy scanning pattern. This scan pattern strikes a balance between modulating the sky quickly to beat-down detector noise drifts, and accumulating integration time on a single, small region of interest ( in diameter). Typical scan speeds on the sky are - .
Images are reduced by IDL routines through a custom pipeline. Detector gains are determined by pulsing an internal calibration lamp periodically. A “common mode” template is computed as a function of time by taking the median of the set consisting of each good detector sample for a given integration. This common mode template can optionally be low-pass filtered. The common mode template is fit to and subtracted from each detector timestream. Most systematic effects, such as atmospheric emission fluctuations, make almost identical contributions to each detectors’ data. The common mode is highly effective at removing these systematics. It also, however, filters out astronomical information on spatial scales larger than the instantaneous camera field-of-view (). The optional low-pass filtering mitigates this effect. A low-order polynomial is fit to and subtracted from each detector timestream individually. The order of the polynomial is chosen based on the duration of the scan in question to have 1 degree of freedom per seconds of data, depending on the stability of the data in question. Individual detector weights are assigned based on the variance of the fully cleaned detector timestream. A preliminary SNR map is made before this calculation using the detector white noise level as an initial weight estimate; segments of the timestream corresponding to regions of the map with SNR higher than 5 are excluded from the detector weight calculation, to avoid biasing the weights by the presence of bright signal. The data are corrected for atmospheric opacity with the opacity values for each observing session calculated from publicly available National Weather Service data222http://www.gb.nrao.edu/rmaddale/Weather/index.html. Finally, the data are gridded into a map.
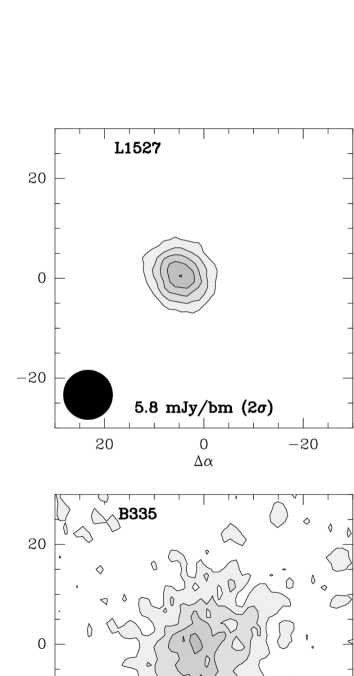
This procedure is iterated once to back out the effect of sky domain signal on the common mode and polynomial solutions. At the signal levels in our maps, further iteration does not have a significant effect on the results. Further details on the data analysis procedures can be found in Dicker et al. (2009) and Mason et al. (2010). The MUSTANG 3.3 mm images are shown in Figure 1.
The common mode subtraction used to remove atmospheric emission also has the effect of removing some large angular-scale source signals. We have characterized this effect with Monte Carlo simulations using the calculated model envelope surface brightness profile of B335 from Shirley et al. (2010), with the range of data reduction parameters used in our actual image production scripts. These simulations are passed through our full data reduction pipeline so their results incorporate the effects of all stages of the data reduction process. Of particular significance is the cutoff frequency of the low-pass filter applied to the common mode template (typically 0.1 Hz - 0.2 Hz for the data we present). We find that for B335, the peak surface brightness of the filtered envelope is 80% to 87% of the envelope as it would be seen by the GBT+MUSTANG in the absence of common mode subtraction. By way of comparison, the map obtained with a pure common mode subtraction (i.e., no low-pass filtering of the common mode template) retrieves only 71% of the peak central surface brightness. Note that this analysis includes the effects of the error beam of the telescope (discussed in Mason et al. 2010). The maximum effect, at the center of the envelope, causes % more power to be coupled in from the extended emission than would be seen in the absence of the error beam. Since we do not know, a priori, the disk contribution at 3.3 mm (§3.2), we have only characterized the surface brightness recovery of the envelope.
Observations were made of standard calibrators Ceres (February 6), Neptune (April 24), and CRL2688 (May 8). The final maps were calibrated in mJy/beam and in mJy in a ″ aperture by comparing the peak flux and flux in a ″ aperture respectively for the observed calibrators. We limit the aperture photometry to apertures the field-of-view of the MUSTANG array. The total predicted flux at 3.3 mm from Ceres was 465 mJy on February 6 (Thomas Mueller, private communication). A brightness temperature of K was assumed for Neptune observations (Weiland et al. 2010) in April. The total flux from CRL2688 was bootstrapped from previous MUSTANG observations over the 2009 season and was calculated to be 141 mJy. Aperture photometry on the Class 0 sources were performed to determine the peak voltage and the total voltage in a ″ aperture which was then multiplied by the appropriate calibration factor (mJy/Volts) for each day (Table 1). We note that the weather was dry with low winds on February 6, but that the weather was much wetter on April 24 and May 8. Calculated zenith opacities varied from to . Taking into account the fact that errors in the assumed zenith opacity also affect the celestial calibrator sources, we estimate that even in the most extreme case the overall uncertainty in our results due to the uncertainty in the zenith opacity is . This is substantially less than the - uncertainty in Neptune and Ceres absolute temperature scale. We therefore assume a % systematic flux calibration uncertainty at 3.3 mm.
3 Results
In this section we constrain the dust opacity index (; defined such that ) at millimeter wavelengths using estimates for the dust temperature calculated from dust continuum radiative transfer models. We first calculate the spectral index at (sub)millimeter wavelengths, then develop a method for calculating the appropriate single dust temperature to characterize emission within a central aperture. We use the calculated dust temperatures to determine the range in . Finally, in §3.2 we estimate the relative contributions to the observed from the envelope and disk for each of the Class 0 source in our sample.
3.1 Analyzing Spectral Indices
We characterize the emission between two wavelengths by assuming that the SED follows a power-law () and calculating the spectral index
| (1) |
The spectral index is an empirical property of the observed SED that can be related to the underlying properties of the emission.
We have tabulated the observed spectral indices from 0.86 mm to 3.3 mm in Table 1. The spectral index between 1.25 mm and 3.3 mm is calculated from the peak flux density (mJy/beam) in both the MAMBO 1.25 mm observations of Mötte & André (2001) and our MUSTANG observations. A direct comparison is feasible since the solid angles of the IRAM 30-m at 1.25 mm and the GBT 100-m at 3.3 mm are both approximately equivalent to the solid angle of a Gaussian beam with FWHM of ″. Unfortunately, we were not able to make the same peak flux density comparison with SCUBA observations at 0.862 mm since the effective beamsize of the JCMT is ″. Therefore, we calculate the spectral index between 0.86 mm and 3.3 mm using matched ″ diameter aperture photometry. The typical millimeter spectral index varies between to with an average of for this sample. Due to L1448NW being at the edge of the map, we were unable to calculate the flux in a ″ aperture at 3.3 mm for this source. Excluding L1448NW, the average is very similar to the spectral index calculated at 1.25 mm for the same sources.
If we assume the dust opacity ( cm2 gram-1) follows a single-power law at (sub)millimeter wavelengths (), then the dust opacity index, , may be found from the ratio of fluxes at the two wavelengths
| (2) |
Equation 2 assumes that a single dust temperature, , characterizes the emission at both wavelengths The derived can be sensitive to the choice of the dust temperature. For instance, at submillimeter wavelengths of and µm, varies by a factor of 0.5 for assumed dust temperatures that range from to K (Shirley et al. 2000). The variation is less severe when two wavelengths longer than mm are compared; nevertheless, a suitable single dust temperature must be found.
In reality there are strong gradients in the density and temperature increasing toward the center of the core. Since the dust continuum emission of the envelopes of four of the sources in this survey have been modeled using radiative transfer, we may use the calculated temperature profiles and constrained density profiles along each line-of-sight distance, , to estimate the appropriate characteristic dust temperature within an aperture. We define the isothermal envelope temperature, , as the single dust temperature that characterizes the observed emission from density and temperature gradients within a central aperture. For a telescope with normalized beam pattern, , the isothermal envelope temperature in a central aperture is derived from the equation for specific intensity of optically thin dust emission convolved with the telescope beam pattern,
| (3) |
where is the Planck function. Solving for gives,
| (4) |
where is the column density at an impact parameter away from the protostar. The line-of-sight distance is related to the impact parameter geometrically by where is the radial distance from the protostar (see Adams 1991, Shirley et al. 2003).
The isothermal envelope temperatures for the best-fit one-dimensional dust continuum models of Class 0 sources in this survey are shown in Figure 2. depends on the frequency of the observations. The curves in Figure 2 flatten at millimeter wavelengths. As a result, it is a good assumption to assume a single characteristic dust temperature at both wavelengths in Equation 2 as long as both of those wavelengths are greater than mm ( K). The single temperature assumption starts to break down at submillimeter wavelengths, although the variation in is not strong. For instance, the typical difference in between Herschel Space Observatory SPIRE wavelengths ( µm) is slightly less than 2 K. If the emission within the central aperture is dominated by envelope emission, then the curves in Figure 2 constrain the appropriate dust temperature to use in calculating . In §3.2, we explore the effects of the contribution of the disk.
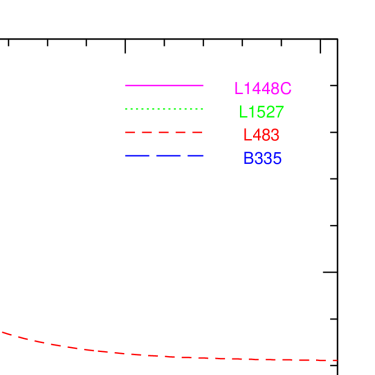
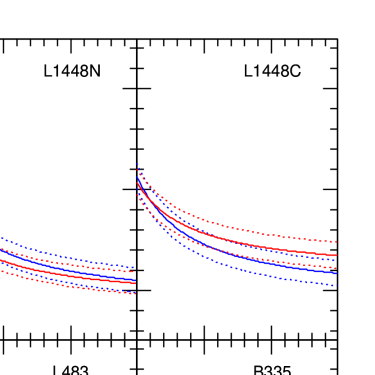
We constrain the dust opacity index using Equation 2 from a plot of versus the characteristic dust temperature (Figure 3). The curves for the 0.86 to 3.3 mm flux ratio (blue curves) and 1.25 to 3.3 mm flux ratio (red curves) are shown as solid lines in Figure 3. The dashed lines represent the statistical uncertainty in the flux at each wavelength. At the characteristic K for this sample of Class 0 protostars, does not have a strong dependence on the dust temperature. In general, the derived opacity index agrees within the statistical calibration uncertainty between and . Typical values range from to with an average value of . In the next section, we interpret the derived by accounting for the contribution from disk and envelope emission.
In all cases except for L1527, the curve agrees within the statistical errorbars with the curve. For L1527, the offset may be accounted for by a systematic calibration error of % at one or more of the three wavelengths (e.g., with SCUBA, MAMBO, and or MUSTANG calibration). The dominant source of uncertainty in determining is the uncertainty in the flux ratio at two wavelengths. The uncertainty is lower if the two wavelengths are more widely spaced (e.g. lower for the ratio vs. ). An uncertainty in the fluxes of % results in a typical uncertainty of in and in . An accurate flux calibration at both wavelengths and deep photometry is required to minimize this uncertainty. A second possibility for this discrepancy is that the emission between 0.86 mm and 3.3 mm is mixing different fractions of grain populations from the envelope and disk. This possibility is explored in the next section.
3.2 Estimating the Disk Contribution
The total flux observed at 3.3 mm is the sum of emission from the protostellar envelope, disk, and wind (or jet)
| (5) |
At submillimeter wavelengths, the dust continuum emission from Class 0 sources are expected to be dominated by their massive envelopes. At millimeter wavelengths, this assumption may no longer be valid and the disk emission may be a significant fraction of the total emission in the central beam. At centimeter wavelengths, thermal radio continuum emission (free-free emission) from the protostellar jet or wind becomes the dominant emission mechanism (Anglada 1995). The centimeter wavelength free-free emission can be variable from Class 0 protostars (see Shirley et al. 2007). Unfortunately, we do not have simultaneous centimeter continuum observations at the same epoch as the MUSTANG observations; however, extrapolation from published VLA fluxes and spectral indices indicate that the expected contribution from free-free emission at 3.3 mm is expected to be small (%). Therefore, we ignore the free-free contribution to the 3.3mm fluxes in the following analysis.
While it may be advantageous to study dust properties at millimeter wavelengths close to the Rayleigh-Jeans limit, the interpretation of single-dish observations becomes more difficult since derived are an amalgamation of disk plus envelope opacities. This is a particular issue for calculating since dust grains may undergo coagulation in the dense enviornments of Class 0 disks, and therefore the resulting is expected to be lower than for dust in the protostellar envelope (e.g., Henning & Stognienko 1996, Dominik & Tielens 1997, Poppe et al. 2000, Draine 2006, Birnstiel et al. 2010). We can identify the disk contribution at (sub)millimeter wavlengths from the visibility amplitudes of interferometric observations. Since disks are typically small ( AU corresponding to ″), they appear as unresolved structures on baselines shorter than the characteristic size. The disk flux may be determined from the flux level of a flattening in the visibility amplitudes, and a spectral index from interferometric observations at two wavelengths. In this section, we estimate the fraction of disk emission at mm and the impact on our interpretation of for four of the sources (L483, L1527, B335, and L1448C) with published multi-wavelength interferometric observations.
L483 is perhaps the easiest example to analyze as the emission from a disk is thought to be very weak for this source, even at wavelengths as long as 3 mm (Jørgensen et al. 2004, 2007, 2009). This source has been observed with the SMA and OVRO at wavelengths ranging from 0.8 mm to 3.0 mm and no evidence for a compact component is seen in the visibility amplitudes. Jørgensen et al. (2009) estimates a negligible disk mass compared to the envelope mass. The measured spectral index for L483 observed in this paper is consistent with the spectral index observed by Jørgensen et al. (2007) with the SMA between 0.8 and 1.25 mm ( on baselines k). Therefore, our observations at 3.3 mm are probing the envelope structure and are not significantly contaminated by emission from a disk. The observed range of is consistent with the opacities typically assumed for radiative transfer models of Class 0 envelopes. For instance, the widely used OH5 opacities have a for coagulated dust grains at a density of cm-3 for years with thin ice mantles (Table 2, column 5 of Ossenkopf & Henning 1994; also see Table 2 of Shirley et al. 2005 for a summary of for various dust models).
In contrast, the emission from L1527 at 3.3 mm within a central MUSTANG aperture appears to be dominated by the disk emission. L1527 has also been observed by Jørgensen et al (2007) with the SMA at 0.8 and 1.3 mm where a very flat spectral index of is observed on baselines k. Observations of this source have also been made using BIMA with the combination of four array configurations at 2.7 mm where a distinct flattening in visibility amplitudes is observed on baselines k with a flux of mJy (Y. Shirley, unpublished observations). The observed spectral index between 1.3 and 2.7 mm is consistent with SMA results (). All of the observed emission in the MUSTANG central beam may be accounted for by extrapolating this disk flux and interferometric spectral indices to 3.3 mm. The spectral indicies reported in Table 1 are larger than the interferometric spectral indices because a significant fraction (%) of the flux in the single dish apertures at 0.86 and 1.25 mm is still coming from the envelope. If the envelope dust has a steeper opacity index than the disk dust opacity index, the resulting is then an overestimate of the true in the disk. Despite this uncertainty in the true disk , the low value is consistent with evidence of evolution of the dust properties in the L1527 disk and indicates that different dust opacities than are used to model the envelope are needed (cf. Shirley et al. 2002).
B335 is a popular target with extensive interferometric observations; however, not all of these observations agree on the disk contribution. B335 was studied extensively at 1.2 and 3.0 mm with the Plateau de Bure Interferometer (PdBI) by Harvey et al. (2003). They found a slight flattening in the visibility amplitudes for baselines greater than k. The observed flux on these long baselines was mJy at 1.2 mm and mJy at 3.0 mm. The resulting spectral index is , slightly less than the spectral index of observed in this paper. Extrapolation of the 3.0 mm disk flux to 3.3 mm results in a small contribution to the MUSTANG flux ( mJy or % of the 3.3 mm flux). The PdBI observations do not agree with the flux estimates from extrapolation of the Jørgensen et al. (2007) SMA observations on baselines greater than k which predict a mm disk flux of mJy or approximately % of the MUSTANG flux. The real contribution of the disk flux for B335 is probably somewhere in between these estimates. It is likely that the Jørgensen et al. (2007) fluxes include a contribution from the envelope since emission has been seen on baselines longer than k from the envelope toward B335 (Harvey et al. 2003).
With the caveat that our estimates of toward B335 may have some contribution (%) from a disk component, the derived opacity index is significantly lower than has been observed in the outer envelope (Shirley et al. 2010). A comparison of the opacity ratios at µm and µm from near-infrared extinction observations and submillimeter continuum images yields a for lines-of-sight greater than ″ from the protostar (lines-of-sight where background stars were detected in NICMOS observations by Harvey et al. 2001). This may be direct evidence of a change in the opacity in the inner envelope and disk of B335. Our derived is consistent with the slope of OH2 dust (; Ossenkopf & Henning 1994; Shirley et al. 2005) for coagulated dust grains with no ice mantles as might be expected in the warm inner envelope of a Class 0 protostar. However, contribution from disk emission may be responsible, in part, for this percieved lowering of . If we subtract the maximal disk flux from mm and mm photometry, then which is consistent with the Shirley et al. 2010 outer envelope determination. Unfortunately, until observations are performed with an interferometer at two wavelengths that match the wavelengths of single dish continuum observations (e.g., 0.86 mm and 3.3 mm with ALMA), then this level of uncertainty in determining the envelope in the central aperture toward B335 will persist.
Observations of L1448C were also made by Jørgensen et al. (2007) with the SMA. Spitzer Space Telescope imaging of this region (Jørgensen et al. 2006) have discovered that this source is actually two Class 0 sources in ″ proximity (L1448C(N) and L1448C(S)). Because the southern source is significantly weaker than the northern source (only % of the flux of the northern source in the 1.25 mm SMA observations; Jørgensen et al. 2007), it is likely that the MUSTANG fluxes are predominantly from the northern source. The observed spectral index between 0.8 and 1.25 mm on baselines greater than k is significantly shallower than the spectral indices observed with single dish telescopes. Extrapolating the SMA results to mm indicates that as much as % of the MUSTANG flux may be due to the emission from the disk. Again, without multi-wavelength interferometric observations that match the wavelength of single-dish observations, we cannot accurately determine the envelope . The range of observed toward L1448C is very similar to the range observed toward B335. Accounting for the maximal disk contribution can also increase the range of in the envelope by .
Unfortunately, there are no published u,v amplitude curves for L1448N and L1448NW; therefore, we are unable to assess the disk contribution to the MUSTANG fluxes in these two cases. Interferometric observations have been made at 1.3 and 2.7mm toward the L1448 IRS3 region which includes these two sources (Looney et al. 2000, Kwon et al. 2006). L1448N is comprised of two bright sources separated by 10″ (labeled L1448 IRS3 A and B in Looney et al. 2000) which makes separating their visibility amplitudes very difficult. We note that L1448NW has the highest range in . Given such high values and the expectation that the opacity index is lower in disks, it seems unlikely that L1448NW has a significant disk contribution. However, the only way to confidently constrain the envelope and disk opacities is to analyze the visibility amplitudes at multiple wavelengths with an interferometer.
4 Summary
We have observed 6 Class 0 protostars with the MUSTANG camera at 3.3 mm. We report fluxes and calculate the spectral indicies at millimeter wavelengths. Systematic flux uncertainties of up to % at (sub)millimeter wavelengths limit determinations of to if an appropriate characteristic dust temperature is used. We have estimated the characteristic isothermal temperature in a central beam (″) from previously published dust continuum radiaitve transfer models ( K). The disk emission fraction at mm was estimated from published interferometric observations. We found emission at mm is dominated by the envelope for L483 and by the disk for L1527. The envelope for L483 is between to , consistent with the opacity index for the widely used OH5 dust opacities for Class 0 envelopes (). The disk to for L1527 is flatter than typical envelope opacity indicies likely indicating that grain growth is occuring in the disk of L1527. B335 and L1448C may have comparable disk and envelope emission although interferometric observations are needed to better constrain the emission fraction. Taking the maximal disk contribution at 3.3 mm into account for B335 leads to an estimate of the envelope that is consistent with the recent determination in the outer envelope by Shirley et al. (2010).
The 3.3mm obsevations in this paper should be used in conjunction with future interferometric observations to constrain the properties of the dust emission in the envelope and disk of Class 0 sources. The next step required in understanding the physical structure of these sources is muti-dimensional dust continuum radiative transfer which includes the envelope, disk, and outflow cavity with dust properties constrained from multi-wavelength interferometric and single-dish observations. With the incredible sensitivity of ALMA over a wide range of baselines, it will be possible to obtain the necessary observations at wavelengths that are well matched to current single-dish bolometer cameras. The MUSTANG observations presented in this paper have extended this wavelength coverage well into the millimeter.
References
- (1) Adams, F. C. 1991, ApJ, 382, 544
- Adams & Shu (2007) Adams, F. C., & Shu, F. H. 2007, ApJ, 671, 497
- (3) André, P., Ward-Thompson, D., & Barsony, M. 2000, In Protostars and Planets IV, ed. V. Mannings, A. Boss, S. Russell. (Tucson:Univ. Arizona), 59
- Anglada (1995) Anglada, G. 1995, Revista Mexicana de Astronomia y Astrofisica Conference Series, 1, 67
- Birnstiel et al. (2010) Birnstiel, T., et al. 2010, A&A, 516, L14
- Bontemps et al. (1996) Bontemps, S., Andre, P., Terebey, S., & Cabrit, S. 1996, A&A, 311, 858
- Fatuzzo et al. (2004) Fatuzzo, M., Adams, F. C., & Myers, P. C. 2004, ApJ, 615, 813
- Dicker et al. (2006) Dicker, S. R., et al. 2006, Proc. SPIE, 6275, 42
- Dicker et al. (2008) Dicker, S. R., et al. 2008, Proc. SPIE, 7020, 4
- Dicker et al. (2009) Dicker, S. R., et al. 2009, ApJ, 705, 226
- Dominik & Tielens (1997) Dominik, C., & Tielens, A. G. G. M. 1997, ApJ, 480, 647
- Draine (2006) Draine, B. T. 2006, ApJ, 636, 1114
- Dunham et al. (2008) Dunham, M. M., Crapsi, A., Evans, N. J., II, Bourke, T. L., Huard, T. L., Myers, P. C., & Kauffmann, J. 2008, ApJS, 179, 249
- Evans et al. (2009) Evans, N. J., et al. 2009, ApJS, 181, 321
- Foster & Chevalier (1993) Foster, P. N., & Chevalier, R. A. 1993, ApJ, 416, 303
- Galli & Shu (1993) Galli, D., & Shu, F. H. 1993, ApJ, 417, 243
- Harvey et al. (2003) Harvey, D. W. A., Wilner, D. J., Myers, P. C., Tafalla, M., & Mardones, D. 2003, ApJ, 583, 809
- Harvey et al. (2001) Harvey, D. W. A., Wilner, D. J., Lada, C. J., Myers, P. C., Alves, J. F., & Chen, H. 2001, ApJ, 563, 903
- Henning & Stognienko (1996) Henning, T., & Stognienko, R. 1996, A&A, 311, 291
- Hunter (1977) Hunter, C. 1977, ApJ, 218, 834
- Jewell & Prestage (2004) Jewell, P. R., & Prestage, R. M. 2004, Proc. SPIE, 5489, 312
- Jørgensen et al. (2002) Jørgensen, J. K., Schöier, F. L., & van Dishoeck, E. F. 2002, A&A, 389, 908
- Jørgensen (2004) Jørgensen, J. K. 2004, A&A, 424, 589
- Jørgensen et al. (2006) Jørgensen, J. K., et al. 2006, ApJ, 645, 1246
- Jørgensen et al. (2007) Jørgensen, J. K., et al. 2007, ApJ, 659, 479
- Jørgensen et al. (2009) Jørgensen, J. K., van Dishoeck, E. F., Visser, R., Bourke, T. L., Wilner, D. J., Lommen, D., Hogerheijde, M. R., & Myers, P. C. 2009, A&A, 507, 861
- Kwon et al. (2006) Kwon, W., Looney, L. W., Crutcher, R. M., & Kirk, J. M. 2006, ApJ, 653, 1358
- Larson (1969) Larson, R. B. 1969, MNRAS, 145, 271
- Li & Shu (1996) Li, Z.-Y., & Shu, F. H. 1996, ApJ, 472, 211
- Looney et al. (2000) Looney, L. W., Mundy, L. G., & Welch, W. J. 2000, ApJ, 529, 477
- Mason et al. (2010) Mason, B. S., et al. 2010, ApJ, 716, 739
- McLaughlin & Pudritz (1997) McLaughlin, D. E., & Pudritz, R. E. 1997, ApJ, 476, 750
- Motte & André (2001) Motte, F., & André, P. 2001, A&A, 365, 440
- Myers et al. (2000) Myers, P. C., Evans, N. J., II, & Ohashi, N. 2000, Protostars and Planets IV, 217
- Nikolic et al. (2007) Nikolic, B., Prestage, R. M., Balser, D. S., Chandler, C. J., & Hills, R. E. 2007, A&A, 465, 685
- Ossenkopf & Henning (1994) Ossenkopf, V., & Henning, T. 1994, A&A, 291, 943
- Penston (1969) Penston, M. V. 1969, MNRAS, 144, 425
- Poppe et al. (2000) Poppe, T., Blum, J., & Henning, T. 2000, ApJ, 533, 454
- (39) Shirley, Y. L., Evans, N. J., Rawlings, J. M. C., & Gregersen, E. M. 2000, ApJS, 131, 249
- (40) Shirley Y. L., Evans N. J., & Rawlings J. M. C. 2002, ApJ, 575, 337
- (41) Shirley, Y. L., Mueller, K. E., Young, C. H., & Evans, N. J. 2003, Galactic Star Formation Across the Stellar Mass Spectrum, 287, 298
- Shirley et al. (2005) Shirley, Y. L., Nordhaus, M. K., Grcevich, J. M., Evans, N. J., II, Rawlings, J. M. C., & Tatematsu, K. 2005, ApJ, 632, 982
- Shirley et al. (2007) Shirley, Y. L., Claussen, M. J., Bourke, T. L., Young, C. H., & Blake, G. A. 2007, ApJ, 667, 329
- Shirley et al. (2010) Shirley, Y. L., Huard, T. L., Pontoppidan, K. M., Wilner, D. J., Stutz, A. M., Bieging, J. H., & Evans II, N. J. 2010, ApJ, submitted
- Shu (1977) Shu, F. H. 1977, ApJ, 214, 488
- Shu et al. (1987) Shu, F. H., Adams, F. C., & Lizano, S. 1987, ARA&A, 25, 23
- Weiland et al. (2010) Weiland, J. L., et al. 2010, arXiv:1001.4731
- Terebey et al. (1984) Terebey, S., Shu, F. H., & Cassen, P. 1984, ApJ, 286, 529
- Whitworth & Summers (1985) Whitworth, A., & Summers, D. 1985, MNRAS, 214, 1
| Source | (J2000.0) | (J2000.0) | bbAperture photometry determined from Shirley et al. (2000) 862 µm images. Statisitcal errorbars are tabulated. | ccPhotometry reported in Mötte & André (2001). | ddThe characteristic isothermal temperature (Equation 4) in a ″ aperture between 0.86 and 3.3 mm (see Figure 2). | eeThe range in determined between 0.86, 1.25, and 3.3 mm at (see Figure 3). K was assumed for L1448N and L1448NW. | ||||
|---|---|---|---|---|---|---|---|---|---|---|
| (h m s ) | (∘ ′ ″) | (mJy 20″) | (mJy/beam ) | (mJy/beam ) | (mJy 20″) | (K) | ||||
| L1448NW | 03 25 35.8 | 30 45 34 | 2510 (160) | 560 (25) | 13.5 (1.4) | … | … | 3.83 (0.11) | … | 1.94 - 2.23 |
| L1448N | 03 25 36.3 | 30 45 15 | 4610 (290) | 1400 (5) | 85.8 (8.6) | 100.5 (10.1) | 2.85 (0.12) | 2.88 (0.11) | … | 1.02 - 1.29 |
| L1448C | 03 25 38.8 | 30 44 03 | 1970 (130) | 620 (15) | 29.1 (2.9) | 39.2 (3.9) | 2.92 (0.12) | 3.15 (0.13) | 16.7 | 1.10 - 1.52 |
| L1527 | 04 39 53.9 | 26 03 10 | 1690 (110) | 375 (6) | 28.7 (2.9) | 33.3 (3.4) | 2.92 (0.12) | 2.65 (0.12) | 14.1 | 0.82 - 1.42 |
| L483 | 18 17 29.8 | 04 39 38 | 1870 (100) | 290 (15) | 8.7 (0.9) | 19.3 (1.9) | 3.41 (0.12) | 3.61 (0.16) | 18.1 | 1.57 - 2.00 |
| B335 | 19 37 01.1 | 07 34 11 | 1400 (80) | 270 (5) | 14.4 (1.5) | 25.8 (2.6) | 2.98 (0.12) | 3.02 (0.16) | 14.4 | 1.18 - 1.45 |