Phenomenological model for ordered onions under shear flow
Abstract
We propose a phenomenological model for the multi-lamellar vesicles (onions) formation induced by shear flow. In a nonionic surfactant (C12E4) system, onion phases under a fixed shear flow within a certain range show the order-disorder transition accompanied with a size jump by changing temperature. Our model can simulate ordered and disordered onion phases with different onion sizes. We show numerical results of the onion formation simulated by the model and also discuss what factors in this system are critical to cause the transition between these two different onion phases.
pacs:
05.65.+b, 82.70.Uv, 05.45.-aI Introduction
Surfactants in water form various kinds of assemblies such as lamellar, micelles and vesicles. Multi-lamellar vesicles, which are also called onions, are one of the interesting morphologies induced by shear flow. The onion formation under shear flow has been, in fact, observed in experiments Diat93 ; Diat95 ; Nettesheim ; Fujii . Onions fill space with various sizes and forms of polyhedra. Each onion consists of concentric lamellar membranes, which were observed by electro-microscopy Gulik . The size of an onion depends on the shear rate and the characteristics of a surfactant membrane. Several theories have been proposed to estimate onion size. Diat et al. proposed the model in which applied shear stress is balanced by the elastic stress given by the curvature energy of membrane Diat93 . On the other hand, van der Linden et al. proposed the idea that applied shear stress is balanced by the energy cost to deform an onion Linden . These models have been examined by experiments especially concerning shear-rate dependence. The formation of onions, i.e. closed-packed or disordered structure, is another problem to be investigated. Panizza et al. suggested that the disordered onion phase is made of randomly oriented monodomains which consist of closed-packed onions Panizza96 .
The characteristics of a surfactant membrane, e.g. elasticity, depend on temperature as well as substances. An interesting behavior related to the temperature dependence has been observed in the shear-induced ordering of onions in a nonionic surfactant (C12E4) system: Onions form a two-dimensional (2D) close-packed honeycomb structure in a certain temperature interval and they are disordered below and above the temperature interval Le ; Suganuma . Moreover, in recent experiments, it has been revealed that the order-disorder transition is accompanied by a size jump Suganuma . The size of onions is 5-6 times larger in the ordered phase than in the disordered one. To our knowledge, no theoretical model about the transition has been proposed, though the order-disorder transition with a size jump had already been reported in other systems Diat95 ; Sierro .
In this paper, we propose a model to simulate ordered and disordered onion phases with different onion sizes from the view point of pattern formation. The model provides the means to demonstrate the formation of an onion phase in real space. Experiments by the small-angle light scattering (SALS) and small-angle X-ray scattering (SAXS) give only images in reciprocal space. It is difficult in those scattering experiments to see what structure onions form in three dimensions. Simulations in real space will give a clue to analyze the structure of the onion phase which is observed experimentally. In this paper, we focus on the onion formation induced by shear flow. Our model illustrates the onion pattern which is stable under shear flow, although the model is not suitable to discuss the lamellar-onion transition.
From the view point of pattern formation, 2D hexagonal structure such as the ordered onion phase appears ubiquitously. One of the most famous examples is nonequilibrium fluid dynamics known as Rayleigh-Bénard convection, of which pattern formation is well described by the Swift-Hohenberg (SH) equation. The SH equation is a well-known model equation for nonequilibrium pattern formation phenomena Cross , and it has a property of so-called potential dynamics. We derive a phenomenological model, which is similar to the SH equation, of the onion formation by constructing the free energy of onion phases under shear flow.
The rest of this paper is organized as follows. In Sec. II, we introduce a phenomenological model describing the onion formation induced by shear flow. In Sec. III, we show numerical results of ordered and disordered onion phases with different onion sizes. Section IV is devoted to the discussion about how the onion size and the ordering structure of onions are selected. Finally, we conclude this paper in Sec. V.
II Model
We here construct a phenomenological model for the shear-induced onion phase. We mainly focus on the transition of the onion formation (size and ordering structure) and do not consider the transition between lamellar and onion phases in our model. To simulate the onion formation under shear flow, we derive the free energy of onion phases including the contribution from shear flow, so that we can realize the stationary distribution of onions by minimizing the free energy.
We first assume that onions, which have a certain identical size , are packed to form a 2D board. The centers of onions are placed on the - plane. The spatial distribution of onions is expressed as the distribution of the height of onion surface, (see Fig. 1).
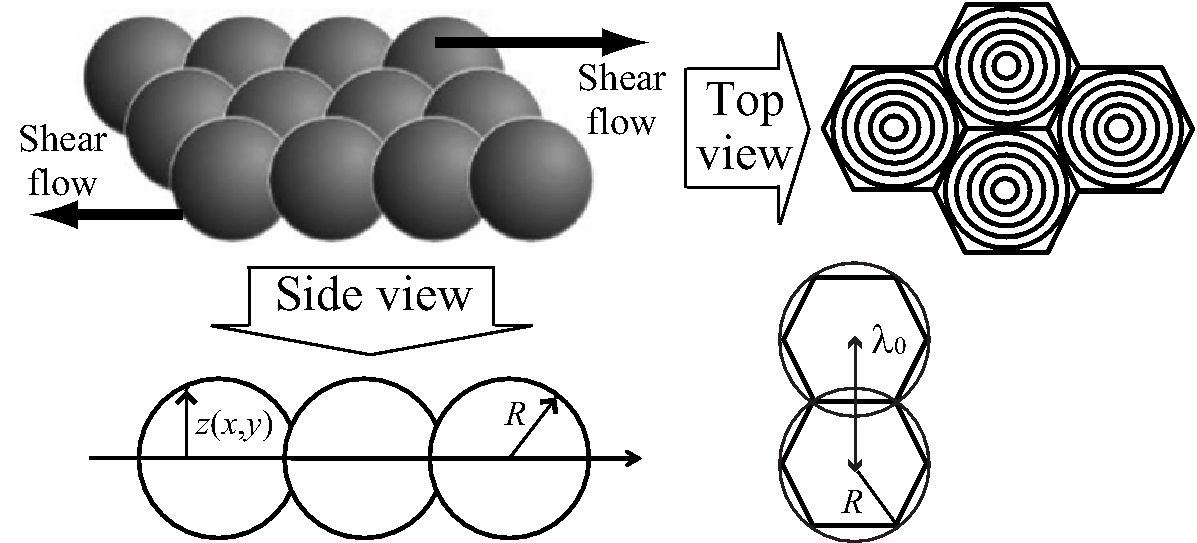
Second, considering onions are closed-packed to form a 2D honeycomb structure (Fig. 1), we assume that the shape of an onion is a slightly-distorted sphere (see Fig. 2) because spherical onions cannot fill space without deformations. In fact, actual onions show a polyhedral structure in the experimental observation Gulik , and the distortion of the membranes is localized at corners. However, we assume the distortion of membranes is uniformly distributed over slightly-distorted spherical vesicles for simplicity. The validity of this assumption is discussed in the Sec. IV.
II.1 Free energy for the onion phase under shear flow
On the above assumptions, we give the following Gibbs free energy including the contribution from shear flow.
| (1) |
The free energy , which is a function of , consists of two parts: (i) the contribution from the free energy of a deformed onion () and (ii) the contribution from the stress applied to the surface membrane of packed onions under shear flow (). We derive these two parts of the free energy in what follows.
II.1.1 Contribution from a deformed onion
The free energy of a deformed onion consists of bending energy and interaction energy coming from compression of the layers. We here derive these two kinds of free energy as follows.
We first derive in a similar manner to that of Ref. Ramos . The bending free energy per area for a bilayer membrane is represented as the following function of the mean and Gaussian curvatures, and , respectively.
| (2) |
where and are the conventional bending and Gaussian curvature moduli, respectively, and are nonlinear moduli. We here consider a vesicle which has a spherical shape, which indicates that and are equivalent. Thus, the free energy, , of a spherical shell with radius is given by
| (3) |
where and .
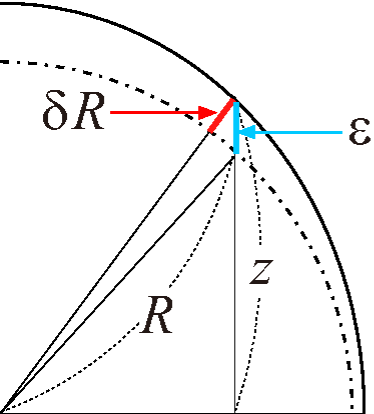
We next consider distortion of the spherical shell due to packed-onion formation. We assume that the radius of curvature changes from an ideal radius to that for a distorted spherical shell (Fig. 2). Since the degree of distortion is quite smaller than the ideal radius (), we expand the mean curvature in and keep terms up to the third order.
| (4) |
Similarly, we have and as follows.
| (5) | ||||
| (6) |
Substituting these expressions into Eq. (3), we have
| (7) |
Thus, the free energy (per unit volume of an onion with radius made of vesicles with layer spacing ) is given by
| (8) |
where is the ratio of distortion on the outermost shell of an onion. Let us consider the distortion of the onion surface. As illustrated in Fig. 2, the difference between the height of the distorted outermost shell and that of the spherical one is taken to be , which leads the following relation: . Under the conditions of slight distortion ( and ), we obtain the following relation
| (9) |
By using the above relation, we finally have as a function of ,
| (10) |
We next derive the interaction energy related to compression. The lammellar interaction between layers is given by , where and are the compression modulus and layer spacing, respectively. Applying the interaction to layers inside a onion with radius , the interaction between vesicle layers depends the height of the onion surface because effective layer spacing is given by . We thus have as a function of ,
| (11) |
where we have used .
From the above derivation, we finally obtain the free energy of a deformed onion
| (12) |
where and .
II.1.2 Contribution from the stress applied to the surface membrane under shear flow
We next consider the free energy from the stress applied to the surface membrane of packed onions under shear flow. Suppose that onion surfaces are covered by a single membrane as if the membrane is a part of each onion surface, and also that the membrane is subjected to an effective stress that comes from surface tension and shear stress. From these assumptions, the free energy contribution from the effective stress is written as
| (13) |
where and denote the effective stress and the total area of the membrane, respectively. The first term is the bending free energy of the onion surface as a single membrane and the second term is the effective stress applied to the membrane under shear flow. We assume the effective stress includes contributions not only from effective surface tension but also from shear stress. Although the shear can affect vesicle membranes inside onions, we impose the effect from shear stress on only the surface membrane for simplicity.
II.2 Distribution of the onion surface
To simulate the stationary distribution of the onion surface , we use the following Ginzburg-Landau (GL) equation Onuki , in which time evolution is given by the variation of the free energy ,
| (17) |
where
| (18) |
Here, the phenomenological coefficient has the dimension of time over mass and we fix in the following. By solving the above equation, we finally obtain the stationary distribution of the onion surface . Since the stationary distribution is realized by minimizing the free energy of onion phases under shear flow, we can simulate the onion pattern formation under shear flow by solving Eq. (17).
It should be noted that Eq. (17) has essentially the same form as the SH equation. In other words, the equation we have derived is in the same class as the SH equation, although the mechanism of onion pattern formation is different from that of the system in which the SH equation was originally derived.
III Results
We here show numerical results obtained from our model to demonstrate the change between a small-disordered onion phase and a large-ordered one. Table 1 lists the system parameters of the model. The system size is (lattice) with the periodic boundary condition. To integrate the model equation, we have used the Crank-Nicolson scheme. Since we are mainly interested in the packed-onion ordering, we focus only on the stationary distribution of after a sufficiently long time. In our numerical simulations, is fixed (), because it is considered to be almost constant under experimental conditions for onion phases Suganuma2 . and is set by using following relations: and . The validity of these relations is discussed in the next section. Two different sets of the other parameters (cases A and B) are listed in Table 2.
| effective stress | compression modulus | ||
| bending modulus | radius of an onion | ||
| saddle-splay modulus | layer spacing | ||
| nonlinear modulus | shift of caused | ||
| by distortion |
| case A | ||||||||||
| case B |
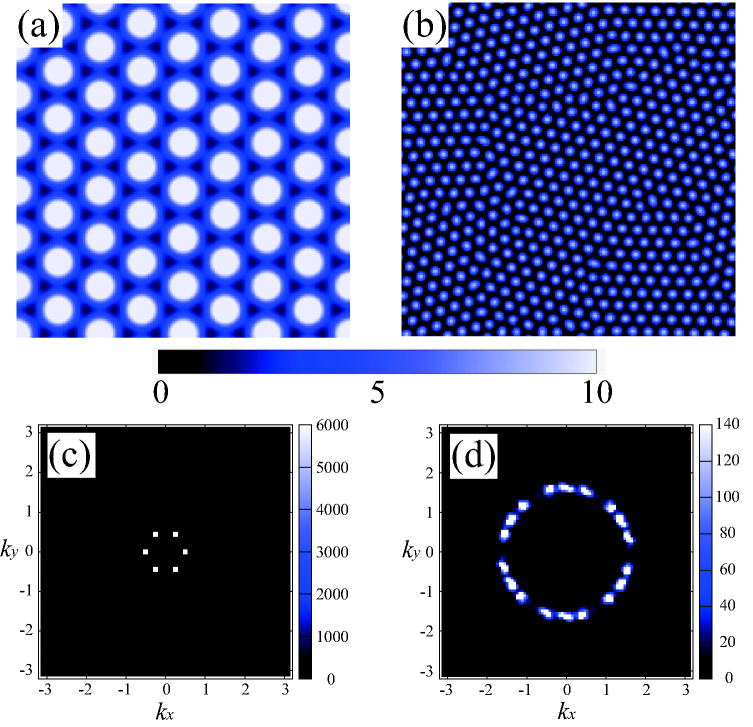
Figure 3 shows the distributions of and spatial power spectra for case A and case B. For case A, the size of onions is large () and onions show a honeycomb structure (panel (a)). By contrast, for case B, the size of onions is quite small (), although the distribution of onions looks an almost perfect honeycomb structure (panel (b)). However, spatial power spectra for these cases are totally different. Panel (c) shows a perfect six-fold symmetry for case A, although panel (d) shows an isotropic circular spectrum for case B. This isotropic ring indicates that the onion phase consists of some small domains of packed onions (i.e. onion texture, Panizza96 ; Courbin ): Each small domain has the perfect six-fold symmetry but has different directions. These random directions of small domains result in the isotropic ring spectrum.
Furthermore, the time duration before the distribution of falls into a stationary state is totally different for cases A and B. While the ordered onion phase gradually appears in case A, some small domains appear very quickly in case B. The difference can be explained in terms of the linear-growth rate, which is estimated from the linear stability analysis. Since the linear-growth rate is a very small positive value in case A, the stationary pattern can reach the potential minimum, where the ordered honeycomb structure is stable. On the other hand, in case B, because the linear-growth rate is a relatively large positive value, the stationary pattern quickly reaches a metastable state, where some randomly-directed monodomains coexist, and stays there.
We have also checked the robustness of these results by simulations in a larger system size. These results indicate that our model is able to reproduce the change between the large-ordered onion phase and the small-disordered one by changing the system parameters. We next discuss the validity of changing these parameters.
IV Discussion
We here discuss what factors in our model are essential to induce the change between the large-ordered onion phase and the small-disordered one, focusing on tha validity and temperature dependence of the parameters in our model.
IV.1 Onion size
At first, we focus on how to determine onion size in our model. As mentioned above, Eq. (17) has a similar mathematical structure to that of the SH equation, which is a model equation to simulate periodic domain patterns. The characteristic length of the domain pattern produced by the SH equation can be estimated effectively from the linear stability analysis. In the case of Eq. (17), . represents the distance between the centers of neighboring onions and it also has a relation because of the geometrical structure of packed onions (see Fig. 1). Therefore, the estimated onion size is given by
| (19) |
This equation indicates that the onion size in our model is determined by the ratio of and . We set in our simulations by using Eq. (19).
Actually, only is the essential parameter to determine the onion size, because is fixed in our simulations. Under a fixed shear rate, it is assumed that the change of is caused by the change of the surface tension. According to experimental studies Panizza96 ; Leng , the elastic modulus measured in linear viscoelastic experiments is associated with the surface tension and onion size : . Assuming and substituting Eq. (19) into the above relation, we have . In the experiment of the system, on the other hand, decreases as the radius of onions increases Suganuma2 . These experimental results indicate that in the large-ordered onion phase is smaller than that in the small-disordered one. This property of the surface tension corresponds qualitatively to that of the parameter in our simulations ( and in cases A and B, respectively).
We further discuss the change in onion size as a function of shear rate and layer spacing . Diat et al. estimated onion size by considering a balance between the elastic stress and the viscous stress as follows Diat93 .
| (20) |
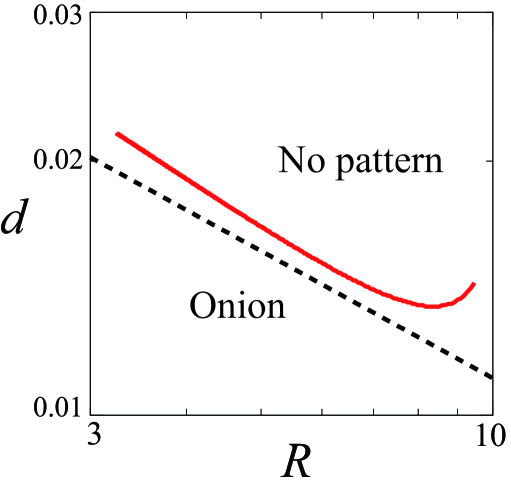
where is the solvent viscosity. For a fixed (i.e. Newtonian fluid), this relation implies . This estimation accords with dependence experimentally observed by themselves. Assuming the effective stress in our model is estimated as and substituting it into Eq. (19), we also have for a fixed . We further estimate the relation between onion size and layer spacing from the linear stability analysis of Eq. (17). Figure 4 shows a phase diagram of onion phase as a function of and . The boundary of onion phase, which is calculated from the linear stability analysis, has a slope . It indicates the relation , because the ordered onion phase appear near the boundary, that is, the region where the linear-growth rate is very small.
Actually, the order-disorder transition with a size jump is related to the compression of the onion layers. It causes a discontinuous change of the viscosity CourbinPRL . The experimental result of Ref. CourbinPRL also shows the shear thinning, that is, the viscosity depends on the shear rate . However, the effective stress in our model includes not only the shear stress but also , , and . Thus, we cannot discuss the compression or shear thinning in our model.
IV.2 Degree of the distortion
We next consider the validity of the distortion of vesicle membranes due to packing of onions. Although we assume that membranes of packed onions are slightly distorted from a sphere, actual onions have a polyhedral structure Gulik . We clarify the validity of the assumption by estimating the degree of the distortion . Inside an onion formed by polyhedral vesicles, the effective surface tension and the penetration length , which corresponds to the distortion of vesicle membranes, can be estimated as and , respectively, where is the bending modulus and is the compression modulus Panizza96 ; Linden2 . We here assume that the effective surface tension corresponds approximately to the stress in our model, namely . We thus have . In addition, we can estimate the compression modulus in our simulation by using the above estimation of , and consequently, we set .
On the other hand, the onion size can be estimated to be as mentioned above. We thus obtain the following relation: . This indicates that the larger the onion size the larger the distortion , if one assumes . The above relation is also equivalent to the relation . This corresponds to our assumption . Therefore, the assumption for the distortion of vesicle membranes due to packing of onions is consistent with other assumptions. In addition, we set in our simulations to satisfy the above relation that the larger onion has larger distortion.
IV.3 Elastic properties of vesicle membranes in packed onions
Elastic properties of vesicle membranes in packed onions, such as , , and , should also be considered. We first focus on the signs of coefficients of the bending free energy such as and . In general, the saddle-splay modulus is a negative value unless the sponge () phase is stable and spherical vesicles are stabilized for . However, the effects of shear flow are not taken into account in this condition. Thus, it is not necessary in our model to satisfy the condition. We have actually checked simulations for different sets of parameters , , and and consequently found that the onion phase can be obtained only when and . This result suggests that the shear stress stabilizes unstable spherical vesicles for .
We further refer two important nonlinear effects of the bending free energy to simulate onion phases in our model: nonlinear modulus in the bending energy and the distortion of membranes due to packing of onions. The usual expression of the Helfrich curvature free energy does not include the nonlinear coefficient . However, should be considered in an onion phase, because high curvatures are expected near the core of an onion Ramos . Also in our model, is one of the essential parameters to simulate onion phases, because no onion phase is generated from our model if is taken to be . With regard to the distortion of membranes, it is also necessary to consider the distortion of vesicle membranes in our model to simulate onion phases. The third-order expansion of the curvature on a distorted vesicle is necessary to generate the ordered onion formation, because the non-linear terms of in Eq. (18) play a similar role of a double-well potential.
IV.4 Temperature dependence of the parameters
We further consider the relation between the temperature dependence of the system parameters in our simulations and that of the physical quantities in experimental studies. Since is the critical parameter to determine the onion size in our simulations, it should have a similar temperature dependence to that of the onion size. In other words, should be minimized in a certain temperature interval and have larger values above and below the interval.
On the other hand, Kosaka et al Kosaka reported that layer spacing can change around the lamellar-onion transition, and also discussed temperature dependence of . They measured at different concentrations of the surfactant and showed that the ratio of and the thickness of bilayers has a temperature dependence. Although they focused on the lamellar-onion transition in their experiments, the temperature dependence of may be one of the important factors to cause the order-disorder transition in onion phases. We therefore change the value of and in our simulations, assuming the temperature dependence of these parameters. Actually, they are not essential parameters to determine the onion size, but important parameters to determine the linear-growth rate, that is, determine whether onion phases appear or not.
V Conclusion
We have proposed the phenomenological model for the onion pattern formation induced by shear flow. We have derived the free energy of an onion phase by considering contributions from deformed packed onions and from the stress applied to the surface membrane on packed onions under shear flow. Our model includes two important nonlinear effects, that is, nonlinear modulus in the bending energy and the distortion of membranes due to packing of onions. These nonlinearity are crucial in simulations to reproduce onion phases in our model. Then, we have demonstrated that the two different onion phases, large-ordered one and small-disordered one, can be simulated by adjusting the system parameters in our model. The ordered onion phase has a clean honeycomb structure made of packed onions. The disordered onion phase consists of small domains of ordered packed onions. Each domain has the six-fold symmetry, and domains are laid in random directions. The size of packed onions is determined by the ratio of the bending modulus and the effective stress . Thus, is the main control parameter under the fixed- condition, though other parameters, such as and , are also important for emergence of onion phases. In fact, the system parameters in our model, such as , are difficult to compare with the physical quantities which can be measured in experiments. In that sense, our model can be improved, nevertheless, it is useful as a simple model for the shear-induced onion formation.
Acknowledgements.
The authors would like to thank Y. Suganuma, T. Kato and J. Fukuda for useful comments and discussion.References
- (1) O. Diat, D. Roux and F. Nallet, J Phys. II (France) 3, 1427 (1993).
- (2) O. Diat, D. Roux and F. Nallet, Phys. Rev. E 51, 3296 (1995).
- (3) F. Nettesheim, J. Zipfel, U. Olsson, F. Renth, P. Lindner and W. Richtering, Europhys. Lett. 53, 335 (2001).
- (4) S. Fujii and W. Richtering, Eur. Phys. J. E 19, 138 (2006).
- (5) T. Gulik-Krzywicki, J.C. Dedieu, D. Roux, C. Degert and R. Laversanne, Langmuir 12, 4668 (1996).
- (6) E. van der Linden, W.T. Hogervorst and H.N.W. Lekkerkerker, Langmuir 12, 3127 (1996).
- (7) P. Panizza, D. Roux, V. Vuillaume, C.-Y. D. Lu and M.E. Cates, Langmuir 12, 248 (1996).
- (8) T.D. Le, U. Olsson and K. Mortensen, Phys. Chem. Chem. Phys. 3, 1310 (2001).
- (9) Y. Suganuma, M. Imai, T. Kato, U. Olsson and T. Takahashi, Langmuir 26, 7988 (2010).
- (10) P. Sierro and D. Roux, Phys. Rev. Lett., 78, 1496 (1997).
- (11) M. C. Cross and P. C. Hohenberg, Rev. Mod. Phys. 65, 851 (1993).
- (12) L. Ramos, D. Roux, P. D. Olmsted and M. E. Cates, EuroPhys. Lett., 66, 888 (2004).
- (13) L. Peliti and S. Leibler, Phys. Rev. Lett., 54, 1690 (1985).
- (14) A. Onuki, Phase Transition Dynamics (Cambridge University Press, Cambridge, UK, 2002).
- (15) Y. Suganuma, Ph. D thesis, Ochanomizu University, 2010.
- (16) L. Courbin and P. Panizza, Phys. Rev. E 69, 021504 (2004).
- (17) J. Leng, F. Nallet and D. Roux, Eur. Phys. J. E 4, 337 (2001).
- (18) L. Courbin and P. Panizza, and J. B. Salmon, Phys. Rev. Lett., 92, 018305 (2004).
- (19) E. van der Linden and J. H. M. Dröge, Physica A 193, 439 (1993).
- (20) Y. Kosaka, M. Ito, Y. Kawabata and T. Kato, Langmuir 26, 3835 (2009).