Physical Conditions in the Broad Line Region of Quasars:
A Photoionization Method to Derive and ♣♣affiliationmark:
Abstract
We present high S/N UV spectra for eight quasars at obtained with VLT/FORS. The spectra enable us to analyze in detail the strongest emission features in the rest-frame range 1400-2000 Å of each source (Ciii]1909, Siiii]1892, Aliii1860, Siii1814, Civ1549 and Siiv1397). Previous work indicates that a component of these lines is emitted in a region with well-defined properties i.e., a high density and low ionization emitting region). Flux ratios Aliii1860/ Siiii]1892, Civ1549/Aliii1860, Siiv1397/ Siiii]1892, Civ1549/Siiv1397 and Siii1814/ Siiii]1892 for this region permit us to strongly constrain electron density, ionization parameter and metallicity through the use of diagnostic maps built from CLOUDY simulations. Reliable estimates of the product density times ionization parameter allow us to derive the radius of the broad line region from the definition of the ionization parameter. The estimate and the assumption of virialized motions in the line emitting gas yields an estimate for black hole mass. We compare our results with estimates obtained from the – luminosity correlation customarily employed to estimate black hole masses of high redshift quasars.
1 Introduction
1.1 Interpreting Quasar Spectra
Measuring relevant physical parameters from the observed broad-line spectra of quasars is still an open challenge. Identification and intensity measurements of the strongest emission lines has made possible a rough inference of the typical conditions of the emitting gas since the earliest days of quasar spectroscopy. The very first quasars of intermediate redshift discovered in the 1960s showed a fairly high ionization spectrum, with prominent lines of Civ1549, and Heii1640 in addition to strong Balmer lines of the low-redshift quasars. Photoionization by the central continuum source was considered the preeminent heating mechanism of the emitting gas. Significant Ciii]1909 emission suggested electron densities () in the range cm-3. The observed intensity ratio Ciii]1909/Civ1549 indicated ionization parameter (defined by Eq. 1 later in this paper) values of the order of . This photoionization scenario was successful in explaining at least some quasar optical and UV spectra (see the review by Davidson and Netzer 1979 for a synopsis). More recent work emphasized the existence of several problems with this simple scenario. Low ionization lines (LILs), and especially Feii are too strong to be explained by a photoionized region of moderate density and column density (see for example Dumont and Mathez 1981; Joly 1987; Collin-Souffrin et al. 1988; Dumont and Collin-Souffrin 1990). These authors stressed that the LILs required a denser, low-temperature environment.
We unfortunately lack a simple well-defined diagnostic measure of physical conditions in the broad line region. One strategy for estimating electron density in astrophysical sources involves using two emission lines of the same ion, and with similar energies above the ground level, but with different radiative transition probabilities . In practice one often chooses two lines from the same term where one forbidden/semi-forbidden transition is associated with another that is semi-formidden/permitted in order to ensure very different values of (for example, [Siiii]1882 and Siiii]1892). This technique is not straightforwardly applicable to the broad lines of quasars, precisely because the lines are broad, suitable candidates are too closely spaced in wavelength, and density is at least an order of magnitudes higher than the critical density for the forbidden transitions used in spectra of planetary nebulæ and Hii regions. In addition the S/N and the resolution of quasar spectra are usually not very high.
Feibelman and Aller (1987) used the Ciii]1909/ Siiii]1892 ratio to study the rather high-density environment typical of symbiotic stars ( cm-3). In this case we have two semi-forbidden (intercombination) resonance lines with significantly different transition probabilities (see Table References). The lines are emitted by two iso-electronic species with somewhat different ionization potentials (11 eV for C+ vs. 8 eV for Si+). The ionic fraction is dependent on the relative abundance of silicon-to-carbon (to be assumed) as well as on the ionization structure within the emitting region (to be computed). Using lines of different ions introduces additional potentially serious sources of uncertainty. It is perhaps not surprising that most workers believe that in the BLR cannot be reliably estimated using quasar spectra. Strong Ciii]1909 emission would imply that cannot be very high (cm-3). Very high density was invoked to explain the rich low ionization spectrum (especially Feii) seen in the spectra of most quasars. Several lines in the UV spectrum of I Zw 1 point towards high density at least for the LIL emitting zone: prominent Feii, relatively strong Aliii1860, and detection of Ciii1176 (Baldwin et al. 1996; Laor et al. 1997b). The region where these lines are produced cannot emit much Ciii]1909. But is Ciii]1909 really so strong in most quasars? BLR conditions are certainly complex and a single emitting region is not sufficient to explain both LILs and high ionization lines (HILs).
1.2 Quasar Systematics
Quasar spectra are not all alike. There are significant differences in line intensity ratios and broad line profiles from object to object (Bachev et al. 2004; Marziani et al. 2010). More importantly, these differences can be organized in a systematic way as has been realized since the early 1990s (Boroson and Green 1992). Since then several authors stressed the importance of the so-called eigenvector 1 (E1) of quasars (e.g. Gaskell et al. 1999). Sulentic et al. (2000, 2007) expanded the E1 trends into a 4-dimensional space involving optical, UV and X-ray measures. They also defined spectral types along a sequence occupied by AGN in an optical plane involving Feii and FWHM H parameters. Objects at extreme ends of the E1 sequence are very different at almost all wavelengths and median spectra computed in spectral bins within this plane emphasize systematic changes in broad line properties (Sulentic et al. 2002, 2007). The differences have motivated the suggestion of a possible dichotomy between Narrow Line Seyfert 1 (NLSy1s) like sources and broader line objects that include almost all radio-loud quasars. The most effective divider of the two quasar types appears to be at FWHM of the H broad component H 4000 km s-1 for low-to-moderate luminosity sources (Marziani et al. 2009). This corresponds to to Eddington ratio 0.1 (Marziani et al. 2003b).
The distinction between NLSy1-like objects (hereafter Population A sources with FWHM(H) 4000 km s-1) and the rest of quasars (Population B with FWHM(H) 4000 km s-1) is of special relevance here. Pop. A sources show relatively low equivalent width lines with e.g. the 1900 blend 30 Å. A close analysis of the Ciii]1909 blend in the prototypical NLSy1 I Zw 1 shows strong Siiii]1892, and Aliii1860 blended with rather weak Ciii]1909 along with prominent Feiii(UV34)(1895.5, 1914.0, and 1926.3) and Feii blends (Laor et al. 1997b; Vestergaard and Wilkes 2001). The Ciii]1909 line is apparently so weak that Feiii1914 may be the most prominent feature at 1910Å (cf. Hartig & Baldwin 1986). This interpretation is confirmed by detailed deblending of a source (SDSS J120144.36+011611.6) that can be considered a high luminosity analog of I Zw 1 (§7.1).
Median composite UV spectra of low- quasars show that Aliii1860 and Siiii]1892 are more prominent in 4DE1 spectral types A2 and A3. Bins A1, A2, A3 are defined in terms of increasing FeII4570 (see Fig. 1 of Sulentic et al. 2002). I Zw 1, although belonging to the extreme type A3 (Bachev et al. 2004) is not unique as a NLSy1, since the fraction of Pop. A sources in bin A3 and A4 is 20 % of all Pop. A sources in the sample of Zamfir et al. (2010). A significant number of extreme NLSy1 are not classified as quasars in SDSS and must be collected from the galaxy catalog (Hu et al. 2008).
1.3 Emission Line Diagnostics and BLR Properties
Emission lines and line ratios are used in diagnostic maps to estimate temperatures and electronic densities in galactic and extragalactic photoionized regions. Examples include HII-regions and galaxies with HII-region nuclear spectra where electron densities are less than cm-3. This method has been successfully applied to the narrow line region (NLR) in AGN. Application to the broad line quasars has yielded results that are difficult to interpret. One recent exception is the work by Maksuoka et al. (2008) who succeeded in analyzing the partly ionized region thought to emit most of the LILs in quasar spectra. They suggest that Oi 8446 and the Caii triplet are emitted by dense, low ionization gas probably located in the periphery of the BLR. If the electron density and ionization conditions are known it is possible to derive, with additional assumptions, the distance of the BLR emitting region from the central continuum source (as stressed earlier also by Baldwin et al. 1996).
The physical conditions of photoionized gas can be described by electron density , hydrogen column density , metallicity (normalized to solar), shape of the ionizing continuum, and the ionization parameter . The latter represents the dimensionless ratio of the number of ionizing photons and the electron density or, equivalently, the total number density of hydrogen , ionized and neutral.111In a fully ionized medium . We prefer to adopt the definition based on because it is the one employed in the CLOUDY computations. Both and are related through the equation
| (1) |
where is the specific luminosity per unit frequency, is the Planck constant, the Rydberg frequency, the speed of light, and can be interpreted as the distance between the central source of ionizing radiation and the line emitting region. Note that is the ionizing photon flux
| (2) |
If we know the product of and , we can estimate the radius of the BLR from Eq. 1. The dependence of on was used by Padovani & Rafanelli (1988) to derive central black hole masses assuming a plausible average value of the product . The typical value of was derived at that time from semiforbidden line Ciii]1909 which implied that the density could not be much higher than cm-3 (Osterbrock & Ferland 2006). Padovani (1988) derived an average value from several sources where had been determined from reverberation mapping, and for which the number of ionizing photons could be measured from multiwavelength observations. The average value was then used to compute black hole masses for a much larger sample of Seyfert 1 galaxies and low- quasars (Padovani & Rafanelli 1988; Padovani, Burg & Edelson 1989). Wandel, Peterson & Malkan (1999) compared the results of the photoionization method with the ones obtained through reverberation mapping, found a very good correlation for the masses computed with the two methods, and concluded that “both methods measure the mass of the central black hole.”
1.4 Outline of the paper
The importance of the product goes beyond knowledge of the physical conditions in the BLR if it can lead to estimates of BLR radius and black hole mass. This paper identifies suitable emission line ratios that overcome some of the major problems in the analysis of emission lines of quasars. It also defines a photoionization method that can be applied to even the highest redshift quasars making use of high S/N near-IR spectroscopic data. In §2 we present the spectra of 8 pilot sources obtained with the VLT/FORS; in §3 we discuss data reduction; In §4 we describe our method of fitting broad emission line profiles; in §5 we give a phenomenological interpretation of the profile fits; in §6 we describe a method for deriving BLR physical conditions and give the results of our fits; in §7 we discuss two sources not belonging to our sample that show extreme behavior and that are helpful to understand more common quasar spectra; in §8 we give the results for the photoionization method; in §9 we derive the radius of the BLR (its distance from the ionizing source) and the mass of the black hole for each quasar in our sample; in §10 we discuss our results; finally, in §11 we summarize our results and the prospect of a more extended application of our method. All the computations were made considering =70 km s-1 Mpc-1 and a relative energy density and .
2 Observations
Data were obtained between Nov. 2006 and Jan. 2007 using the VLT2/FORS1 telescope operated in service mode. FORS1 is the visual and near UV focal reducer and low dispersion spectrograph of the Very Large Telescope (VLT) operated by European Southern Observatory (ESO) (Appenzeller et al. 1998). Our VLT sample consists of 8 quasars with . In Figure 1 we show the spectra uncorrected for redshift. Tab. 2 provides a log of observations that is organized as follows.
Column 1: object name, Col. 2: apparent B magnitude, Col. 3 redshift, Col. 4: line(s) used for redshift estimation: a) Oi1304.8, b) Ciii]1909; Col. 5: absolute B magnitude, Col. 6 flux at 6 cm taken from FIRST (Far InfraRed and Submillimetre Telescope), Col. 7: date (refers to time at start of exposure), Col. 8: Digital Integration Time, Col. 9: number of exposures with integration time equal to DIT, Col. 10: airmass at the beginning of each exposure, Col. 11 in the continuum around 1700Å.
The observation of one of our 8 quasars, J00521-1108, yielded only a low S/N spectrum which we retain because observed features in the blend at Å are clear enough to fit the individual lines. Two sources, J01225+1339 and J02287+0002, are BAL quasars. We will keep them separate because Civ1549 is severely affected by absorption.
3 Data Reduction
Data were reduced using standard iraf tasks. All spectra were wavelength and flux calibrated in the observed frame and then corrected for Galactic extinction. Flux correction was applied using meteorological data provided by ESO. The observed flux was multiplied by the inverse of the light lost computed from the ratio seeing over slit width in arcsec. Correction to rest frame requires estimating the redshift which is not a trivial task as outlined below. Rest frame correction also involved scaling the specific flux in flux per unit wavelength interval by a factor . Measurements were carried out on the rest-frame spectra. It is necessity to describe below two important aspects of the data reduction.
3.1 A & B Atmospheric Bands Correction
The A or B atmospheric band falls on top of the 1900Å blend in many of the spectra. This is an important region for this study especially because it involves Siiii]1892, Aliii1860, and Siii1814. In order to remove these absorption features we created an A+ B band template from standard star spectra used as specific flux calibrators. We scaled this template to find a best fit. Fig. 1 shows the A and B absorption correction where we make a line identification to illustrate which lines are affected. In cases where the A or B bands overlap a weak line like Siii1814 the effect is considerable and measures of Siii1814 should not be considered at all or with extreme care. This happens for sources J00103-0037, J03036-0023, and J20497-0554. In cases where one of the bands overlaps a stronger line like Siiii]1892 or Aliii1860, the correction was good enough to permit accurate measures.
3.2 Redshift Estimate
Normally one uses strong narrow emission lines to set the rest frame in a quasar. In our case no strong narrow lines are available so we consider the peaks of Ly, Civ1549 and Ciii]1909. The Ly peak is affected by absorption and Civ1549 is a HIL feature often showing blueshifts and/or asymmetries (Gaskell 1982, Espey et al. 1989, Corbin 1990, Tytler & fan 1992; Marziani et al. 1996; Richards et al. 2002, Baskin & Laor 2005; Sulentic et al. 2007). This is especially true in Pop. A sources. Ciii]1909 is blended with Siiii]1892 and Feiii that is especially prominent in this region and could well affect the peak. Pop. B sources show a rather weak Fe spectrum making the Ciii]1909 peak a more reliable estimator.
Our best option is to use the low ionization line Oi1304 whenever it is strong. However it is blended with low ionization Siii1304,1309 (). Both Oi1304 and Siii1304,1309 are broad lines and in Pop. B sources might show large redshifts or even significant blueshifts. Simulations in the (, ) region of interest show Oi1304 2 Siii1304,1309 and this is confirmed in the spectrum I Zw 1 where Oi1304 and Siii1304,1309 are resolved. The two components of the Siii1304,1309 doublet are set to the same intensity (i.e., we assume an optically thick case). We model the blend Oi1304 + Siii1304,1309 with 5 Gaussians; the three components of the Oi feature are produced by Bowen florescence mechanism, and should show ratios consistent with their transition probabilities. Generating a model spectrum in iraf (lines broadened to 4000 km s-1) yields a rest frame peak wavelength of 1304.8 0.2 Å (in vacuum) which we use as a reference for our VLT spectra assuming that there is no hint of systematic BC shifts as is the case for all Pop. A sources (the majority in our sample) and many Pop. B sources (Marziani et al. 2003a).
Examination of Fig. 2 reveals that the peak of Oi1304 in source J00521-1108 is not observed clearly. We use Ciii]1909 to set the rest frame in this case. There are other sources J00103-0037, J02287+0002, J02390-0038 and J20497-0554 where the redshift estimation using both Oi1304 and Ciii]1909 are not in good agreement. The largest disagreement was found for J02287+0002. Redshifts obtained for the three remaining quasars, J01225+1339, J03036-0023 and J23509-0052, were obtained from Oi1304. Fig. 3 shows the deredshifted VLT-FORS spectra for our sample of 8 quasars.
4 Data Analysis
4.1 Methodological Considerations on Multicomponent Fits
The specfit IRAF task (Kriss 1994) allows us to fit the continuum, emission and absorption line components, Feii and Feiii blends, etc. We fit two spectral ranges: (1) 1450–1680 Å for analysis of Civ1549 and (2) 1750–2050 Å for analysis of the 1900 Å blend. Significant Feii and Feiii emission are expected close to and underlying the 1900 Å blend. Study of the 1900 Å blend is especially difficult in quasars because the lines are broad and the blending severe. We therefore need to take advantage of several previous results.
4.2 Feii and Feiii Emission
Our approach is completely empirical and employs an Feii + Feiii template taken from templates successfully used in previous works. Our Feii template is based on a CLOUDY simulation and is not very far from the preferred model of Bruhweiler & Verner (2008).
Feiii lines are common and strong in the vicinity of Ciii]1909 as is evidenced by their presence in average LBQS (Francis et al. 1991) and SDSS (Vanden Berk et al. 2001) spectra. They appear to be strong when Aliii1860 is also strong (Hartig and Baldwin 1986). Vestergaard & Wilkes (2001) produced an Feiii template based on the UV spectrum of I Zw 1. Since then, Sigut et al. (2004) have modeled the Feiii BLR spectrum. See also Verner et al. (2003) for a plot of emission around 1900 Å. Ly pumping enhances Feiii (UV 34)1914.0 (Johansson et al. 2000) and this line can be a major contributor to the blend right on the red side of Ciii]1909 (see Fig. 2 of Vestergaard & Wilkes). We reproduced the option B of the empirical Feiii template of Vestergaard & Wilkes (2001), taking advantage of the line identifications from Ekberg (1993). When detected we can use Feii UV 191 to set a rough Feii level while the feature at 2080 Å is helpful for a more precise estimation of the intensity of Feiii. The continuum was fitted using the regions around 1450Å (1750 and 1960Å) that are relatively free of Feii emission (Vanden Berk et al. 2001). We used the same power-law to describe the continuum at both the Civ1549 and 1900Å regions.
4.3 Line Components
We base our specfit analysis on several previous observational results. The most important ones are as follows:
-
•
Sulentic et al. (2002) gridded the broad component of FWHM HBC versus =W(Feii4570blend)/W(HBC) parameter plane into bins of fixed FWHM = 4000 km s-1 and = 0.5. Quasar spectra in different bins are different in many measures. As mentioned earlier, the largest differences are found between NLSy1-like objects, Pop. A, and broader sources of Pop. B with FWHM(H) 4000 km s-1. The gridding of Sulentic et al. (2002) is valid for low (0.7) quasars. At higher an adjustment must be made since no sources with FWHM H km s-1 exist above luminosity ergs s-1 (Marziani et al. 2009).
-
•
Median spectra were computed for spectral bins from the atlas of Marziani et al. (2003a) who found that H can be described by a Lorentz function in Pop. A sources and by the sum of 2 Gaussians in Pop. B sources (unshifted + broader redshifted components) (Zamfir et al. 2010; Marziani et al. 2010).
-
•
A careful Feii subtraction reveals a blue-shifted H component in some bin A3 sources (i.e. the stongest Feii emitters; Zamfir et al. 2010).
-
•
Civ1549 (HIL) and H (LIL) profiles show significant differences in Pop. A. Large Civ1549 blueshifts ( km s-1) are observed in Pop. A only (Sulentic et al. 2007). HIL and LIL profiles are more similar in Pop. B sources.
-
•
We do not have H observations for our high- objects since there are no near IR spectra. We use the results of Marziani et al. (2003b, 2010): they show that the BC of Siiii]1892, Aliii1860 and Civ1549 lines is similar to the one of H, including the FWHM and profile shape, either Gaussian or Lorentzian. The similarity helps us to define whether an object is Population A or B in this paper.
These observational results point toward three different components in broad line profiles (see Marziani et al. 2010) which can be described as follows:
-
1.
A broad component (BC) showing a roughly symmetric profile with FWHM in the range 1000-5000 km s-1. It is consistent with the component identified by Matsuoka et al. (2008). This broad component dominates LILs in Balmer lines of Pop. A sources while it becomes less prominent in Pop. B. The profile is best modeled by a Lorentzian function in Pop. A sources while Pop. B profiles are better described by a Gaussian (Marziani et al. 2003b).
-
2.
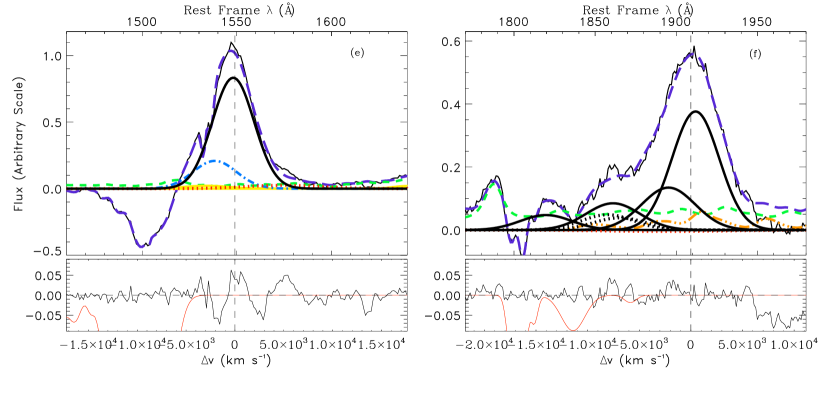
A very broad component (VBC), as seen in LILs and HILs of most pop B sources but is absent from Pop. A profiles. The VBC can be modeled as a Gaussian (FWHM 10000 km s-1) often with a significant shift to the red. It can be called a defining property of Pop. B sources (Marziani et al. 2010). This component is clearly identified in the Civ1549 line of Pop. B objects, and is also appreciable on the red side of Ciii]1909 of Pop. B objects J00103-0037 and J02390-0038.
-
3.
A blueshifted broad component (BBC), defined as the residual emission in the Civ1549 line after subtracting a scaled BC Lorentzian profile (Marziani et al. 2010). This blueshifted component is often prominent in Civ1549 and Ly of Pop. A sources. It is much less intense in radio-loud Pop. B sources (Marziani et al. 1996; Punsly 2010; Richards et al. 2010). We model this profile as a blueshifted Gaussian. The Gaussian approximation is probably inappropriate especially if the BCC is strong: this component is believed to be produced in a partially-obscured radial flow, not in a virialized emitting system. In the present work we do not even try to fit the blueshifted in the doubly ionized lines. It is quite obvious from the fits that a possible contribution of this component would be negligible.
Baldwin et al. (1996) presented a similar analysis. Their Fig. 2 organizes spectra in a sequence that is roughly corresponding to E1, going from Aliii1860-strong sources to objects whose spectra show prominent Ciii]1909 along with weak Aliii1860 (Bachev et al. 2004). Two of the three line components they isolated correspond to the ones we consider in this paper: a blue-shifted feature, and a more symmetric, unshifted and relatively narrow component that we call LIL-BC. Less obvious is the correspondence of a third feature, although it appears to be the redshifted part of what we call the VBC.
Several improvements have been introduced since the paper of Baldwin et al. 1996. These improvements are expected to make our analysis easier. First, the definition of a template of Feiii emission (Vestergaard & Wilkes 2001), along with the possibility to model Feii in the 1400–2000 Å spectral region with cloudy (Verner et al. 1999, 2004). The analysis of spectra along the E1 sequence allows one to see trends that make the interpretation of the emission line blends easier (Marziani et al. 2010).
4.4 Expected emission from the various components
We looked for evidence of three possible components as described above: BC, VBC and BBC only for the most intense HILs: Civ1549 and Siiv1397. We did not include the contributions of the BBC for the doubly-ionized lines. In the case of Pop. A sources, we indeed assume that the BC contains the vast majority of the light. In the case of Pop. B sources we consider the contribution of the VBC. The Aliii1860 doublet shows no evidence of either a BBC or VBC. There is no obvious BBC for Siiii]1892 in the blend. There is evidence of a VBC of Ciii]1909 extending on the red side of the blend, and this is taken into account. Moreover, we expect that the Aliii1860 doublet is emitted exclusively in the BC, the region where Feii is also emitted. This is empirically confirmed by the aspect of the 1900 blend in many sources, where we do not see any evidence of BBC nor VBC. We remark that the Aliii1860 doublet is relatively unblended, and that a BBC feature as strong as in Civ1549 would not easily escape visual detection.The same is also true for Siiii]1892. Several fits that included BBC in Ciii]1909 yielded 0 intensity, implying a large Civ1549/Ciii]1909 (Marziani et al. 2010). The Siiv1397 + Oiv]1402 blend closely resembles the shape of Civ1549, suggesting that BBC is relevant, especially for Siiv1397 (Oiv]1402 is expected to give a minority contribution to line emission at the high density derived for the BC; any Oiv]1402 contribution to the BBC is not relevant to our method). BBC is very weak or undetectable in the vast majority of the H profiles analyzed in Marziani et al. 2010 (but see Zamfir et al. 2010 for several cases of H BBC), while prominent in Ly; the Ly/H ratio in this component is high. In summary, BBC is visually strong in Ly, Civ1549, and Siiv1397. Heii1640 in BBC is needed for a self-consistent fit of the Civ1549+Heii1640 blend. The VBC of Siiii]1892 is poorly constrained, but in the fits where Ciii]1909 VBC is visible, we always find Siiii]1892 Ciii]1909, consistent with the high ionization level expected in the VBC region. Some Siiv1397 VBC emission is assumed in the Pop. B fits. No VBC emission is expected in Aliii1860 and Feii. These constraints help also to make the fits less ambiguous.
The absence of a VBC makes the decomposition of Pop. A spectra easier. As said earlier, the Feii intensity scale of the template (but Feii is in general weak) is anchored to the UV 191 intensity; similarly the Feiii intensity is set by a feature external to the 1900 Å blend (2080 Å). There is no evidence of BBC of Aliii1860 and Siiii]1892; the Aliii1860 doublet profile is mostly unblended and defines the LIL-BC. The additional complication here is the Feiii 1914 line whose intensity is affected by Ly pumping. Since the shift and FWHM are assumed the same for all lines (and templates) in the 1900 blend, the only free parameters in addition to shift and FWHM are the intensities of 6 components, including the two from the templates, and Siii1814 and Aliii1860 that are not heavily blended. The specfit analysis is especially helpful to measure in a non-subjective way, taking all constraints into account, the two parameters that are most affected by the blend: the intensity of Siiii]1892 and Ciii]1909 (we repeat that any Feiii 1914 contribution in excess to the one of the adopted template is included in the estimated Ciii]1909 intensity).
In the case of Pop B, the presence of a VBC does not really complicate the fit as a matter of fact. The Ciii]1909 line undeniably shows a VBC protruding on the red side of the 1900 blend. In any case, considering that we can expect the VBC to be assimilable to a shifted Gaussian with FWHM km s-1, the unblended part of the Ciii]1909 VBC provides a strong constraint. The Siiii]1892 VBC is certainly the most difficult feature to ascertain, as it buried under Siiii]1892 and Ciii]1909 emission. We rely on the specfit results. that indicate negligible Siiii]1892 VBC.
4.5 Errors
We identify five sources of error from the conditions for data reduction and methodological considerations described above:
-
1.
A & B atmospheric bands correction (already described in §3.1).
-
2.
Line profile shape, Gaussian or Lorentzian (Pop. A or B). The distinction between Pop. A and B is based on line width with the boundary at FWHM H km s-1 in low luminosity quasars and around 5000 km s-1 at higher luminosity such as the eight sources presented here. Most of our quasars are unambiguously Pop. A or B because of line width and because Pop. B sources show an H VBC and pop A sources a prominent Civ1549 BBC. In these cases only one profile shape (Gaussian or Lorentzian) was fitted.
-
3.
Rest-frame determination using Oi1304 or Ciii]1909. In some cases the redshift estimates derived from the two lines do not agree, most likely because of absorptions present in Oi1304.8 and because this is not a very intense line. The principal impact of uncertainty in the rest frame placement is estimation of the peak wavelength of Civ1549. If the line peak differs from 1549Å, the BC intensity is diminished and we infer a greater contribution from the blue (BBC) component. Similarly, for the blend 1900Å, the rest frame shift may increase or decrease our estimate for the strength of Ciii]1909 with consequent decrease or increase of the Siiii]1892 contribution. This additional source of uncertainty affects J00103-0037, J02287+0002 and J20497-0554.
-
4.
Feii intensity (continuum placement). Broad Feii emission can produce a pseudo-continuum affecting our estimates of emission line intensities. Siii1814 is especially affected in our spectra because it is weak. Aliii1860 is similarly affected when it is weak. The effect is less noticeable for Civ1549 since expected Feii emission underlying the Civ1549 line is weak also for strong Feii emitters.
-
5.
Broad absorption lines (BALs) in quasars principally affect the blue side of Civ1549. We also find an absorption feature between FeII1787 and Siii1814 (eg. Fig. 6). In sources J01225+1339 and J02287+0002 we can only set upper limits for line intensities (since we fit unabsorbed components).
There are other sources of error such as small BC shifts and FWHM variations. We assume that the BC of the Siiii]1892, Aliii1860, Siii1814 and Civ1549 line has the same FWHM and wavelength shift, although we allow for variations in their relative flux strengths and adopted profile type (Lorentzian for Pop. A and Gaussian for Pop. B). For Feiii(UV34) and Feii we slightly relax this constraint. The Feiii(UV34) and Feii emission is not very strong and the FWHM of individual features is poorly constrained by specfit. In the case of Ciii]1909 we need to consider the possibility that the profile is narrower because there might be a contribution from different regions: indeed, the specfit routine usually converges toward a narrower profile if the Ciii]1909 width is not constrained. The effect depends on the strength of the Feiii 1914 feature.
The goal of this study is to estimate diagnostic line ratios. A posteriori, we can say that the estimated line ratios are rather insensitive to the emission component profile shape: assuming a Gaussian or Lorentzian profile yields the same ratio for the strongest lines (i.e., Civ1549, Siiii]1892, Aliii1860) upon which our analysis is based (with an uncertainty of 10%). The same conclusion applies to the redshift uncertainty. Only in the case of J02287+0002 the redshift difference produces a significant effect due to a . However, we adopt the fit based on Oi1304: the alternative fit produces line ratios that are of not obvious interpretation and at variance with respect to the other sources. The most serious sources of error remain effects of A/B band overlap for Siii1814 and the presence of a BAL for Civ1549.
5 Results of Line Component Analysis on Individual Objects
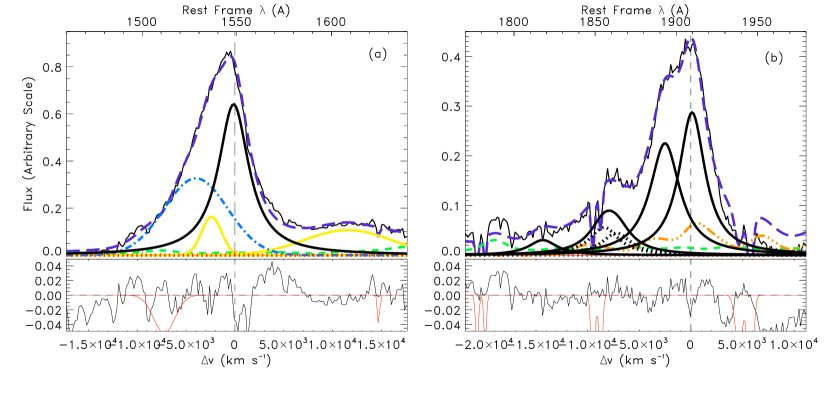
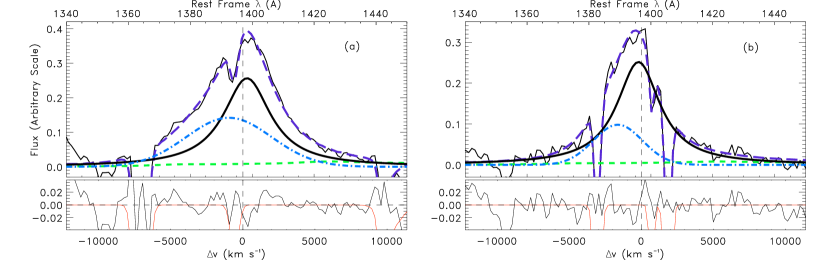
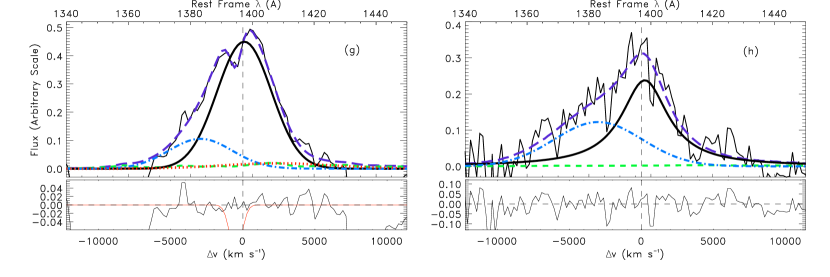
In Figures from 4 to 6 we show our best fits for the VLT sample taking into account the considerations described in §4. The fits of Siiv1397 are shown in Fig. 7 and the intensity values and equivalent widths are in Tables 3 and 5. We present here a phenomenological description of the fits. The line profiles, intensities and line ratios usually follow the trends of Pop. A or B sources, although in some objects there are features that are ambiguous (for example the line shape). In these cases however, we have assigned Pop. A or B type on the basis of the FWHM (see Cols. 5 and 6 of Table 7).
5.1 Pop. A Objects
-
•
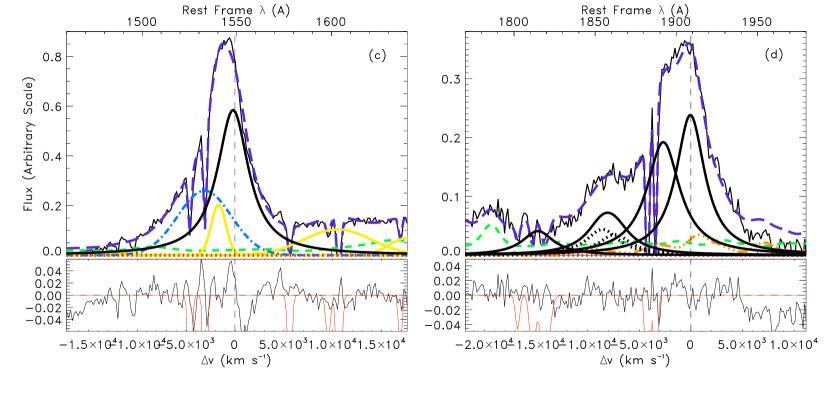
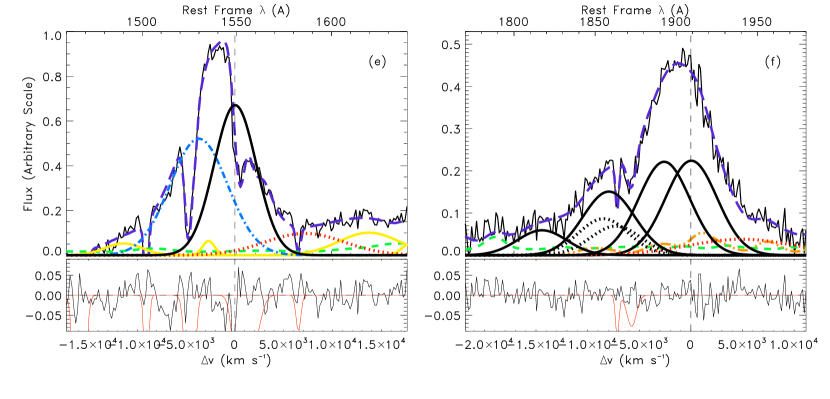
J03036-0023 – We estimate for this source a FWHM(BC)3700 km s-1 and we use a Lorentzian function to fit the broad lines. The peak of Civ1549 is blueshifted and requires a strong BBC (Fig. 4(a)). The bump on the red side of Civ1549 can be accounted for by Heii4686 BC and BBC. There is no evidence for a red shifted component in Ciii]1909 (Fig. 4(b)). Aliii1860 is prominent. Unfortunately the blue wing of Siii1814 and the red wing of Feii1787 are affected by A band absorption.
-
•
J20497-0554 – This source shows FWHM(BC)3800 km s-1. As for J03036-0023, the Civ1549 line can be accounted for by an unshifted BC (assumed Lorentzian) of a considerably contribution of a BBC (Fig. 4(c)). We see a prominent Aliii1860 line and FeII1787 (Fig. 4(d)). Siiii]1892 is affected by several narrow absorption lines; however, it is obviously strong. The lack of a red wing on Ciii]1909 suggests that no VBC is present.
-
•
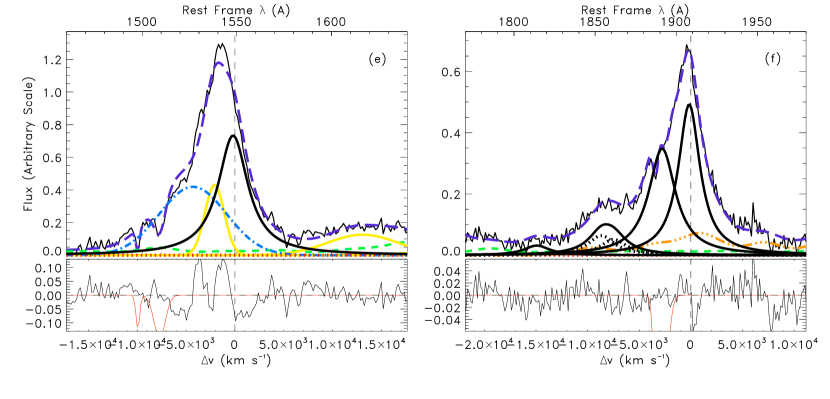
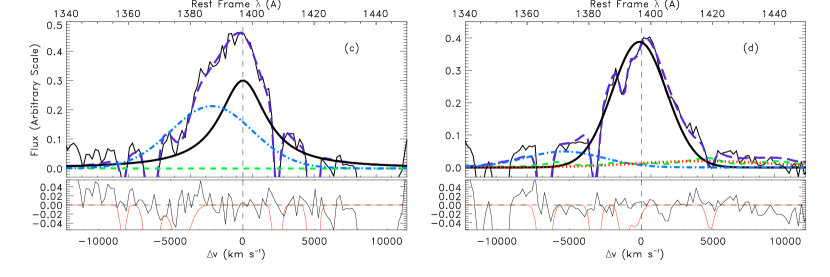
J23509-0052 – This source has FWHM(BC)3600 km s-1. Civ1549 shows a slight blue asymmetry with a BBC (Fig. 4(e)) required to model it. The contribution of Feii is small and Feii1787 is weak (Fig. 4(f)). Ciii]1909 is very strong. Aliii1860 is affected by A band absorption; the profile we fit is probably an upper limit. This object could well belong to spectral type A1 that includes Pop. A sources with the lowest ().
5.2 Pop. B Objects
.
-
•
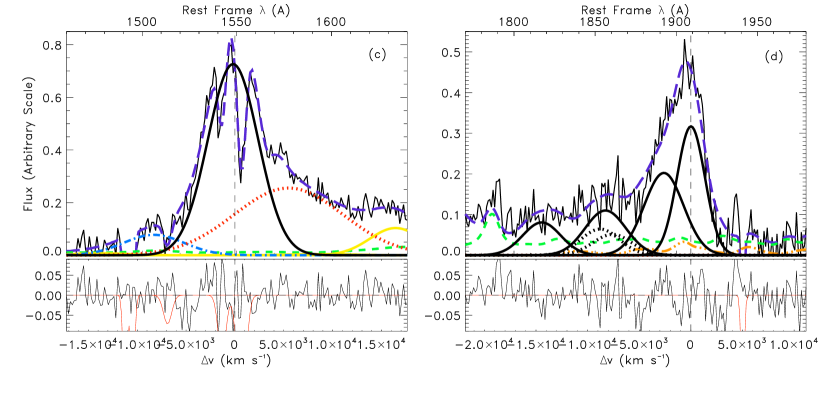
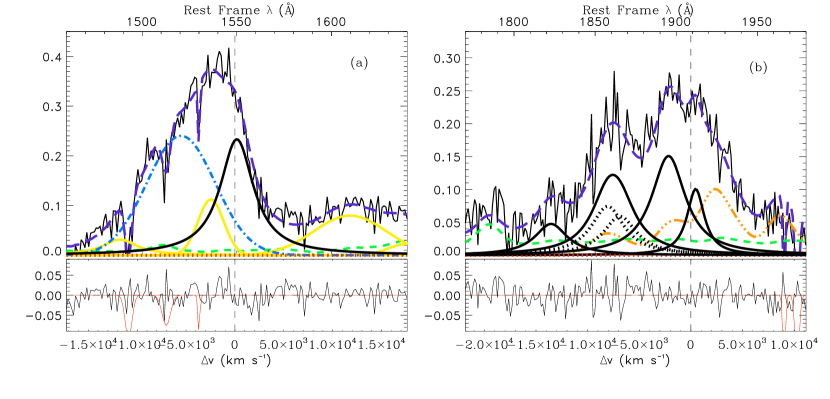
J00103-0037 – This source has a FWHM(BC)4500 kms-1. The red side of Civ1549 is blended with Heii4686. Fitting a BC with no shift plus a BBC to Civ1549 leaves a very large residual on the red side. A very broad redshifted component (VBC) is needed to model the spectrum (Fig.5 (a)). The faint narrow line under Civ1549 can be explained as the narrow component (NC) of Civ1549(see Sulentic et al. 2007). The presence of a similar NC in Ciii]1909 could possible explain the large residual seen 1900. We specifically note the prominent Ciii]1909 emission and weak (but detected) Aliii1860 (Fig. 5(b)). The Feii “bump” at 1787 Å(UV 191) is appreciable. Fainter Feii emission is relatively unimportant because Feii creates a pseudo-continuum. Siii1814 is compromised by A-band absorption. The blend at 1900Å includes a Ciii]1909 VBC and the fit indicates Civ1549/ Ciii]1909 (VBC) 7 which is reasonable.
-
•
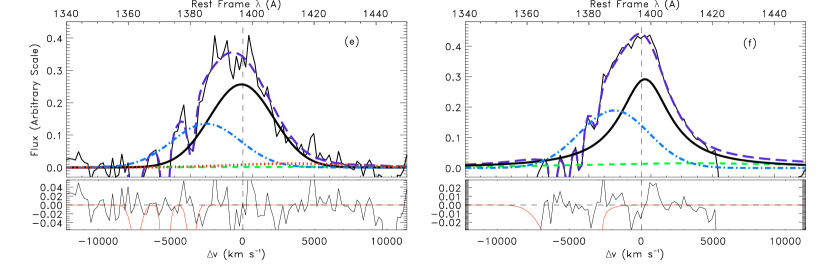
J00521-1108 – This source shows the noisiest spectrum in the sample. We fit a FWHM(BC) 5300 km s-1 with Civ1549 requiring a large VBC to account for the red wing. (Fig. 5(c)). Absorption features seriously affect the Civ1549 profile. The profile of Ciii]1909 is strongly asymmetric due to some sort of absorption on the red side. Aliii1860 is weak consistent with pop. B (Fig. 5(d)).
-
•
J02390-0038 – This objects has a somewhat atypical Pop. B spectrum due to a very strong BBC in Civ1549 (Figure 5(e)). This source has a FWHM(BC) 5400 km s-1. Consistent with pop. B we find Feii1787 to be weaker than Siii1814. Ciii]1909 is flat topped and has a very similar intensity as Siiii]1892. Both Civ1549 and Ciii]1909 it show red wings indicating VBC emission. The A band absorption lies between Siiii]1892 and Aliii1860 (Fig. 5(f)) producing a possible overestimation of Aliii1860.
5.3 BAL QSOs
-
•
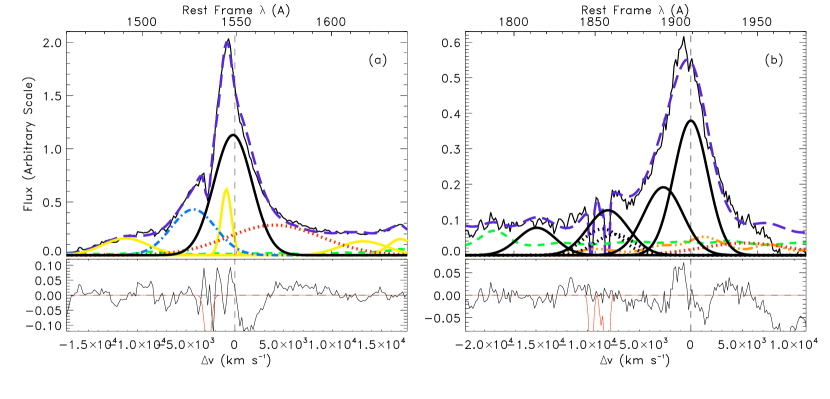
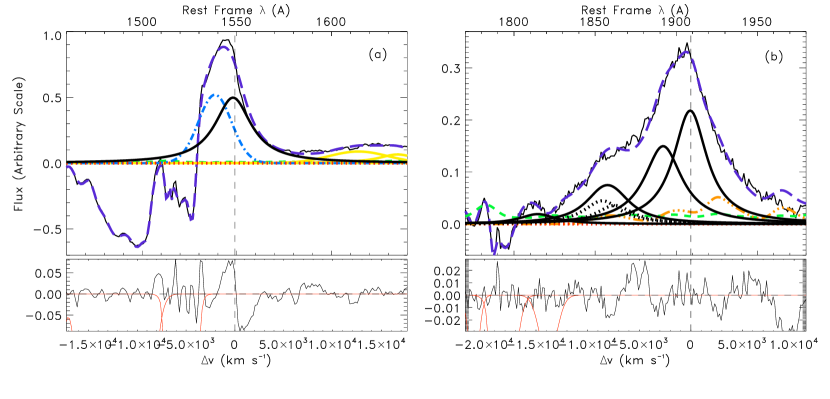
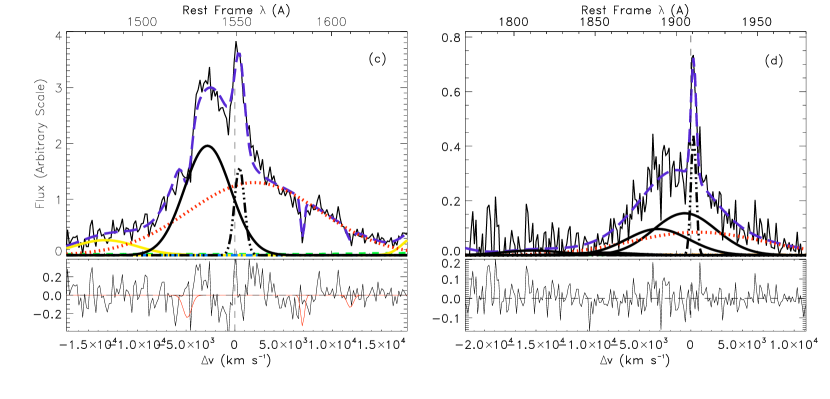
J01225+1339 – Civ1549 is highly affected by two broad absorption lines (Fig. 6(a)) with blueshifts of 5200 and 10800 km s-1 at peak absorption with equivalent widths/FWHM -12Å / 3900 km s-1 and -25Å/5200 km s-1, respectively. The blueshift of the Civ1549 peak leads us to suspect a large blueshifted BBC emission component. The 1900 Å blend shows absorptions coincident with Feii1787 and the blue side of Siii1814 which is however unambiguously detected (Fig. 6(b)). Aliii1860 is prominent which implies that this a Pop. A source. The FWHM(BC) 4400 km s-1 is consistent with a high-luminosity Pop. A source. It is also possible that this BAL QSO is an outlier like Mark 231 at low- (Sulentic et al. 2006), in other words an extreme Pop. A object. The Ciii]1909 is well fitted with a Lorentzian profile. Broad A band atmospheric absorption lies over Siiii]1892.
-
•
J02287+0002 – This object has a very complex spectrum. On one side it has a FWHM(BC) 4700 km s-1 which is typical of low-luminosity Pop. B and the lines profiles are better fitted with Gaussians. On the other side, however, it shows features that are typical of extreme Pop. A sources: prominent Feii1787, strong Aliii1860, no Ciii]1909 VBC (Fig. 6(d)). Considering that the FWHM limit between Pop. A and B is increasing with luminosity, the FWHM(BC) is within the limit of Pop. A. The Ciii]1909 line is not very flat topped but the similar intensities of Ciii]1909 and Siiii]1892 remind the case of J02390-0038. Also because it has a strong blue-shifted component in Civ1549 atypical to Pop. B objects (Fig. 6(c)).
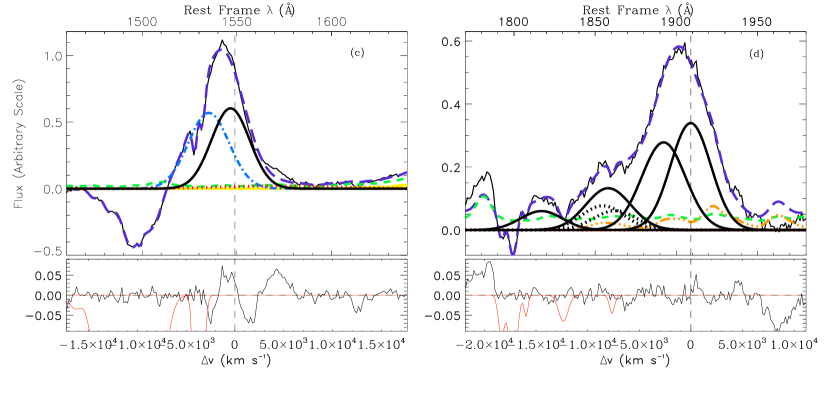
The estimated rest frame of this quasar differs by 1400 km s-1 using Oi1304 and Ciii]1909. This is the largest discrepancy in our sample. In order to evaluate the effect of the discrepancy we performed two fits using both rest frames. Figs. 6(a) and (b) use the Ciii]1909 restframe. In the 1900 Å blend, we found a contribution of Siiii]1892 similar to Ciii]1909. If we use the Oi1304 inferred rest frame we show in Figs. 6(e) and (f) that Ciii]1909 becomes stronger with a resultant decrease of Siiii]1892. A similar effect occurs for Civ1549 broad and blue-shifted components.
The Civ1549 BAL shows a blueshift of 9100 km s-1at deepest absorption, a EW of –14 Å and a FWHM of 4600 km s-1.
Summing up, we are able to assign an A/B identification to all sources in our sample. The two BAL QSOs appear as objects of extreme Pop. A. We remind that the identification of Ciii]1909 in the BAL QSOs and in sources with strong Aliii1860 is debatable (Hartig and Baldwin 1986): strong Feiii 1914 could take the place of most Ciii]1909 emission.
6 Estimation of Physical Conditions in the Emitting regions
6.1 CLOUDY Simulations
We computed a multidimensional grid of CLOUDY (Ferland et al. 1998) simulations, (see also Korista et al. 1997) to derive and from our spectral measurements. Simulations span the density range , and , in intervals of 0.25. Each simulation was computed for a fixed ionization parameter and density assuming plane parallel geometry. The 2D grid of simulations was repeated twice assuming and cm-2. Several cases were computed also for = cm-2. Metallicity was assumed to be either solar or five times solar. Two alternative input continua were used: 1) the standard AGN continuum of CLOUDY which is equivalent to the continuum described by Mathews and Ferland (1987) and 2) the low- quasar continuum of Laor et al. (1997a). Computed line ratios are almost identical for fixed (, ). However the ionizing luminosity differs by more than a factor of 2 for a fixed specific continuum luminosity. The contour plots showing the distributions of Ciii]1909/ Siiii]1892, Aliii1860/ Siiii]1892, Siii1814/ Siiii]1892, Siiv1397/ Siiii]1892, Civ1549/Aliii1860and Civ1549/ Siiii]1892 (Fig. 9) are generated from 29 19 = 551 simulations and assume a standard set of simulations using a Mathews and Ferland (1987) continuum, cm-2, and solar metallicity. The CLOUDY 08.00 computations included a model of the Fe+ ion with 371 levels. The UV Feii template, described in §4.2 is based on a suitable CLOUDY simulation. Even if a relationship is very likely between the dense low ionization gas producing our diagnostic lines and Feii emission (supported observationally) our diagnostics do not use any Feii computation. The weak line Oi1304 is used only for rest frame estimation and not for diagnostic considerations.
Apart from the hypothesis of plane-parallel geometry, no inferences are made about the actual distribution, location, and kinematics of the line emitting gas. The assumption of constant density is crude. If gas is distributed in clouds then magnetic confinement appears to be unnecessary to avoid cloud dispersion from pressure imbalance or cloud shear associated with a hot confining medium. Magnetic confinement could make density uniform within the cloud (Rees 1987; Bottorff and Ferland 2000).
6.2 Intermediate Ionization Lines in the Blend at 1900
The ratio Ciii]1909/ Siiii]1892 is density dependent because the transition probabilities of the two lines are so different: 114 s-1 vs 12600 s-1 (see Table References). The forbidden lines at 1883Å and 1907Å have such low transition probabilities that they are collisionally quenched at much lower density and will not be considered. Line ratios like Ciii]1909/ Siiii]1892 are useful diagnostics in a rather narrow range of density which depends on the transition probabilities. Above the critical density, emission lines originating from forbidden or semi-forbidden transitions become collisionally quenched, and hence weaker than lines for which collisional effects are still negligible. Ciii]1909 is clearly unsuitable as a diagnostic for cm-3, as the Ciii]1909/ Siiii]1892 0. Feldman et al. (1992) gives critical density of Siiii]1892 cm-3. Aliii1860 is a permitted transition with large transition probability ( s-1) and has very-high critical density (i.e., its equivalent width goes to zero toward thermodynamic equilibrium, which occurs at very high density, when all line emission is collisionally quenched). Our 2D array of CLOUDY simulations shows that the ratio Aliii1860/ Siiii]1892 is well suited to sample the density range cm-3. Within this range the Siiii]1892 intensity decreases smoothly by a factor 10; above the upper limit in density, the predicted intensity of Siiii]1892 decreases. This corresponds to the densest, low ionization emitting regions likely associated to the production of Feii.
Intermediate-ionization lines such as Ciii]1909, Aliii1860, Siiii]1892 and Siiv1397avoid the issue of collisional ionization (invoked for the production of low-ionization species by S. Collin and collaborators, as mentioned in the introduction).
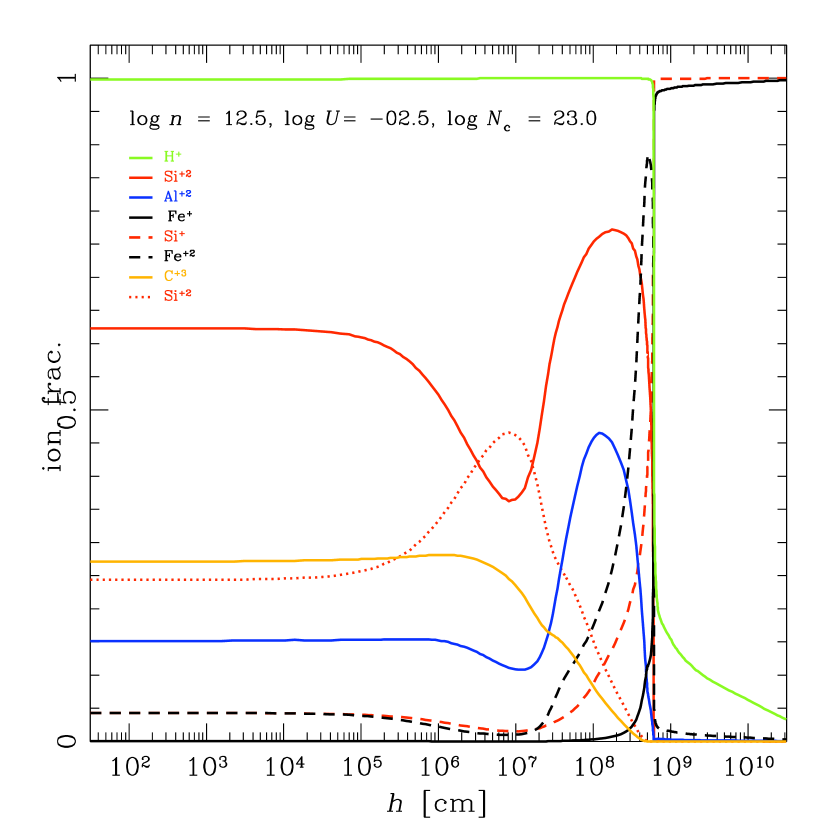
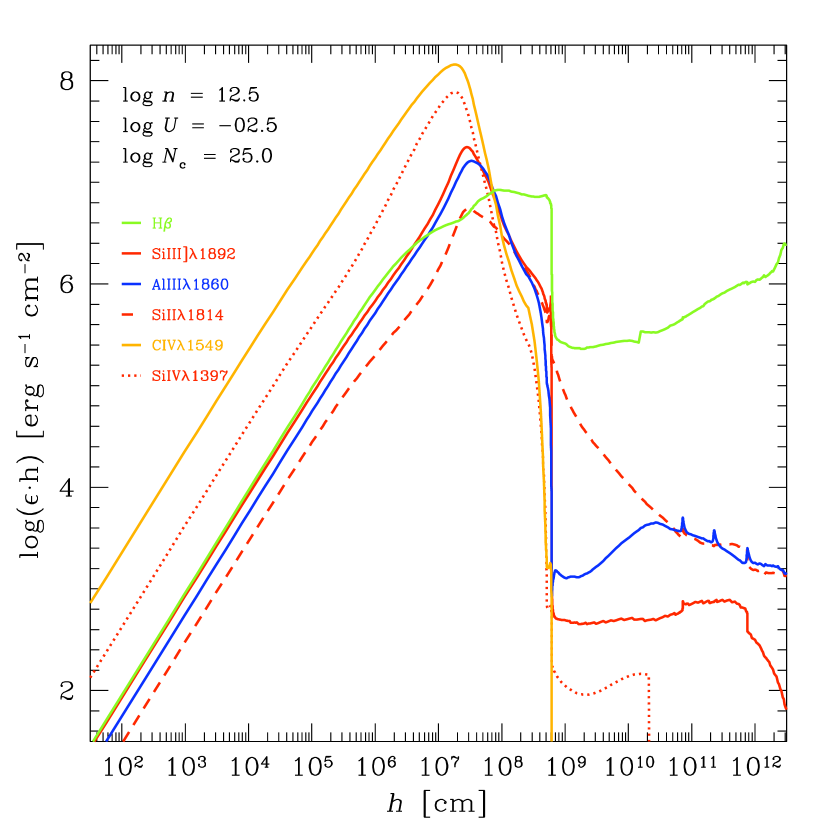
The widely separated doublet Aliii1860 is expected to be produced entirely in the fully ionized zone (Laor et al. 1997b). CLOUDY simulations confirm this suggestion. Figure 10 (top panel) shows the ionic fraction as a function of the geometrical depth in a cloud (or slab) of fixed column density ( cm-2) and density (cm-2). As it can be seen, Al++, Fe++, and Si++ share a region of dominance deep in the cloud, close to the end of the Strömgren sphere. Beyond, in the partially-ionized zone (PIZ) there is, as by definition, a significant fraction of ionized hydrogen. The dominant ionic stages of Si and Fe become Fe+ and Si+. It is very appropriate to consider the Aliii1860/ Siiii]1892 ratio since the two lines are apparently emitted in the very same zones within the gas slab. Available reverberation mapping results may support this interpretation but are rather difficult to extrapolate since they are limited to an handful of low luminosity objects. The main finding is that Ciii]1909 responds to continuum changes on timescales much longer than Civ1549 and other HILs. This results comes from the analysis of total Ciii]1909 + Siiii]1892 in NGC 3783 (Onken & Peterson 2002), from the Ciii]1909 of NGC 4151 (Metzroth et al. 2006) and of NGC 5548. It is intriguing that the Ciii]1909 cross-correlation delay in NGC 5548 (by far the best studied object) is even larger than that of H (32 ld vs. 20 ld; Peterson et al. 2002; Clavel et al. 1991). For fixed density, lines of higher ionization form at higher photon flux. The C+, Al+, Si+ ionization potential are 24, 18, and 16 eV respectively. These comparable ionization potentials are well below the one of HILs, 50 eV. However, the much lower Ciii]1909 critical density implies that the Ciii]1909 line should be formed farther out than Siiii]1892 and Aliii1860 if all these lines are produced under similar ionization conditions.
6.3 The Siii Contribution to the UV Spectrum of Quasars
AGN have a rather rich singly-ionized silicon spectrum in the range 1000-2000 Å, due to several resonant transitions from the ground term to terms associated to the (1814 and 1304), (1531), (1263) electronic configurations. A feature on the red side of Ly, at 1263 Å is detected in several Pop. A sources like I Zw 1 (Marziani et al. 2010).
The 1309 feature is partially blended with the Oi triplet associated with a Bowen fluorescence mechanism from HI Ly. The 1309 line is well resolved in sources like I Zw 1 with the extension of the broad 1309 feature suggesting significant Siii emission around 1309. The 1531 feature is blended with Civ1549. High S/N spectra of low redshift sources from HST (Laor et al. 1994) as well as for quasars at 4 (Constantin et al. 2002) indicate that the feature is very weak in most sources.
The Siii feature at 1814 is detected in at least four of the five quasars studied by Laor et al. (1994). In the 6 objects used for the E1 sequence of Marziani et al. (2010), it is detected without reasonable doubt in I Zw 1 only. However this has to do more with the poor S/N of the 1900 Å region than of anything else; good S/N HST spectra show an unambiguous detection in Akn 120 and Mark 509, for example. Early detection of the UV Siii lines from IUE observations suggested collisional excitation and no relevant fluorescence effects (as observed in type Ia supernovæ; Dumont and Mathez 1981). Fluorescence effects and recombination are revealed by optical lines which are emitted through several cascade routes to the ground state. However, a median spectrum of A2 quasars with S/N 200 (Zamfir et al. 2010) barely detects any expected emission feature in the range 4000-6500 Å. The prominence of the 1814 feature may then be associated to the relatively low temperature believed to exist in the innermost part of the line emitting “cloud”, K. We may consider the equivalent width () ratio between the doublet lines at 1264 and at 1814 Å both due to a transition; in the simplest case we have: if , where is the oscillator strength, are the density of the upper electronic levels giving rise to the two lines, and the energy difference between the transitions is 3 eV.
6.4 Use of Siiv1397, Civ1549 and Siii1814
The same caveats mentioned for the ratio Ciii]1909/ Siiii]1892 apply to the Aliii1860/ Siiii]1892 ratio as well. The ground term has energy 16 eV and 24 eV for Si+2 and C+2 respectively. A dependence on the ionization parameter is expected, as already mentioned. However, given the similarity in the ionization structure of the photo-ionized slab, it is after all not surprising that the ratio Aliii1860/ Siiii]1892 is almost insensitive to the ionization parameter over a wide range of density. We remind that the detection of strong Aliii1860 alone already suggests that we are considering very high density emitting gas even if metallicity is super-solar. Simulations indicate that Aliii1860 should increase smoothly with density and be weakest in canonical BLR if the density is cm-3 (cf. Korista et al. 1997).
The ratio Aliii1860/ Siiii]1892 is therefore diagnosing high density gas, while the Ciii]1909/ Siiii]1892 ratio covers the domain of cm-3. The ratio Aliii1860/ Siiii]1892 alone is, generally speaking, insufficient to determine . A second diagnostic ratio is needed to constrain and to unambiguously derive . We consider Siii1814/ Siiii]1892, Civ1549/ Siiii]1892, Siiv1397/ Siiii]1892 as three diagnostic ratios suitable for constraining .
The Siii1814 doublet is conveniently placed, although weak or undetectable in most sources. The Siii1814/ Siiii]1892 ratio is anti-correlated with in a regular form, as our cloudy simulations show, especially for , and for density not much above the critical density of Siiii]1892. The behavior of the ratio Siii1814/ Siiii]1892 resembles the distribution of Ciii]1909/Civ1549 in the plane (, ) which shows a very regular dependence and a smooth anti-correlation with until the collisional quenching of Ciii]1909 sets on. However, the IP of Si0 is just 8 eV. The majority of the 1814 doublet is emitted in the partially ionized zone (PIZ) near the hydrogen ionization front. Fig 10 (bottom panel) shows the behavior of the volume emissivity times the geometrical depth within an emitting slab of gas as a function of the depth itself. Since the actual line emission is proportional to reported in Fig. 10, the emission of the Aliii1860, and Siiii]1892 lines is negligible in the PIZ, but the one of H certainly is not, and may be well dominating if cm-2. Significant emission in the PIZ is expected also for the Siii1814 doublet. However, for this latter line, total emission should not depend strongly on column density, since the emissivity becomes very low at cm-2. If higher are considered (up to 1025cm-2), ratios including Siiii]1892, Aliii1860, and Siii1814 show a very weak dependence on column density, with changes a few percent at worst.
We attempted to isolate a Civ1549 and a Siiv1397 component that corresponds to the Aliii1860 and Siiii]1892 lines. This can be a small part of the total Civ1549 and of Siiv1397 emission, but there is no point to consider the whole Civ1549 emission when Civ1549 shows a large blueshift and is much broader than H (Fig. 5 of Sulentic et al. 2000) and Siiii]1892 and Aliii1860 (Fig. 2 of Marziani et al. 2010). Taking into account various sources of ambiguity (mainly uncertainty in the quasar rest frame, S/N, blending with HeII1640), the Civ1549 BC component we measure with our fits is constrained within 50% at worst. Thus we find significant Civ1549 emission from the low-ionization gas, and the basic assumption is that its Civ1549 profile is the same as the Aliii1860, Siiii]1892 lines. If one considers the emissivity behavior, Civ1549 and Siiv1397 are obviously favored within the fully ionized zone.
The ratio of Civ1549 and Siiv1397 over Ciii]1909 or over Siiii]1892 increases with ionization parameter in a way that is roughly independent on density until the collisional quenching of the semi-forbidden lines sets on (Fig. 9). The previous considerations are helpful to understand why the Civ1549 and Siiv1397 ratios provide clear diagnostics of the ionization parameter and seem to be in (at least qualitative) agreement with ratios employing lower ionization lines like Siii1814/ Siiii]1892 that is also mainly sensitive to . The striking fact that the Civ1549 and Siiv1397 emission confirms low-ionization supports the hypothesis that the four lines are emitted by the same region. The ratios involving Si only have the obvious advantage that the the determination of the physical parameters is not dependent on metallicity; the drawback of Siiv1397 is that this line is weaker and blended with Oiv]1402. However, as already pointed out, the Siiv1397 BC intensity should be slightly affected by Oiv]1402.
7 Results on two Extreme, Elucidating Cases
We analyze two extreme objects – one extreme Pop. A and one extreme Pop. B – with the same methodology we used previously. The aim of this analysis is to help the interpretation of the line components measured on the spectra of the 8 3 quasars.
7.1 SDSS Weak Ciii]1909 source: SDSS J120144.36+011611.6
Our project stems from the careful analysis of the I Zw 1 UV spectrum by Laor et al. (1997b), and the evidence of a well-defined trend in the 1900Å blend along the E1 sequence (Aoki & Yoshida 1999, Wills et al. 1999, Bachev et al. 2004, Marziani et al., 2010). The NLSy1 I Zw 1 is known to be a sort of extremum in the E1 sequence: it shows strong Feii and Feiii, prominent Aliii1860 and Siiii]1892 emission. It is an example of the A3 spectral type, whose median 1900Å blend in shown in Fig. 3 of Bachev et al. (2004). Definitely, these sources are present also at intermediate to high redshift. We describe here the analysis of one source, SDSS J120144.36+011611.6 (Fig. 8), which seems to be a high-redshift, high-luminosity replica of I Zw 1, with broader lines (the FWHM limit of NLSy1s and Pop. A sources is luminosity dependent; see Netzer & Trahktenbrot 2007 and Marziani et al. 2009). These sources are Pop. A, and we assume that the profile of the BC is Lorentzian. Hereafter unshifted Lorentzian part of the line is said to be BC. Pop. A sources are also free of any VBC, making the analysis of the blend simpler.
Several considerations can be made from Fig. 8.
Aliii1860
The lines less ambiguous to measure are the Aliii1860 doublet because the two lines are less blended with other features, and they are remarkably strong. Siiii]1892 is more heavily blended with Ciii]1909 and Feiii. However, the specfit routine allows usually a plausible deconvolution of Siiii]1892, making the Aliii1860/ Siiii]1892 ratio very reliable. Feii and Feiii are obviously strong. We can use Feii UV 191 to set roughly the level of Feii, while the feature at 2080Å is helpful to estimate intensity of Feiii.
Feiii
Our specfit analysis produces a very weak Ciii]1909 component. A precise measurement of Ciii]1909 is cumbersome, since its intensity depends on the actual Feiii emission. The strong feature at 1914 could be dominating, and the template may seriously underestimate it (see Vestergaard and Wilkes 2001 for several alternatives in the empirical Feiii emission of I Zw 1). In any case the residual Ciii]1909 emission is small, suggesting that the 1900 blend, once believed to be mostly Ciii]1909, is actually almost void of Ciii]1909 emission in these A3-type sources.
Siii1814
The Siii1814 line is well visible in the spectrum of SDSS J120144.36+011611.6 and can be used as a substitute of Civ1549 to measure the ionization parameter. The ratio Siii1814/ Siiii]1892 is mainly sensitive to the ionization parameters, as it is the ratio Civ1549/ Siiii]1892. The ratio Siii1814/ Siiii]1892 has the considerable advantage of being weekly dependent on metallicity. If metallicity is known (see also §8.1), the ratio Civ1549/Aliii1860 should be in principle preferred since Aliii1860 is emitted through a permitted resonance transition while Siii1814 is emitted in the collisionally excited, partially-ionized zone (PIZ).
Civ1549
We fit Civ1549 with a Lorentzian component that is unshifted + a Civ1549 BBC. Note that the lack of shift in Aliii1860 and Siiii]1892 imposes a strong, determinant condition on the strength of the Lorentzian-component in Civ1549. It is important to stress that some Civ1549 BC emission is expected to be present according to our array of simulations. The ratio Civ1549/Aliii1860 is rather modest, as we can easily see even by eye. We note in passing that the with of BCC is km s-1, with a peak blueshift indicatively of km s-1, significantly larger than the one measured on the Civ1549 of I Zw 1 by Marziani et al. (2009).
Siiv1397
We fit Siiv1397 with a Lorentzian component that is unshifted + a BBC (that may include Siiv1397 and Oiv]1402 contribution). Results that are consistent with the ones of Civ1549. The ratio Siiv1397/ Siiii]1892 has the advantage that is almost independent on metallicity. In principle, the crossing point between the Siii1814/ Siiii]1892 and Siii1814/ Siiii]1892 can set a metallicity independent point in the (, ) plane. If the accuracy of the Siii1814 intensity is good then this point can be used to retrieve information on metallicity (§8.1).
We consider the measured line ratios in the plane vs. (initally assuming metallicity equal to solar), and see where they cross. We find very high density and low ionization (Fig. 11).
7.1.1 Along the E1 Sequence: A More Complex Scenario
Looking at the fit solution (Fig. 8(b)), it seems that our spectrum has almost no Ciii]1909. In many ways this is not surprising. The physical solutions in the (, ) plane of Fig. 11, points toward very low ionization () and high density (cm-3). At such high values of we expect that Ciii]1909 is collisionally quenched, and no significant emission. The ratio Ciii]1909/Civ1549 is expected to be just 10-2 in the dense LIL-BLR. Therefore we can say that sources like SDSS and I Zw 1 are extreme because all of the 1900Å blend is emitted by very low ionization, dense gas.
However, as soon as we move away from spectral types A3+ along the E1 sequence, we see that the prominence of Aliii1860 diminishes greatly. The emission disappears altogether at the other end of the E1 sequence, where several lobe-dominated radio-loud sources are found. For most quasars we see that Ciii]1909 is rather strong and unmistakably present. At a first glance this complicates the interpretation of the spectrum. However, one has to consider that Ciii]1909 can be emitted only by gas of much lower than that of the region where the bulk of Siiii]1892 and Aliii1860 is emitted. Our simulations show that Aliii1860 intensity grows smoothly as a function of density in the ionization parameter range of interest . This said, and considered the smooth trend we see from A3 to B1+, the most reasonable conclusion is that a dense region emits significantly whenever Aliii1860 emission is detected, although the relative prominence of the dense BC changes along the E1 sequence: it accounts for the entire LIL emission only in the most extreme Pop. A sources. The sequence of Fig. 3 of Bachev et al. (2004) seems to be mainly a sequence of prominence of Aliii1860+ Siiii]1892 vs Ciii]1909.
So, a very important conclusion is that a very dense, low-ionization region exists in the wide majority of quasars. It is associated with Feii prominence, as such gas is expected to emit a strong low-ionization spectrum. The most extreme Feii emitters are also the most extreme Aliii1860 emitters; in some cases where no Aliii1860 emission is measured, we also fail to detect any Feii emission (Marziani et al. 2010). Where is this region located? Why there are such distinctive line profiles as Lorentzian? The second issue goes beyond the present paper; for the moment our aim is to measure line components of Aliii1860, Siii1814, Siiii]1892 and Civ1549 that come from this region and to estimate its distance from the central black hole (§9).
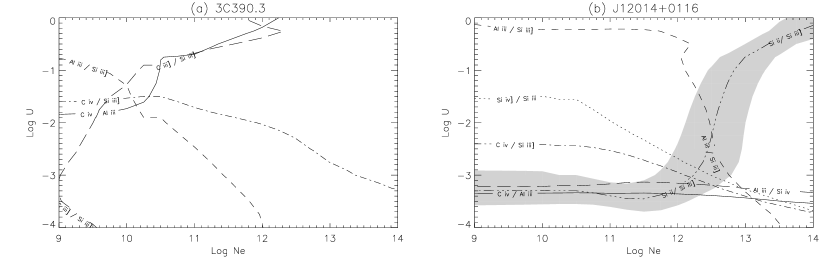
7.2 The Other E1 Extremum: 3C 390.3
3C 390.3 is a lobe-dominated (LD) RL source, with very broad emission lines and no optical Feii within detection limits (see Marziani et al. 2003, for the criterion used). It also shows a large peak shift in its H profile, and prominent narrow lines ([Oiii]5007, H), but also narrow components of Civ1549 and Ciii]1909 which are all well separated from the broad H profile.
To deconvolve the blends around Ciii]1909 and Civ1549, we assume the same emission line profiles as for H. The H broad profile can be described as the sum of a BC and a VBC. An unusual property of the BC is its large peak blueshift (it is unusual because of the shift amplitude: even if median spectra of Pop. B sources show a small BC redshift, there is a pretty large scatter with both red- and blueshifted peaks observed in individual sources; Zamfir et al. 2010). Applying in a self consistent way the BC and VBC to the Ciii]1909 and Civ1549 blends, leads to very interesting results as shown in Figure 8:
-
Aliii1860 is very weak or even absent within the S/N limits;
-
the Civ1549 profile is very similar to the one of H: BC+VBC accounts for more than 90% emission, with a possible, very weak contribution of the blueshifted component which is usually dominating in Pop. A sources;
-
the red wing observed in the 1900Å blend is accounted for only if there is a strong Ciii]1909 VBC, Feii and Feiii emission being below the detectability limit in this source;
-
there is no evidence of a VBC in Aliii1860;
-
the ratio Civ1549/Ciii]1909 BC is 10, a far cry from the ratios observed in extreme Pop. A sources like I Zw 1 and SDSS J120144.36+011611.6;
-
even more interesting we find a Civ1549/Ciii]1909 VBC 10, as for the BC.
We conclude that this object is fundamentally different from Pop. A sources. The low ionization, high density BC seems to be absent. The similarity in the Civ1549/Ciii]1909 ratios suggest that we are observing a gas in conditions similar to the one associated to the VBC. We predict that Feii will remain undetected or found to be weak even with S/N .
In the plane (, ) of Figure 11, the line ratios converge to a point at -1.5, and log 10.1 (the Siii1814 line cannot be measured accurately since S/N is poor). In this case, the Ciii]1909/Civ1549 ratio also converges toward a (, ) value consistent with the one indicated by the Aliii1860/Siii1814. In most other cases, this does not happen because the Aliii1860 doublet is too strong to be accounted for by gas of cm-3 even at super-solar metallicity. Emission occurs at pretty high ionization, in conditions that once upon a time were thought to be standard in quasars (Davidson and Netzer 1979). This Pop. A and B difference at the extrema was already pointed out, in a semi-quantitative way, by Sulentic et al. (2000) and Marziani et al. (2001).
It is however important not to generalize the case of 3C 390.3 to the remaining Pop. B sources. In most of them, Aliii1860 is detected, and there is evidence of strong Ciii]1909. Actually Ciii]1909 emission seems to be appreciable in all of our VLT quasars. This means that we are in a composite situation, where low-ionization, high-density emission is present, along with significant VBC and other emission. The two extreme cases help us however to understand these more complex cases.
7.3 The Contribution of Lower Density Gas
Once the true intensity of the BC components is retrieved, the presence of significant Ciii]1909 emission complicates the analysis. As pointed out, the photoionization solution for the BC suggests very high density, and in this region no Ciii]1909 emission is expected. Whenever Ciii]1909 is observed, we need to reverse the question: how much does any Ciii]1909 emitting gas contributes to the lines used for diagnostic ratios? Negligible contribution is expected to Aliii1860. However, this is not true for Civ1549 and Siiii]1892. Especially among Pop. A2 and A3 objects, it is not so obvious that the profile of Ciii]1909 and Siiii]1892 is the same. It could be well that the Ciii]1909 profile is narrower than the ones of Siiii]1892 and Aliii1860 (as found for SDSS J1201+0116), justifying the idea of Ciii]1909 emission from a disjoint region (§6.2). For the BAL QSOs in our sample and Aliii1860-strong sources most of what we ascribe to Ciii]1909 could be actually Feiii, as suggested by Hartig and Baldwin (1986).
However, objects like the typical A1 sources show Siiii]1892 and Ciii]1909 with similar profiles, so in the following we will assume the worst condition, that is all Ciii]1909 emitting gas is contributing to the BC lines.
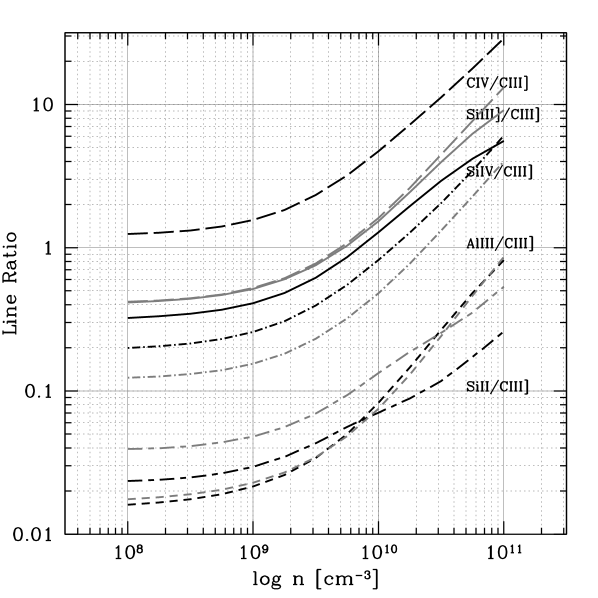
To estimate the contribution of the Ciii]1909 emitting gas to Siiii]1892 and Civ1549, we can consider the trends observed along E1. Siiii]1892 is strong when Aliii1860 is strong, and the Siiii]1892/ Ciii]1909 ratio is lower when Ciii]1909 is strong, as visible in both Baldwin et al. (1996) and Bachev et al. (2004), as well as in the present paper. The observed Siiii]1892/Ciii]1909 ratio in the A1 median bin seems to be as low as in Mark 335, . Pop. B sources that often show prominent Ciii]1909 also show a low Siiii]1892/Ciii]1909 ratio, as also appreciable in the median spectra of Bachev et al. (2004). These trends suggest that most Siiii]1892 is emitted where Aliii1860 is also emitted. As a consequence, any correction due to gas in different physical conditions (lower density) emitting Siiii]1892 is expected not to be dominant unless Ciii]1909 is extremely strong. The Ciii]1909 emitting gas should be at density , or lower. Higher density would imply increasing Siiii]1892/Ciii]1909 to values that would exceed the observed ones even if the LIL-BC is not emitting any significant Siiii]1892 (see Fig. 13).
7.3.1 Preliminary analysis of a low- sample
To set these trends on a more quantitative basis we considered the set of pre-costar recalibrated sources, for which Ciii]1909 and Civ1549 data are publicly available (Kuraszkiewicz et al 2002, Evans & Koratkar 2004).We performed measurements (interactively with the task splot of iraf) for about sources with the highest S/N, holding a Ciii]1909 blend that could be relatively easily deblended, and following the expectations described in §4.4. The rest frame equivalent width of Aliii1860 and Siiii]1892 are found to be highly correlated (Fig. 12). The correlation is due to Siiii]1892 being stronger when Aliii1860 is strong, not necessarily because Ciii]1909 is strong: actually, the Siiii]1892/Ciii]1909 ratio can be low when Ciii]1909 is strong, and the Aliii1860/ Siiii]1892 ratio achieves maximum values when Ciii]1909 is faintest. This is consistent with the bulk of Aliii1860 and Siiii]1892 originating in the same region. At the same time the presence of Ciii]1909 lowers the Aliii1860/ Siiii]1892, Civ1549/ Siiii]1892 and Siiv1397/ Siiii]1892 because of “excess” Siiii]1892 emission associated to the gas emitting Ciii]1909.
7.3.2 The effect of low-density gas on the product ()
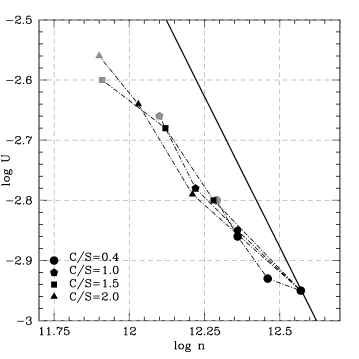
We expect that any correction will increase density (increase Aliii1860/ Siiii]1892 lowering Siiii]1892) and decrease ionization parameter (lowering Civ1549 more than Siiii]1892), but that their product will be less affected. To show the amplitude of the effect we performed an experiment, adding to a pure, high-density solution, contribution from moderate density gas ( ). The Fig. 14 shows the displacement in the density – ionization parameter plane for several values of the Ciii]1909/ Siiii]1892 intensity ratio. The values refer to the Ciii]1909 addition over Siiii]1892 in the ideal case, corresponding to observed ratios of 0.34, 0.7, 1.0, 1.1 for an addition of a Ciii]1909 component whose intensity is 0.4, 1.0 ,1.5 ,2.0 the intensity of the Siiii]1892 component associate to the high density gas. As one can see from the figure, even if deviation for and taken separately are significant, deviations for the product are by far less important. The largest change for the product is found to be 0.15, if we exclude the gray dots corresponding to = 10 (an unlikley case, since this would imply a correction Siiii]1892/Ciii]1909 1, inconsistent with what we observe when Ciii]1909 is strong). Following the expected line ratios of Fig.13 we apply a correction to the BC fluxes that is 0.4 and 1.5 Ciii]1909 for Siiii]1892 and Civ1549 respectively (Figures 15, 16 and 11), corresponding to and = 9. We remark that that if is lower, the correction will have negligible effect, while assuming a larger will lead to Civ1549 flux in excess to the one observed.
To constrain the ionization parameter we can first consider that, since the Ciii]1909 gas comes from a (relatively) low density region, the contribution to Siii1814 is small: for and , the contribution should be Ciii]1909. Second, another powerful feature is the Siiv1397 doublet (Baldwin et al. 1996): the Siiv1397 doublet is less affected by the Ciii]1909 correction, the contribution from lower density gas being estimated 0.25 Ciii]1909. The line ratio Siiv1397/Aliii1860 is also sensitive to ionization and less affected by any lower density correction (provided that the relative abundance of S and Al stays the same, as it seems to be the case).
In summary, corrected BC line intensities are computed as follows: (Siii1814)BC = (Siii1814)BC – 0.03 (Ciii]1909)BC; ( Siiii]1892)BC = ( Siiii]1892)BC – 0.4 (Ciii]1909)BC; (Siiv1397)BC = (Siiv1397)BC – 0.26 (Ciii]1909)BC; (Civ1549)BC = (Civ1549)BC – 1.5 (Ciii]1909)BC.
8 Results on the 3 Quasars
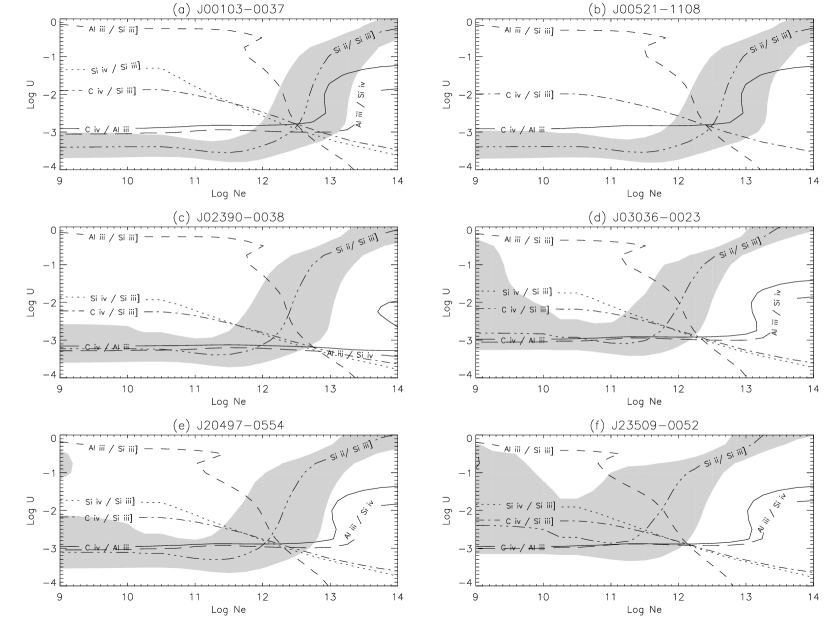
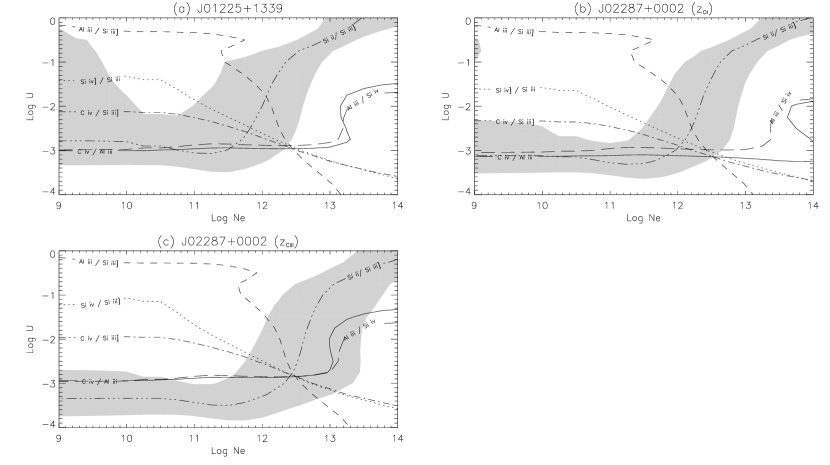
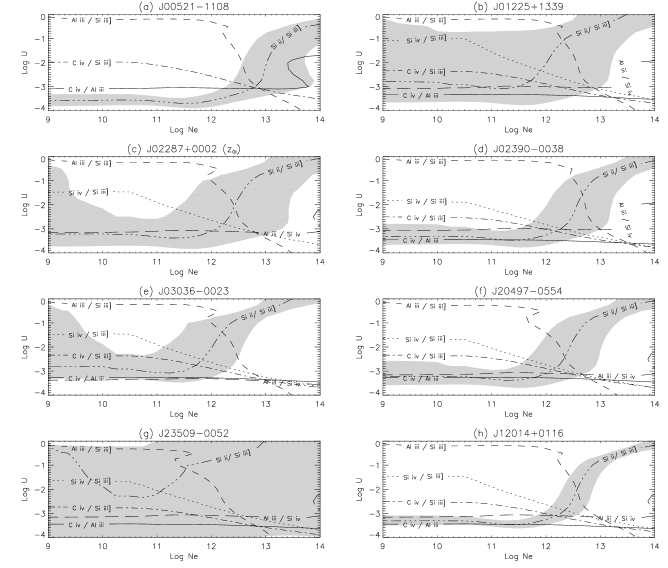
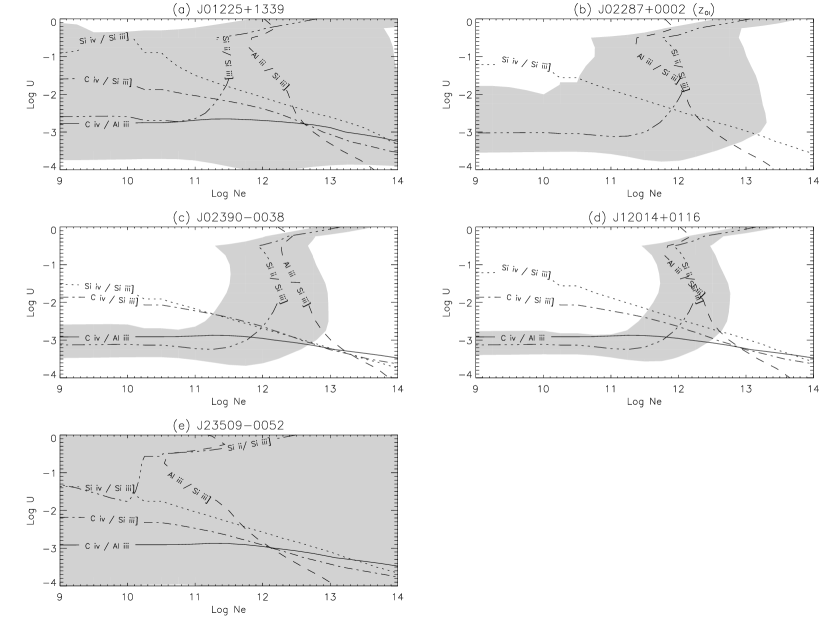
To estimate and values, we use the cloudy contour plots of the ratios Aliii1860/ Siiii]1892, Siii1814/ Siiii]1892, Civ1549/ Siiii]1892, Siiv1397/ Siiii]1892 showed in Fig. 9222Note that there are regions where the ratio values are actually undefined: close to the high limit (), ratios Aliii1860/ Siiii]1892 and Siii1814/ Siiii]1892(with cm-3) should not be considered.. The data points of our objects are in regions were the ratios are well-defined. The ratios Civ1549/ Siiii]1892, Siiv1397/ Siiii]1892, and Siii1814/ Siiii]1892 are mainly sensitive to the ionization parameter , while Aliii1860/ Siiii]1892 and Ciii]1909/ Siiii]1892 are mainly sensitive to the electron density. We know that Ciii]1909 is collisionally quenched at 10 and in the contour plot for Ciii]1909/ Siiii]1892 we see a step around this value.
We measure the BC intensity of Siiii]1892, Aliii1860, Siii1814, Siiv1397 and Civ1549; with them we compute the diagnostic ratios (for 3C390.3 we use Ciii]1909 in place of Siii1814; however there is no object similar to 3C390.3 among the 3 quasars). We present the fluxes of the line components in Tab. 3 and the equivalent width in Tab. 5. Table 4 shows the weak lines around Civ1549. For Civ1549 line we show the core, blue shifted and the very broad components. Errors are at a confidence level, and include the sources of uncertainty described in §4.5. Errors are then quadratically propagated according to standard practice to compute intensity ratios and their logarithm.
From Table 3 we can derive the diagnostic ratios. As we see in Fig. 1, Siii1814 is absorbed by telluric B band in J00103-0037, J03036-0023, J20497-0554 (most affected). We will not consider Siii1814 to compute and on those cases. However, if we take at face value the Siii1814 measure on J00103-0037 and J20497-0554, it will converge close to the point set by the remaining two ratios. We display on a graph a line representing the behavior of each ratio under the assumption of solar metallicity; the ideal point where the lines representing different diagnostic ratios cross determines the values of and . Figs. 15 and 16 shows the contour plots were we can see that the diagnostic ratios converge to rather well defined values. The cross point is very precise for the objects J00103-0037, J00521-1108, J02287+0002 (using ), and J20497-0554 ; for the remaining objects J01225+1339, J02287+0002 (using ), J02390-0038, J03036-0023, and J23509-0052 the cross point is slightly different. We must not forget the errors involving the fits, such as the changing of the shape profile that makes large the peak intensity if is Lorentzian or it could be less intense if it is Gaussian; the Feii pseudo-continuum contribution that affects principally to Siii1814 or the Feiii that in some cases affects Ciii]1909.
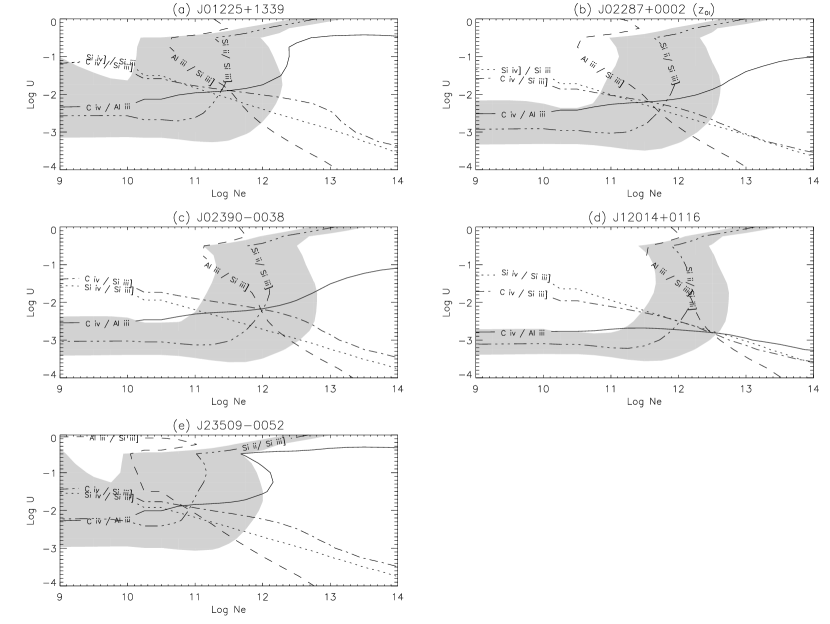
In principle, the crossing point of the ratios Siiv1397/ Siiii]1892 and Siii1814/ Siiii]1892 is independent on metallicity. Therefore, any significant disagreement between this crossing point and the ratios based on Civ1549 may indicate chemical composition different from the assumed solar one (§8.1). The difficulty here is the large uncertainty of the Siii1814 line. In all contour plots we show the interval as a shaded band. So, it is proper to consider deviations from metallicity only in the case of 4 sources where the crossing point excluding Siii1814 is outside the uncertainty band.
For the objects J00103-0037, J03036-0023 and J20497-0554 we exclude the Siii1814 line from the diagnostic ratios because it is affected by absorption. For the remaining objects, we take the average of the crossing contour plots of (Aliii1860/ Siiii]1892) crossing with (Civ1549/ Siiii]1892) and (Aliii1860/ Siiii]1892) crossing with (Siii1814/ Siiii]1892). For 3C390.3 we use (Ciii]1909/ Siiii]1892) instead of (Siii1814/ Siiii]1892). Table 6 summarizes the and values including their uncertainty. Since and are not independent quantities (their correlation coefficient is found to be 0.55), we adopt the appropriate formula for the errors on the product (following Bevington 1969). We present average values of the crossing points for extreme objects of Fig. 11 and 18(d). In the SDSS J12014+0116 case we give full weight to the Siii1814 measurement. The crossing points disagree somewhat for SDSS J12014+0116. This could be due to an underestimate of both Siii1814 and Civ1549 in the fits. On the one hand, Siii1814 is clearly seen and strong but is contaminated by Feii blend; on the other hand, Civ1549 is strongly affected by the blue-shifted component and by the assumption that it is of Gaussian shape. An increase by 30% in the measurement of the intensity of the two line would lead to a better agreement but this is somewhat an ad-hoc speculation. Rather, the significant difference between the crossing point of the Siii1814/ Siiii]1892 and Siiv1397/ Siiii]1892 ratios and the other ones point toward strong metal enrichment. We will show in §8.1 that this is probably the case.
At any rate, the convergence is toward a value of , lower than for the other 3 quasars. This is reflected in the Civ1549 EW of this source, also significantly lower. It is intriguing to note that the correction because of lower density drives the other sources toward values of and that are closer to the ones of SDSS J12014+0116.
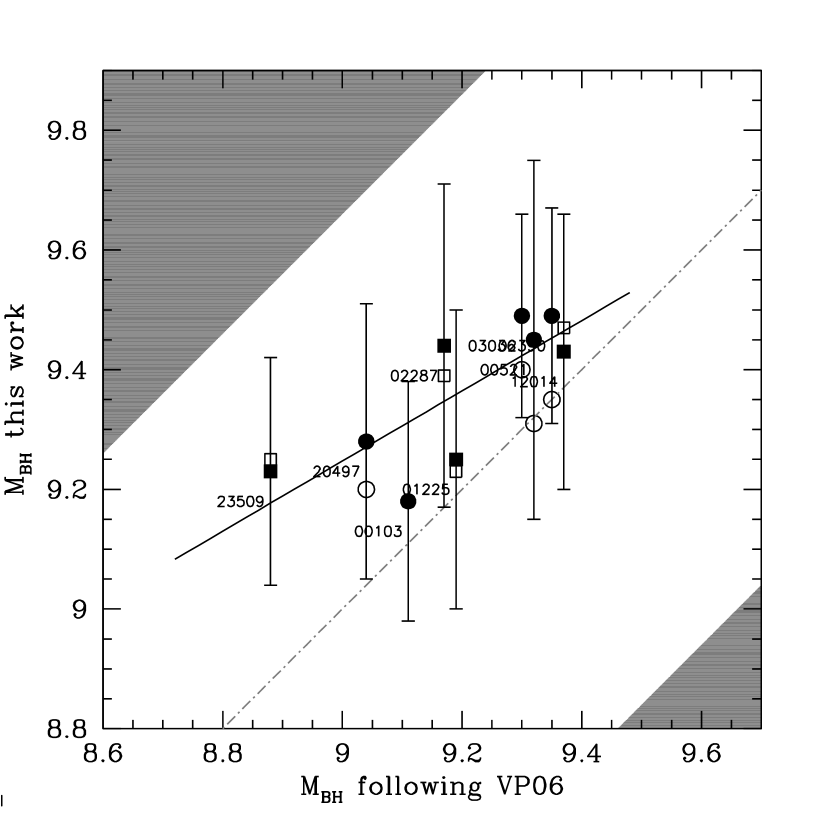
Table 7 reports the values of the and the of our 8 objects and the extreme objects in the last two rows. Column 1 identifies the quasar name; Col. 2 gives the quasar proper distance in mega parsecs [Mpc]; Cols. 3 and 4 are the continuum specific flux value at 1350Å and 1700Å respectively, Col. 5 reports the FWHM in km s-1 for the broad components, Col. 6 is the Population designation. Cols. (7) to (10) report the logarithm of the size of the BLR in cm obtained from: a) , b) line ratios corrected because of low density emission, c) , and d) line ratios corrected because of low density emission. Cols. (11) -(14) list the logarithm of the black hole mass in solar masses in the same order as for . Finally Col. (15) is computed from Vestergaard and Peterson (2006) formula (Equation 10). We will explain in §10 how these quantities are computed.
8.1 Effects of Metallicity
The strength of Nv1240 relative to Civ1549 and Heii1640 suggests supersolar chemical abundances (Hamann and Ferland 1993; Hamann & Ferland 1999). Chemical abundances may be well 5 to 10 times solar (Dhanda et al. 2007), with Z 5 reputed typical of high quasars (Ferland et al. 1996). The E1 sequence seems to be mainly a sequence of ionization in the sense of a steady decrease in prominence of the low-ionization BC toward Population B (Marziani et al. 2001, 2010). However, this is not to neglect that metal-enrichment also plays a role, especially for the most extreme Pop. A sources i.e., those in bin A3 and higher (Sulentic et al. 2001).
The lines employed in the present study come from carbon, silicon and aluminium; all these element can be significantly depleted from gas if dust grains are formed (e. g., Mathis 1990). However, the emitting regions where our lines are produced are thought too hot to contain significant amount of dust (a definition of broad line region is right the central engine region below the dust sublimation region: e.g., Elitzur 2009). In addition Si and Al are expected to be produced under similar circumstances in the late stage of evolution of massive stars (Clayton 1983, Ch. 7). We note also that the Civ1549/ Siiii]1892 and Civ1549/Aliii1860 usually give results that are in perfect agreement in the plane (,). These findings support our assumption that, if metallicity variations are present, the relative abundance Al to Si remains constant. We considered two cases for enhanced metallicity: (1) constant solar abundance ratio Al:Si:C with (5Z) ; (2) an overabundance of Si with respect to carbon by a factor 3, again with (5ZSA). This condition comes from the yields listed by Woosley and Weaver (1995) from type II Supernovæ. The Si overabundance is also supported by the chemical composition of the gas returned to the interstellar medium by an evolved population with a top-loaded initial mass function simulated using Starburst 99 (Leitherer et al. 1999). The abundance of Al should scale roughly with the one of Si. While some cases with Al scaling with C are possible from the Woosely and Weaver (1995) yields, they are rarer than cases in which Al scales with Si. This latter case is appropriate for the most massive progenitors. Also, the assumption of Al scaling with C with [Si/C] = 0.477 would yield to implausible high density and lack of convergence to a well-defined solution for . We therefore assume in the following that Al scales with Si in the two cases listed above.
An array of simulations as a function of ionization parameter and density was computed assuming the conditions (1) and (2) listed in the previous paragraph. As expected, if the solar metallicity is simply scaled by a factor (5Z) we find that the ratio Aliii1860/ Siiii]1892 is not strongly dependent on : the ratio increases by about 40% passing from to , for and –2. The same is true for the Siii1814/ Siiii]1892 and Siiv1397/ Siiii]1892 ratios. Since the first ratio sets , and the last two , the ratios mentioned in this paragraph should be preferred because they provide and values that are weakly affected by a factor 5 change in metallicity. A posteriori we confirm that the effect on the product derived also with ratios involving Civ1549 is negligible in case 5Z (and it should be even more so if a metallicity increase is ).
The two extreme cases seem to be revealing also as far as metallicity is concerned. Ratios converge to a fairly well defined point in the case of 3C 390.3 (see Fig. 11, left panel, assumed). In this case there is no major evidence of supersolar metallicity. The converse is true in the case of SDSS J120144.36+011611.6. The ratios involving Civ1549 indicate a lower ionization level, with . This is because C3+ changes ionization state to C2+ for smaller ionization parameters, and so Civ1549 rapidly disappears. The Civ1549 intensity depends weakly on while the Aliii1860 and Siiii]1892 lines are more sensitive. The 5Z case yields values closer to the ones obtained from the Si and Al line ratios, but not yet in concordance. If we pass to case 5ZSA with a factor 3 Si overabundance, then the concordance of the line ratios is good, especially if no correction because of low density emission is applied. As a further confirmation we checked that the metallicity-dependent Civ1549/Siiv1397 ratio is in very good agreement with the crossing point of the other lines. Therefore, in this case, we have independent measures of metallicity, , and . The case of even higher metallicity, say , remains to be explored but may not be appropriate considering the good agreement with 5ZSA.
In principle, the discrepancy in the intersection point, with Siiii]1892/Civ1549 and Aliii1860/Civ1549 yielding lower than the Al-Si ratios, should signal a significant enrichment in Si and Al of the BLR gas. In this case the Siiv1397/Civ1549 ratio should be helpful, as it can be assumed to be dependent mainly on the Si abundance relative to C. Here, more than precisely determining the exact abundance value we are interested in analyzing the effect of large metallicity changes on , , and their product. Appreciable discrepancy is visible in the contour plots of the BAL quasar J01225+1339, J03036-0023, J20497-0554 and J23509-0052 if is assumed.
In the same plots made for SA, the agreement becomes better (see Fig. 18). High metallicity yields higher and smaller if emission line ratios involving Civ1549 are considered. This reflect the increase in abudance of Si and Al with respect to C, and the fact the Siii1814, Siiii]1892, Aliii1860 lines are emitted at lower ionization than Civ1549. In the case of sources like J02390-0038 and J20497-0554, the discrepancy of the crossing lines might indicate , more than the extreme enrichment like the one assumed in 5ZSA, as also suggested by the Civ1549/Siiv1397 ratio.
In Fig. 18 and 19 the contour plots are shown for the case 5ZSA. We consider uncorrected and corrected line ratios as two independent cases. The halftone bands also show the importance of accurate Siii1814 measurements to infer unambiguous constrain on metallicity (and, by extension, to estimate and independently). The product is however much less affected than and individually (Tab. 6).
A first and estimate can be obtained considering only the Siii1814/ Siiii]1892 and Aliii1860/ Siiii]1892 ratios. We conclude that the effect of scaling the metallicity up to is within the uncertainty of the method, and particularly small if the ratios Siii1814/ Siiii]1892, Aliii1860/ Siiii]1892, and Siiv1397/ Siiii]1892 are considered to compute and . It is significant if strong enrichment of Al and Si over C occurs. A more refined approach could exploit the dependence of Aliii1860/Civ1549 (and Siiii]1892/Civ1549 and Siiv1397/Civ1549) on to build a 3D diagram where , , along with Si-Al enrichment can be determined independently.
8.2 Determining the best estimate of ,
There are two sets of line ratios for each object: one comes from the specfit results, and the other is the one computed after correcting the specfit results because of low density contributions. Solutions with corrected value usually point toward very high density and low ionization, predicting Siii1814 emission even twice as strong as Siiii]1892. However, increasing the metallicity for corrected ratios leads to better agreement among lines and more reasonable , values, while leaving the product fairly unaffected. Especially the assumption of Silicon - Aluminium enrichment improves the concordance in the intriguing cases of SDSS J12014+0116, J01225+1339, J02287+0002 (using ), the extreme objects and the two BAL QSOs in our sample. However, apart from the case of SDSS J12014+0116, the enrichment is probably excessive. From the discussion above the independent determination of and seems possible only if metallicity is at least roughly known. We exclude metallicity cases where we find a sizeable disagreement in the crossing points (with the exceptions of ratios involving Siii1814: the ionization level can be estimated in a -independent way using the Siiv1397/Siii1814 and the Siiv1397). We consider each individual source with line intensity before and after correction to obtain two independent sets of product values. As mentioned, changing metallicity is not affecting the product as much as and individually. In case of concordance of the crossing points and of high accuracy in the Siii1814 ratio, , and can be considered independently determined. In Table 6 we indicate the values that are deemed most appropriate.
9 A Photoionization Method to Compute the Broad Line Region Distance and the Black Hole Mass.
The distance of the broad line region () from the central continuum source and the black hole mass () are key parameters that let us understand the dynamics of the gas in the emitting region and the quasar behavior and evolution. In this work we will use a method based on the determination of and to compute . Eq. 1 can be rewritten as
| (3) |
and also as
| (4) |
where is the Plank constant, is the light speed, is the proper distance. The integral is carried out from the Lyman limit to the shortest wavelengths on the rest frame specific flux . For the integral we will use two Spectral Energy Distributions (SEDs): one described by Mathews & Ferland (1987) and one by Laor et al. (1997a), also reproduced in Fig. 20.
Eq. 4 becomes:
| (5) |
where , and is an interpolation function for as a function of redshift.
is 0.00963 cmÅ in the case the continuum of Laor et al. (1997) is considered; 0.02181 cmÅ for Mathews & Ferland (1987). We use their average value, since the derived and are not sensitive to the two different shapes to a first approximation.333Since the Laor et al. (1997) continuum produces a fewer ionizing photons, the same value of is obtained at a smaller distance.
Knowing we can calculate the assuming virial motions of the gas
| (6) |
or,
| (7) |
with the geometry term , corresponding to (Graham et al. 2011, see also Onken et al. 2004 and Woo et al. 2010). Collin et al. (2006) suggest that is significantly different for Pop.A and B sources; we do not consider here their important result for the sake of comparison with previous work (§10.2). The resulting and are reported in Columns 7 to 14 of Table 7. Errors are at 2 confidence level and have been computed propagating quadratically the major sources of uncertainty. More precisely, in addition to the error on (), the determination is affected by the uncertainty in the spectrophotometry (specific fluxes of Col. 3 of Tab. 7), and errors on the shape of the ionizing continuum. The two SEDs that we assumed as extreme yield a difference in ionizing photons of a factor 2.2. At a 2 confidence level this corresponds to an uncertainty of 0.065 in logarithm. An additional source of uncertainty affects due to the FWHM determination. Errors on FWHM are quadratically added to the uncertainty on in the values reported as errors.
10 Discussion
10.1 Previous work
There have been several studies aimed at computing and . A direct measure of through reverberation mapping requires an enormous amount of observational effort and has only been applied to a relatively small number of quasars: slightly less than 50 objects with (Kaspi et al. 2000, 2005, Peterson et al. 2004; Bentz et al. 2010). A second way to measure uses a less direct method. Kaspi et al. (2000, 2005) and Bentz et al. (2009) used reverberation mapping results to find, in an empirical way, a relationship between and the optical continuum luminosity at 5100Å,
| (8) |
with . Vestergaard & Peterson (2006) obtained a similar result for the optical continuum luminosity with an and for the UV continuum at 1350Å, . These relationships have been used to compute the not only for nearby objects, but also for high redshift, high luminosity objects. There are other works that use single epoch spectra and the continuum at 3000Å, obtaining an (McLure & Jarvis 2002).
We can rewrite Eq. 6 as
| (9) |
H is a low ionization strong line whose FWHM has been widely used to determine the for objects mainly up to ; above this limit IR spectrometers and large telescopes are needed to cover the redshifted line. For distant objects (), an alternative is to use Civ1549, a high ionization line emitted in the UV. However, this line should be used with caution because the line is often blueshifted. This means that at least part of this line is likely emitted in an outflow (Sulentic et al. 2007; Richards et al. 2010). Thus the estimation of using FWHM(Civ1549) tend to be systematically higher than those using FWHM(H), especially for objects of Population A.
10.2 Comparison with Vestergaard and Peterson (2006)
Vestergaard & Peterson (2006) used the relationship to obtain the following formula that relates to the FWHM(Civ1549) and the continuum luminosity at 1350Å:
| (10) |
The scale factor sets the masses to the value obtained by Graham et al. (2011). In Cols. 11 and 15 of Table 7 and in Fig. 21 we compare our results with those using Eq. 10. We do not apply corrections for radiation-pressure effects that are likely relevant especially for objects radiating at large Eddington ratio (Netzer 2009; Netzer & Marziani 2010). The difference between this computation and the one reported in Sulentic et al. (2007) is that in the latter work the blueshifted component was not separated from the broad component of Civ1549 just to show how larger values of FWHM(Civ1549) yielded much larger than the ones derived from FWHM(H) in Pop. A objects.
We compare the masses obtained using our photoionization method with those of Vestergaard & Peterson (2006) in Fig. 21. We use the FWHM of the BC as an estimator of the virial line broadening. From our results we can see that the masses agree within less than 1 uncertainty in the luminosity correlation (0.33). There is a systematic offset of 0.170.10 if uncorrected ratios are used. The mass values obtained after correction for low density gas are systematically lower. This happens because the correction increases the product , lowering and hence . The obtained after corrections are within the error bars. The systematic offset is then . It is important to consider that the computed correction is in many ways a maximum correction. Ciii]1909 emission is assumed to have the same FWHM of Siiii]1892 while it could be significantly narrower; in addition part of the Ciii]1909 emission could be due to Feiii 1914. In many sources of Pop. A the correction could be ignored altogether. The present results indicate that the Kaspi et al. (2000) relationships can be extended to be used in high redshift objects (or at least until z3) if the FWHM of the core broad line region can be well determined and measured. In order to do this, we need:
-
Spectra with S/N high enough to see the profile shape that allows decomposition of the Civ1549 line, especially to separate the blue component from the broad core;
-
to follow the methodological considerations explained in §4 .
Fig. 21 should be looked at with two cautions. First, the correlation is dominated by the luminosity dependence of , used to compute in both cases. Second, the spread of values is small, less than one order of magnitude (and most objects have statistically indistinguishable masses). Our estimated error bars are however smaller compared to the spread expected on the basis of the - correlation which is, according to Vestergaard & Peterson (2006), 0.66 at a 2 confidence level. The two shaded bands of Fig. 21 limit the region where we can expect to find data points on the basis of the - correlation. Clearly, a proper interpretation of the Civ1549 profile may help to reduce the scatter. In any case, our method should provide estimates with somewhat lower uncertainty. It is interesting to note that SDSS J12014+0116 appear at the largest , and the agreement with the - is very good. The value of 3C 390.3 we obtain is fairly uncertain due to the low S/N. The size computed in the present paper is larger than the reverberation mapping derived for H and Civ1549, although consistent with the value derived from Ly. 3C 390.3 has the unusual property of having a response time longer in Civ1549 than in H, although the large error bars do not exclude that the two lines respond with similar time. This behavior might be related to different physical conditions found for this object.
10.3 The LIL-BLR
While the existence of high density and low ionization has been invoked since long to explain Feii emission (especially by S. Collin and collaborators, as mentioned in the introduction), we have provided additional evidence that high density and low ionization are indeed diagnosed from emission lines other than Feii blends, and that conditions are the one producing most line emission in extreme Pop. A quasars. Last but not least, both and can be observationally determined with reasonable accuracy from the diagnostic ratios Siii1814/ Siiii]1892, Siiv1397/ Siiii]1892, Aliii1860/ Siiii]1892, and Civ1549/(Aliii1860 or Siiii]1892). Metallicity can be also constrained from the previous ratios as well as from Civ1549/Siiv1397. These ratios are pretty well defined, while estimating Ciii]1909 and Feiii1914 relative contribution is not relevant to our method (with the exceptions of sources like 3C 390.3). This low ionization BLR (or LIL BLR) has very similar properties to the Oi and Caii emitting region identified by Matsuoka et al. (2008). The LIL-BLR seems to be present in the vast majority of quasars, probably all the ones with significant Feii emission (Marziani et al. 2010). The low values of could be a consequence of the high density rather than of a far away location of the emitting region. The assumption of a single well defined value of and is probably an idealization even for the LIL-BLR taken alone; however the convergence of emission line ratios toward a well defined point, along with the ability to qualitatively explain Feii and most H emission, indicate that the LIL-BLR might be a region with a small range of low and high .
Do density and ionization parameter in the LIL BLR converge to a single well defined value with a small dispersion? A tentative answer comes from the values reported in Tab. 6. Excluding 3C390.3, the range and span is not very large (even considering changes in metallicity): less than one order of magnitude around 12.5, and ionization parameter , and the spread is not much larger than the uncertainties in the individual measurements. The product seems to be fairly stable. We have ), with a sample dispersion of 0.15 (excluding 3C 390.3). We applied the same method to 14 low- quasars (Negrete et al. 2010), and we obtain ), with a dispersion of 0.3. Assuming ) could be a good approach to estimate if elaborate measurements on Civ1549 and Ciii]1909 are not possible, and only a rough estimate of the Siiii]1892 BC FWHM is available. On the other hand, there is still a major effect of measurement errors on the uncertainty derived for ); instrumental improvements may lead to a significant appreciation of object-by-object diversity.
The values reported in Table 6 are not very far from the average value obtained by Padovani and Rafanelli (1988). This is not surprising since the spectra at low and high seems to show the same diversity, classified through the E1 sequence and the Pop. A/Pop. B distinction. In other words, NLSy1-like sources whose spectrum is similar to I Zw1 appear to be present at high redshift, meaning that the LIL-BLR remains strong and prominent over a wide range of redshifts. A second reason is that Padovani and Rafanelli (1988) considered H. Emission of H can be significant under a much wider range of and ; however, the Aliii1860, Mgii2800, Feii emitting region should be also a strong producer of H. This region with well-defined physical conditions is expected to be the emitter of the core of H, i.e., the part of the line responding more strongly to continuum changes.
10.3.1 Verification on EW and Line Luminosity
Considering that we have very low ionization parameter values, a legitimate question is whether we have a sufficient number of photons to explain the EW and luminosity of the emission lines. We made a preliminary check of consistency for the EW from CLOUDY simulations. A second, a-posteriori test was to consider the predicted line luminosity assuming the actual luminosity of the quasar, the density and the distance derived from our method, and spherical geometry.
A remarkable property common to all spectra is the low EW of the emission lines. The extreme source SDSS J120144.36+011611.6 has total (Civ1549) 19 Å, which becomes 7 Å if only the LIL component is considered. The whole 1900 Å blend has 20 Å; the individual EWs of Siiii]1892 and Aliii1860 are just a few Å. Similar considerations apply to the other high- quasars, especially for Pop. A sources. In this case we have (Civ1549) Å, the equivalent width of the whole 1900 Å Å including the uncertain contribution of Feiii and Ciii]1909. This has the important implication that the ionization parameter cannot be very large. From our simulations, we deduce that the LIL-BLR is always . On the other hand, toward the low , high density limit emission lines tend to disappear altogether. The predicted EWs become too low to account for the observed EW with a covering factor if . The values obtained after correction are still possible within the condition of since the Civ1549 EW is greatly diminished. Cases of very low are rather indicative of strong metal enhancement than of extremely low ionization level (see §8.1). If we take 12.5, , the predicted equivalent width of is (Civ1549)37 Å for a covering factor 0.5, close to the largest values observed in our quasars. However, The Civ1549 EW of SDSS J12014+0116 can be accounted for by the values of and 12.75 – 12.50.
If we model the BLR with a spherical geometry where the emitting gas covers a fraction of the continuum, CLOUDY computations confirm that the line luminosity can be accounted for. The luminosity at 1700 Å of J00103-0037 is 46.6; the predicted luminosity of Civ1549 is (Civ1549) 44.5, under the assumption of , , and Mathews & Ferland continuum shape. The observed Civ1549 line luminosity of J00103-0037, ergs s-1, is obtained with .
10.3.2 Analogy with Carinæ
The physical conditions we envisage for the BC of quasars find a correspondence in the so-called Weigelt blobs of Carinæ, located in the equatorial plane of the system, perpendicular to the symmetry axis of the bipolar lobes forming the homunculus nebula (cf. Marziani et al. 2010). Unlike the gas of the bipolar lobes, predominantly shock heated, the Weigelt blobs are believed to be dense gas photoionized by the radiation associated to the central, massive star and to a possible companion (e.g., Johansson et al. 2000; Davidson 2005). The spectrum of the Weigelt blobs shows very weak Ciii]1909 along with a prominent line at 1914, ascribed to the Feiii transition. The line appears very strong because the upper level is populated by Ly fluorescence. This very same process is expected to be present also in quasars. Indeed, in I Zw 1, where lines are narrow, and in SDSS J120144.36+011611.6 the peak emission at around 1914 Å is actually visible. The amount of Ly pumping to the upper level (z) of the UV 34 cannot be estimated through the standard edition of CLOUDY (the relevant levels of the UV 34 multiplets of Fe+2 ion are not included). Additional photoionization computations including a suitable Fe+2 model and line transfer should be considered. This is beyond the aim of the present study; we can conclude in a qualitative fashion that the spectrum of the Carinæ blobs supports a view of the low-ionization part of the BLR that is not conventional: very high density gas, at very low ionization.
11 Conclusions
In this paper we presented new observations of eight high redshift quasars. The spectra were meant to provide high S/N, moderate resolution data on which the Civ1549, Siiii]1892, Aliii1860, and Siii1814 emission line profiles could be accurately analyzed. Line profile fits allowed us to isolate a specific component whose intensity ratios were used to derive consistent values for electron density and ionization parameter. This line component (LIL BC) seems to be emitted predominantly by low ionization, high density gas in the majority of quasars studied thus far by us.
These results permitted us to compute the product and hence the size of the Broad Line Region and the central black hole mass. The method described in this paper rests on the assumption of photoionization as the mechanism of gas heating; on the assumption of isotropic luminosity, and on line ratios predicted by cloudy simulations. The photoionization method explored in this paper offers an estimate of for each quasar, with some advantages on the valued derived from the luminosity-size correlation. The luminosity correlation suffers from large scatter and is simply extrapolated to very high luminosity without any support since there are, unfortunately, no conclusive results on reverberation of high luminosity quasars even if heroic efforts are underway (e.g., Trevese et al. 2007, Botti et al. 2010). We found that the black hole masses derived from the computed and from the virial assumption are in good agreement with the ones derived from the luminosity-size relationship. Actually, Fig. 21 suggests that we might have reduced the errors of the by a factor of two with respect to the expectation from the Vestergaard & Peterson (2006) relationship.
We repeat that our and results are based on the product and not on values of and of taken separately. It seems that this product converges to two typical ranges of values, one of them associated to low-ionization, high density gas (the LIL-BLR). For our and determinations we do not use ratio Ciii]1909/ Siiii]1892 except for 3C 390.3. As we discussed in §7.2, this ratio should not be considered at high density because Ciii]1909 is collisionally quenced if cm-3. Ciii]1909 is produced in conditions that are very different from the ones we found for the LIL-BLR. While the method can be applied to most quasars, the application seems to be especially straightforward to quasars whose spectrum is like SDSS J120144.36+011611.6 (if high metallicity is properly taken into account) or, at the other end, 3C390.3. In the first case we have dominance by the LIL-BLR, in the second case the LIL-BLR seems to be completely absent and physical conditions look radically different: high ionization and moderate density. An inspection of SDSS spectra covering both the 1900 Å blend and Civ1549 (up to ) shows that SDSS J120144.36+011611.6 has many replicas at high redshift, accounting for at least a few percent of all quasars. These high-metallicity objects should be the first candidates to expand black hole mass computations to high redshift without relying on the - correlation.
To apply the photoionization method in the most effective way, determining and with the lowest uncertainty, spectral data should be of moderate resolution () as well as of high S/N. If the Siii1814 line can be measured in an accurate way, it would be possible to derive independent estimates of , , and in most quasars.
Especially the most extreme (in terms of Aliii1860 strength) objects in bin A3 and A2 hold the promise to make possible an independent estimate of , , and metallicity. Clearly, objects in bin A1 resembling their median spectrum are not well suited for an application of the method. Also, any source with Ciii]1909/ Siiii]1892 1 is subject to a large correction. In light of the many uncertainty, an average value of the product (obtained from the objects of the other spectral types) could be considered. Pop. B objects should not avoided entirely, especially whenever Siiii]1892 Ciii]1909 after VBC removal.
The present exploratory analysis emphasized several sources of uncertainty. However, the parameter needed for and computation, the product , seems to be fairly stable and well-defined. Even with an error of a 0.3 in logarithm, the square root will be subject to a 0.15 uncertainty in logarithm, much lower than the uncertainty associated with the luminosity correlation. The large intrinsic spread of the correlation at low luminosity, its uncertain extrapolation at very high luminosity make preferable a one-by-one determination based on physical properties of an emitting region that remains similar to itself.
References
Aoki, K., Yoshida, M. 1999, ASPC, 162, 385
Appenzeller, I., et al. 1998, The Messenger, 94, 1
Bachev et al. 2004, ApJ, 617, 171
Baldwin, Ferland, Korista and Verner, 1995, ApJ, 455, L119
Baldwin J. A. et al. 1996, ApJ, 461, 682
Baskin, A. & Laor, A. 2005, MNRAS, 356, 1029
Bentz, M. C., et al. 2010, ApJ, 716, 993
Bevington, P. R. 1969, Data reduction and error analysis for the physical sciences, New York: McGraw-Hill, 1969
Boroson, T.A. & Green, R.F., 1992, ApJS, 80, 109
Botti, I., Lira, P., Netzer H., Kaspi, S. 2010, IAU Symposium, 267, 198
Bottorff M.C. & Gary J.F. 2000, MNRAS, 316, 103
Bruhweiler, F. & Verner, E., 2008, ApJ, 675, 83
Clavel, J., et al. 1991, ApJ, 366, 64
Clayton, D.D., 1983, Principles of Stellar Evolution & Nucleosynthesis, Chicago:University of Chicago Press, Ch. 7
Collin-Souffrin S. et al. 1988, MNRAS, 232, 539
Collin, S., et al. 2006, A&A, 456, 75
Constantin A. et al. 2002, ApJ, 565, 50
Davidson, K. & Netzer, H., 1979, Rev. Mod. Phys. 51, 715
Davidson, K. 2005, ASPC, 332, 101
Dumont, A. M. & Mathez, G., 1981, A&A, 102, 1
Dumont, A. M, & Collin-Souffrin, S., 1990 A&A 229, 292
Edlén & Swings, 1942, ApJ, 95, 532
Ekberg J.O. 1993, A&AS, 101, 1
Espey, B. R., Carswell, R. F., Bailey, J. A., Smith, M. G., & Ward, M. J. 1989, ApJ, 342, 666
Evans & Koratkar 2004, ApJS, 150, 73
Francis P.J. et al. 1991, ApJ, 373, 465
Feibelman, W.A., and Aller, L.H., 1987, ApJ, 319, 407
Feldman U. et al. 1992, ApJS, 81, 387
Ferland G. J. et al. 1998, PASP, 110, 761
Gaskell, C. M. 1982, ApJ, 263, 79
Gaskell, M. et al. 1999, ASPC, 175, 423
Graham, A. W. et al. 2011, MNRAS, 48
Hartig, G. F. & Baldwin, J. A. 1986, ApJ, 302, 64
Hu, C., et al. 2008, ApJ, 687, 78
Johansson S. et al. 2000, A&A, 361, 977
Joly, M., 1987, A&A, 184,33
Kaspi et al. 2000, ApJ, 533, 631
Kaspi et al. 2005, ApJ, 629, 61
Kriss G.A., 1994, ASPC, 61, 437
Korista K. et al. 1997, ApJS, 108, 401
Kuraszkiewicz, J. K. et al. 2002 ApJS, 143,257
Laor A. et al. 1994, ApJ, 420, 110
Laor A. et al. 1997a, ApJ, 477, 93
Laor A. et al. 1997b, ApJ, 489, 656
Leitherer, C., et al. 1999, ApJS, 123, 2
McLure & Jarvis 2002, MNRAS, 337, 109
Marziani, P., Sulentic, J. W., Dultzin-Hacyan, D., Calvani, M., & Moles, M. 1996, ApJS, 104, 37
Marziani P. et al. 2003, ApJS, 145, 199
Marziani P. et al. 2003b, MNRAS, 345, 1133
Marziani P. et al. 2008, RMAA serie de conferencias, 32, 69
Marziani P. et al. 2009, A&A, 495, 83
Marziani P. et al. 2010, MNRAS, arXiv:1007.3187v1
Matsuoka, Y., Kawara, K., & Oyabu, S. 2008, ApJ, 673, 62
Mathews & Ferland 1987, ApJ, 323, 456
Metzroth, K. G., Onken, C. A., Peterson B. M. 2006, ApJ, 647, 901
Negrete, C. A., Dultzin, D., Marziani, P., Sulentic J. W. 2010, ApJL, submitted
Netzer, H., & Trahktenbrot, B. 2007, ApJ, 654, 754
Netzer, H. 2009, ApJ, 695, 793
Netzer, H. & Marziani, P. 2010, ApJ, in press, arXiv:1006.3553v2
Onken, C. A., Peterson, B. M. 2002, ApJ, 572, 746
Onken, C. A., Ferrarese, L., Merritt, D., Peterson, B. M., Pogge, R. W., Vestergaard, M., & Wandel, A. 2004, ApJ, 615, 645
Osterbrock, D. E., & Ferland, G. J. 2006, Astrophysics of gaseous nebulae and active galactic nuclei, 2nd. ed. by D.E. Osterbrock and G.J. Ferland. Sausalito, CA: University Science Books, 2006,
Padovani, P., 1988, A&A, 192, 9
Padovani, P. & Rafanelli, P. 1988, A&A, 205, 53
Padovani, P., Burg, R.I., Edelson, R.A., 1990, ApJ, 353, 438
Peterson B. M. et al. 2004, ApJ, 613, 682.
Punsly, B. 2010, ApJ, 713, 232
Rees M.J. 1987, MNRAS, 228, 47
Richards, G. T., et al. 2010, arXiv preprint 2010arXiv1011.2282R
Richards, G. T., Vanden Berk, D. E., Reichard, T. A., Hall, P. B., Schneider, D. P., SubbaRao, M., Thakar, A. R., & York, D. G. 2002, AJ, 124, 1
Sigut T.A. et al. 2004, ApJ, 611, 81
Sulentic J. W. et al. 2000, ApJ, 536, L5
Sulentic J. W. et al. 2001, AIP Conference Proceedings, 599, 963
Sulentic J. W. et al. 2002, ApJ, 566, 71
Sulentic J. W. et al. 2006, RMxAA, 42, 23
Sulentic J. W. et al. 2006b, A&A, 456, 929
Sulentic J. W. et al. 2007, ApJ, 666, 757.
Trevese, D., Paris, D., Stirpe, G. M., Vagnetti, F., and Zitelli, V. 2007, A&A, 470, 491
Tytler, D., & Fan, X.-M. 1992, ApJS, 79, 1
Vanden Berk et al. 2001, AJ, 122, 549
Verner E. et al. 1999, ApJS, 120, 101
Verner E. et al. 2003, ApJ, 592, 59
Verner E. et al. 2004, ApJ, 611,780
Vestergaard M. and Peterson B.M. 2006, ApJ, 641, 689.
Vestergaard & Wilkes, 2001, ApJS, 134, 1
Wandel, A., Peterson, B. M., Malkan, M. 1999, ApJ, 526, 579
Wills, B. J., et al. 1999, ApJ, 515, L53
Woo, J.-H., et al. 2010, ApJ, 716, 269
Woosley, S. E., Weaver, T. A. 1995, ApJS, 101, 181
Zamfir, S., Sulentic, J. W., Marziani, P., & Dultzin, D. 2010, MNRAS, 403, 1759
| Ion | Transition | Note | |||||
|---|---|---|---|---|---|---|---|
| Å | eV | eV | s-1 | cm-3 | |||
| Si II | 1808.00 | 8.15 | 0.000 - 6.857 | 1 | |||
| Si II | 1816.92 | 8.15 | 0.036 - 6.859 | 1 | |||
| Al III | 1854.716 | 18.83 | 0.000 - 6.685 | 1 | |||
| Al III | 1862.790 | 18.83 | 0.000 - 6.656 | 1 | |||
| 1882.7 | 16.34 | 0.000 - 6.585 | 0.012 | 1,2,3 | |||
| Si III] | 1892.03 | 16.34 | 0.000 - 6.553 | 16700 | 1,4,5 | ||
| 1906.7 | 24.38 | 0.000 - 6.502 | 0.0052 | 1,2,6 | |||
| C III] | 1908.734 | 24.38 | 0.000 - 6.495 | 114 | 1,2,4,5 | ||
| Fe III | 1914.066 | 16.18 | 3.727 - 10.200 | 7 |
Note. — All wavelengths are in vacuum. (1) Ralchenko, Yu., Kramida, A.E., Reader, J., and NIST ASD Team (2008). NIST Atomic Spectra Database (version 3.1.5). Available at: http://physics.nist.gov/asd3. 2: Feibelman & Aller (1987). 3: computed following Shaw & Dufour (1995). 4: Morton (1991). 5: Feldman (1992). 6: Zheng (1988). 7: Wavelength and from Ekberg (1993), energy levels from Edlén and Swings (1942).
| Object name | Line | Flux 6cm (mJy) | Date | DIT | Nexp | Airmass | S/N | |||
|---|---|---|---|---|---|---|---|---|---|---|
| (1) | (2) | (3) | (4) | (5) | (6) | (7) | (8) | (9) | (10) | (11) |
| J00103-0037 | 18.39 | 3.1546 | 1 | -25.68 | 0.40 | 2006-11-08 | 1139 | 3 | 1.16, 1.13, 1.11 | 60 |
| J00521-1108 | 18.70 | 3.2364 | 2 | -25.39 | 0.43 | 2007-01-01 | 1199 | 3 | 1.15, 1.21, 1.29 | 41 |
| J01225+1339 | 18.24 | 3.0511 | 1 | -25.80 | * | 2006-11-08 | 1259 | 2 | 1.36, 1.32 | 92 |
| J02287+0002 | 18.20 | 2.7282 | 1 | -25.72 | 0.35 | 2006-12-16 | 1259 | 2 | 1.10, 1.12 | 67 |
| J02390-0038 | 18.68 | 3.0675 | 1 | -25.36 | 0.43 | 2006-11-07 | 1199 | 3 | 1.35, 1.46, 1.60 | 57 |
| J03036-0023 | 17.65 | 3.2319 | 1 | -26.44 | 0.34 | 2006-12-16 | 1259 | 2 | 1.11, 1.14 | 88 |
| J20497-0554 | 18.29 | 3.1979 | 1 | -25.79 | * | 2006-11-04 | 1259 | 2 | 1.52, 1.70 | 54 |
| J23509-0052 | 18.67 | 3.0305 | 1 | -25.36 | 0.41 | 2006-11-07 | 1199 | 3 | 1.10, 1.11, 1.14 | 62 |
| Ciii]1909 | Civ1549 | Siiv1397 | ||||||||||
|---|---|---|---|---|---|---|---|---|---|---|---|---|
| Object | BC | VBC | Siiii]1892 | Aliii1860 | Siii1814 | BC | blue | VBC | BC | blue | VBC | |
| J00103-0037 | 4.99 2.11 | 1.18 1.38 * | 2.91 1.03 | 1.99 0.81 | 1.13 0.82 : | 14.25 8.34 | 6.32 1.80 | 8.71 8.24 | 4.27 2.38 | 0.78 1.52 | 0.54 0.89 | |
| J00521-1108 | 3.08 0.36 | 0.01 0.12 * | 2.77 0.66 | 1.55 0.85 | 1.06 0.90 | 10.89 2.37 | 1.40 2.23 | 8.27 2.63 | … | … | … | |
| J01225+1339 | 10.71 1.35 | … | 8.26 1.33 | 4.35 2.09 | 1.01 0.98 | 22.73 6.04 | 14.21 1.52 | … | 11.21 2.93 | 6.66 1.93 | … | |
| J02287+0002 (1) | 5.28 1.56 | 0.01 0.02 * | 4.70 2.01 | 2.29 1.13 | 0.98 0.79 | 7.64 5.00 | 7.66 2.32 | 0.77 1.63 * | 4.96 1.04 | 1.35 0.80 | 0.43 0.56 | |
| J02287+0002 (2) | 6.86 1.56 | 0.02 0.02 * | 2.78 2.01 | 1.77 1.13 | 0.94 0.79 | 11.48 5.00 | 2.99 2.32 | 0.64 1.63 * | 4.88 1.04 | 1.24 0.80 | 0.57 0.56 | |
| J02390-0038 | 3.57 0.78 | 1.26 0.88 | 3.50 0.40 | 2.41 0.64 | 0.90 0.83 | 7.51 1.25 | 7.92 1.37 | 2.04 1.52 | 2.64 0.53 | 1.49 0.81 | 0.23 0.39 | |
| J03036-0023 | 13.24 1.09 | … | 11.82 1.21 | 5.17 1.48 | 1.53 1.16 : | 29.46 3.54 | 20.60 3.34 | … | 11.13 1.86 | 7.37 4.12 | … | |
| J20497-0554 | 8.04 1.09 | … | 7.43 0.56 | 3.01 1.25 | 1.52 1.51 : | 18.39 2.17 | 9.23 2.24 | … | 6.65 2.51 | 1.95 1.06 | … | |
| J23509-0052 | 5.24 1.21 | … | 4.61 1.62 | 1.50 0.50 | 0.40 0.36 | 9.24 1.17 | 7.80 2.36 | … | 3.61 1.49 | 2.93 1.34 | … | |
| Extreme Objects | ||||||||||||
| J12014+01161 | 5.52 1.07 | … | 16.16 5.90 | 14.03 2.54 | 4.90 2.95 | 21.18 12.48 | 29.37 9.98 | … | 18.45 6.55 | 11.81 9.08 | … | |
| 3C 390.3 | 3.74 1.15 | 4.30 0.68 | 2.32 0.43 | 0.23 0.32 * | 0.40 0.48 * | 30.04 4.99 | … | 56.44 10.66 | … | … | … | |
Note. — (a) Units are ergs s-1 cm-2 Å-1. (1) Considering . (2) Considering . (:) Siii1814 approximated values due the line is affected by telluric absorptions (see Fig. 1). We do not measure Siiv1397 for J00521-1108 and 3c390.3 because they have low S/N. (*) Consistent with no emission.
| Object | Niv]1486 | Siii1533 | Heii1640 | |
|---|---|---|---|---|
| BC | blue | |||
| J00103-0037 | 2.4 1.9 | 1.1 0.8 | 1.3 0.4 | 2.0 1.8 |
| J00521-1108 | 0.1 0.2 | 1.1 1.1 | 1.6 1.2 | 0.1 0.2 |
| J01225+1339 | … | 1.0 1.8 | 3.2 3.4 | 4.3 1.8 |
| J02287+0002 (1) | … | 1.0 0.8 | 0.3 0.1 | 0.2 0.2 |
| J02287+0002 (2) | … | 0.9 0.8 | 0.2 0.1 | 0.0 0.2 |
| J02390-0038 | 0.5 0.9 | 0.9 0.9 | 0.2 0.4 | 1.6 1.1 |
| J03036-0023 | … | 1.5 1.2 | 0.5 0.5 | 9.2 3.4 |
| J20497-0554 | 0.3 0.6 | 1.5 1.5 | 1.8 0.8 | 4.6 2.7 |
| J23509-0052 | … | 0.4 0.4 | 0.2 0.9 | 2.5 1.6 |
| Extreme Objects | ||||
| J12014+01161 | 3.0 3.5 | 4.9 5.8 | 1.5 1.7 | 10.3 9.2 |
| 3C 390.3 | 5.6 2.7 | 1.6 1.5 | 2.8 1.5 | … |
Note. — (a) Units are ergs s-1 cm-2 Å-1. (1) Considering . (2) Considering . We do not show Heii1640VBC because is very weak, when is considered.
| Object | Ciii]1909BC | Ciii]1909Tot | Siiii]1892 | Aliii1860 | Siii1814 | Civ1549BC | Civ1549Tot | Siiv1397BC | Siiv1397Tot |
|---|---|---|---|---|---|---|---|---|---|
| J00103-0037 | 13.7 5.8 | 17.1 7.2 | 7.9 3.0 | 5.3 2.8 | 2.9 2.5 : | 29.0 16.1 | 59.6 24.4 | 7.4 4.32 | 9.68 6.74 |
| J00521-1108 | 8.2 1.5 | 8.2 2.4 | 7.3 2.5 | 4.0 2.6 | 2.6 3.1 | 21.0 18.9 | 40.1 26.8 | … | … |
| J01225+1339 | 15.3 3.5 | … | 11.6 3.1 | 6.0 3.6 | 1.4 2.3 | 25.5 9.1 | 41.6 9.7 | 11.1 3.95 | 17.74 4.71 |
| J02287+0002 (1) | 15.9 5.3 | 15.9 5.3 | 14.1 6.6 | 6.8 4.0 | 2.9 2.6 | 20.4 10.5 | 42.9 16.8 | 12.7 3.04 | 17.30 4.03 |
| J02287+0002 (2) | 20.5 5.3 | 20.5 5.3 | 8.3 6.6 | 5.2 4.0 | 2.7 2.6 | 30.8 10.5 | 40.6 16.8 | 12.7 3.04 | 17.85 4.03 |
| J02390-0038 | 10.8 3.3 | 14.7 4.5 | 10.4 2.0 | 7.0 2.4 | 2.5 2.5 | 16.3 4.1 | 37.7 7.0 | 4.9 1.32 | 11.72 4.15 |
| J03036-0023 | 12.4 1.8 | … | 10.9 1.8 | 4.6 1.6 | 1.3 1.1 : | 19.7 3.7 | 33.3 4.8 | 6.4 1.46 | 10.71 2.94 |
| J20497-0554 | 15.5 3.5 | … | 14.1 2.3 | 5.6 2.9 | 2.7 2.9 : | 25.4 5.6 | 38.1 7.1 | 8.0 3.75 | 10.34 4.04 |
| J23509-0052 | 15.8 4.0 | … | 13.7 5.3 | 4.4 1.8 | 1.1 0.9 | 22.0 4.2 | 40.5 10.6 | 7.7 3.73 | 14.02 5.10 |
| Extreme Objects | |||||||||
| J12014+0116 | 2.9 0.9 | … | 8.4 4.1 | 7.1 2.0 | 2.4 1.9 | 8.2 5.6 | 19.4 7.4 | 6.03 2.76 | 9.85 4.37 |
| 3C 390.3 | 13.1 4.3 | 28.4 6.2 | 7.9 3.3 | 0.7 0.8 | 1.2 1.3 | 49.1 8.1 | 147.2 19.4 | … | … |
Note. — (1) Considering . (2) Considering . (:) Siii1814 approximated values due the line is affected by telluric absorptions.
| Log | Log | Log | ||||||||||||
|---|---|---|---|---|---|---|---|---|---|---|---|---|---|---|
| Object | low dens | low dens | low dens | low dens | low dens | low dens | ||||||||
| J00103-0037 * | 12.50 0.17 | … | … | … | -2.79 0.19 | … | … | … | 9.71 0.22 | … | ||||
| J00521-1108 | 12.43 0.26 | 12.84 0.23 | … | … | -2.86 0.15 | -3.00 0.11 | … | … | 9.58 0.26 | 9.85 0.22 | ||||
| J00103-0037 * | 12.50 0.17 | … | … | … | -2.79 0.19 | … | … | … | 9.71 0.22 | … | … | … | ||
| J00521-1108 | 12.43 0.26 | 12.84 0.23 | … | … | -2.86 0.15 | -3.00 0.11 | … | … | 9.58 0.26 | 9.85 0.22 | … | … | ||
| J01225+1339 | 12.45 0.22 | 13.24 0.20 | 11.47 0.28 | 12.62 0.25 | -2.96 0.09 | -3.42 0.18 | -1.83 0.11 | -2.79 0.68 | 9.49 0.21 | 9.82 0.23 | 9.64 0.27 | 9.83 0.66 | ||
| J02287+0002 (1) | 12.35 0.16 | … | 11.64 0.33 | 12.28 0.28 | -2.81 0.28 | … | -2.33 0.25 | -2.58 0.98 | 9.55 0.28 | … | 9.31 0.36 | 9.70 0.94 | ||
| J02287+0002 (2) | 12.47 0.16 | … | … | … | -2.81 0.28 | … | … | … | 9.67 0.28 | … | … | … | ||
| J02390-0038 | 12.75 0.12 | 13.42 0.21 | 11.97 0.15 | 13.20 0.13 | -3.18 0.05 | -3.60 0.07 | -2.19 0.08 | -3.29 0.13 | 9.57 0.11 | 9.82 0.20 | 9.78 0.15 | 9.91 0.15 | ||
| J03036-0023 | 12.32 0.14 | 12.92 0.15 | … | … | -2.92 0.06 | -3.34 0.05 | … | … | 9.40 0.14 | 9.58 0.15 | … | … | ||
| J20497-0554 | 12.26 0.25 | 12.82 0.18 | … | … | -2.89 0.12 | -3.29 0.13 | … | … | 9.37 0.25 | 9.53 0.19 | … | … | ||
| J23509-0052 | 12.13 0.24 | 12.90 0.17 | 10.86 0.23 | 12.12 0.58 | -2.89 0.09 | -3.51 0.21 | -1.93 0.13 | -2.99 0.82 | 9.24 0.24 | 9.39 0.23 | 8.93 0.23 | 9.13 0.86 | ||
| Extreme Objects | ||||||||||||||
| J12014+01161 | 12.81 0.29 | 12.95 0.16 | 12.34 0.11 | 12.90 0.42 | -2.85 0.18 | -2.87 0.08 | -2.41 0.25 | -3.20 0.58 | 9.97 0.30 | 10.09 0.16 | 9.93 0.25 | 9.70 0.62 | ||
| 3C 390.3 | 10.05 0.34 | … | … | … | -1.48 0.34 | … | … | … | 8.57 0.41 | … | … | … | ||
Note. — We also show the values considering the correction by the contribution of low density regions (§7.3), (§8.1), and with the correction by the contribution of low density regions. (1) Considering . (2) Considering . (*) For J00103-0037 the correction is too large to be reliable. We show in bold numbers the ones that we consider the best.
| Object | f(1700Å)a | f(1350Å)a | FWHMBC | Pop. | Log() [cm]b | Log() []b | |||||||||
|---|---|---|---|---|---|---|---|---|---|---|---|---|---|---|---|
| [km s-1] | original | low dens | low dens | original | low dens | low dens | V&P (2006)c | ||||||||
| (1) | (2) | (3) | (4) | (5) | (6) | (7) | (8) | (9) | (10) | (11) | (12) | (13) | (14) | (15) | |
| J00103-0037 | 6.51 | 4.8 1.0 | 6.8 1.4 | 4500 800 | B | 18.10 0.12 | … | … | … | 9.16 0.20 | … | … | … | 9.11 | |
| J00521-1108 | 6.59 | 6.1 1.5 | 8.8 2.1 | 5300 1600 | B | 18.23 0.14 | 18.09 0.13 | … | … | 9.43 0.30 | 9.29 0.29 | … | … | 9.32 | |
| J01225+1339 | 6.42 | 8.1 1.6 | 10.9 2.2 | 4400 1000 | A† | 18.32 0.12 | 18.16 0.13 | 18.25 0.15 | 18.15 0.33 | 9.36 0.23 | 9.20 0.23 | 9.29 0.25 | 9.19 0.39 | 9.19 | |
| J02287+0002 (1) | 6.09 | 7.4 2.7 | 8.4 3.0 | 4700 1000 | A† | 18.25 0.16 | … | 18.37 0.20 | 18.17 0.48 | 9.35 0.25 | … | 9.47 0.27 | 9.27 0.51 | 9.17 | |
| J02287+0002 (2) | 18.19 0.16 | … | … | … | 9.29 0.25 | … | … | … | |||||||
| J02390-0038 | 6.45 | 6.9 2.1 | 9.9 3.0 | 5400 1000 | B | 18.25 0.09 | 18.12 0.12 | 18.14 0.10 | 18.08 0.10 | 9.46 0.18 | 9.34 0.20 | 9.36 0.19 | 9.30 0.19 | 9.35 | |
| J03036-0023 | 6.58 | 20.5 5.7 | 30.0 8.4 | 3700 600 | A | 18.58 0.10 | 18.49 0.10 | … | … | 9.47 0.17 | 9.38 0.17 | … | … | 9.30 | |
| J20497-0554 | 6.55 | 6.6 1.3 | 9.5 1.9 | 3800 600 | A | 18.34 0.13 | 18.26 0.11 | … | … | 9.25 0.19 | 9.17 0.18 | … | … | 9.04 | |
| J23509-0052 | 6.40 | 4.8 1.0 | 6.1 1.2 | 3600 800 | A | 18.33 0.13 | 18.25 0.12 | 18.49 0.13 | 18.38 0.43 | 9.19 0.23 | 9.12 0.23 | 9.35 0.23 | 9.25 0.47 | 8.88 | |
| Extreme Objects | |||||||||||||||
| J12014+01161 | 6.58 | 21.8 2.3 | 31.9 3.2 | 4000 800 | A | 18.31 0.15 | 18.25 0.09 | 18.33 0.13 | 18.44 0.31 | 9.26 0.23 | 9.20 0.19 | 9.28 0.22 | 9.40 0.43 | 9.37 | |
| 3C 390.3 | 0.24 | 4.2 0.7 | 9.9 1.6 | 6400 2200 | B | 17.23 0.21 | … | … | … | 8.60 0.37 | … | … | … | 7.99 | |
Note. — (a) Units of the flux at 1350 and 1700Å are in ergs s-1 cm-2 Å-1. (b) The showed values are the average 0.17 dex of the computation using both SED of Laor (1997) and Mathews & Ferland (1987) (see Fig. 20. (c) We show the comparison between our computations and those using the Vestergaard & Peterson (2006) mehtod. They report an uncertainty of 0.66 dex. (†) Acording to the FWHM it is clasified as pop B, but has other spectral caracteristics of pop. A objects. See §5. (1) Considering . (2) Considering