MID-INFRARED SPECTROPHOTOMETRIC OBSERVATIONS OF FRAGMENTS B AND C OF COMET 73P/SCHWASSMANN-WACHMANN 3
Abstract
We present mid-infrared spectra and images from the GEMINI-N (Michelle) observations of fragments SW3-[B] and SW3-[C] of the ecliptic (Jupiter Family) comet 73P/Schwassmann-Wachmann 3 pre-perihelion. We observed fragment B soon after an outburst event (between 2006 April 16 – 26 UT) and detected crystalline silicates. The mineralogy of both fragments was dominated by amorphous carbon and amorphous pyroxene. The grain size distribution (assuming a Hanner modified power-law) for fragment SW3-[B] has a peak grain radius of µm, and for fragment SW3-[C], µm; both values larger than the peak grain radius of the size distribution for the dust ejected from ecliptic comet 9P/Tempel 1 during the Deep Impact event ( µm). The silicate-to-carbon ratio and the silicate crystalline mass fraction for the submicron to micron-size portion of the grain size distribution on the nucleus of fragment SW3-[B] was and , respectively, while on the nucleus of fragment SW3-[C] was and , respectively. The similarity in mineralogy and grain properties between the two fragments implies that 73P/Schwassmann-Wachmann 3 is homogeneous in composition. The slight differences in grain size distribution and silicate-to-carbon ratio between the two fragments likely arises because SW3-[B] was actively fragmenting throughout its passage while the activity in SW3-[C] was primarily driven by jets. The lack of diverse mineralogy in the fragments SW3-[B] and SW3-[C] of 73P/Schwassmann-Wachmann 3 along with the relatively larger peak in the coma grain size distribution suggests the parent body of this comet may have formed in a region of the solar nebula with different environmental properties than the natal sites where comet C/1995 O1 (Hale-Bopp) and 9P/Tempel 1 nuclei aggregated.
1 INTRODUCTION
Comet nuclei contain some of the least thermally- and least aqueously-altered materials extant in the solar system and are highly porous agglomerates of ice and dust grains, perhaps with highly stratified, inhomogeneous layers of varied density, porosity, and composition (Harker et al., 2007; Belton et al., 2006) formed by layered accretion of icy planetesimals. The latter may or may not have aggregated from specific radial zones in the protoplanetary disk to form the nascent nuclei of comets, ultimately giving rise to the two comet families, ecliptic comets (ECs; including Jupiter Family comets and active Centaurs) and nearly isotropic comets (NICs; including long-period Oort cloud and Halley-type comets).
Recent dynamical models by the ‘Nice group’ indicate that Jupiter ejected bodies from the solar system’s gravitational potential and into the Oort Cloud to become NICs. Comet nuclei that formed in the trans-Neptune region, in situ in the Kuiper Belt (KB), and the possible few ejected by Jupiter into the KB, survived dynamically to become ECs (Morbidelli et al., 2004; Whitman et al., 2006). As collisions are frequent in the Kuiper Belt (Pan et al., 2005), Jupiter-family comets (ECs) could be chips off of larger Kupier Belt Objects (KBOs). Therefore, the structure of EC nuclei may be very different from NICs. On the other hand, Oort cloud (NIC) comets (i.e., long-period) were gravitationally scattered to the Oort cloud (Oört, 1951) where they suffered no further collisions (Stern, 2003). Once perturbed into the inner solar system, NICs have short life times compared to EC comets (A’Hearn et al., 1985). ECs have notably less activity than NICs (A’Hearn et al., 1985; Meech & Svoren, 2004). Lower activity and lower dust production rates result in less thermal dust emission making dust properties of ECs relatively unknown compared to brighter NICs (Wooden et al., 2007; Sitko et al., 2004; Hanner, Lynch, & Russell, 1994).
The strongest tests for new dynamical models of solar system formation processes are the compositions of comets, and in particular, the diversity of the gas-to-dust ratio and dust composition within any given comet’s coma coupled with variations in the latter physical characteristics (among others) between comets within a dynamical family and between dynamical families. Notably, solar nebula models for thermal processing and radial transport (Boss, 2004; Cuzzi et al., 1993) of grains are constrained by the crystalline silicate mass fraction deduced for comets (Wooden et al., 2007; Wooden, 2005), as well as the (controversial) presence of aqueous altered grain components. Amorphous silicates in comets are thought to be presolar ISM silicate grains (Wooden, 2002; Hanner & Bradely, 2004) because of their high abundance in the ISM (Li & Draine, 2001) and ubiquitous presence as glassy spherules (GEMS) in cometary interplanetary dust particles (Bradley, 1994; Bradley et al., 1999; Hanner & Bradely, 2004). On the other hand, crystalline silicates are relatively rare (2.2 – 5%) in the ISM (Kemper et al., 2004, 2005; Li & Draine, 2001) yet are abundant in many comets. Crystalline silicates in comets are either high-temperature (1450 K) condensates (Grossman, 1972), or amorphous silicates annealed into crystals at 1000 K (Hallenbeck et al., 1998; Wooden, 2005; Wooden et al., 2007) in the inner zones of the early (0.3 Myr-old) solar nebula (Bockelée-Morvan et al., 2002), or annealed in nebular shocks at 5-10 AU (1 Myr-old) (Harker & Desch, 2002). In models of turbulent mixing, the early formation of crystals in the hot inner zones of the solar nebula are concurrent with rapid disk spreading (0.3 Myr) suggests a uniform crystalline-to-amorphous silicate ratio between comets (Bockelée-Morvan et al., 2002). In contrast, viscous dissipation models may yield a radial gradient in the crystalline silicate mass fraction that spreads to only 20 AU in 1 Myr (Wooden et al., 2007; Ciesla, 2007), making it harder to explain crystals in comets that formed in the trans-Neptune zone. Strong constraints for nebula models include the high crystalline silicate mass fraction (25%–50%) deduced from modeling NIC C/1995 O1 (Hale-Bopp) (Harker et al., 2004), NIC C/2001 Q4 (NEAT) (Harker et al., 2005; Wooden et al., 2004), the ejecta from the EC 9P/Tempel 1 during Deep Impact (Harker et al., 2005, 2007), and the EC 78P/Gehrels 2 (Watanabe et al., 2005). Stardust samples from EC 81P/Wild 2 contain abundant crystalline silicates (Ebel et al., 2006) and even higher temperature calcium-aluminum inclusion (CAI)-type minerals. In contrast, other ECs have a low (50%) crystalline silicate mass fractions: pre-impact 9P/Tempel 1 (Lisse et al., 2006), 103P/Hartley 2 (Crovisier et al., 2000; Crovisier, 1999), and 29P/Schwassmann-Wachmann 1 (Stansberry et al., 2004). Thus, assessing the composition of cometary nuclei is critical to understanding the origins of comets (Ehrenfreund et al., 2004; Hanner & Bradely, 2004; Crovisier, 2007) and the formation of the solar system.
Contrasts between EC and NIC family grain properties often rely on comparisons between ground-based remote-sensing studies and the in situ sampling of coma dust in comets such as 1P/Halley, 81P/Wild 2 or the 9P/Tempel 1 (henceforth 9P) Deep Impact ejecta analysis. Frequently, the 10 µm spectra of short-period ECs exhibit a broad and weak 10 µm feature, of order 10-20% above the 8 to 13 µm blackbody continuum (Hanner & Zolensky, 2010) and little evidence for the presence of crystalline silicates – a result of space weathering, thermal processing, and de-volatilization arising from frequent perihelion passage, whereas in NIC comets such emission is common (Kelley & Wooden, 2009). Surprisingly, the Deep Impact event excavated sub-surface materials containing a significant population of small grains, including crystalline silicate species, unlike the grain population dominant in the quiescent coma of the EC 9P. The observed 10 and 20 µm spectra and composite thermal spectral energy distribution (SED) models of the 9P dust ejecta were similar in characteristics to those deduced for the coma grains in comet C/1995 O1 (Hale-Bopp), a NIC. Harker et al. (2007), Sugita et al. (2005), and Lisse et al. (2006) among others conjectured that the interior of 9P may be comprised of less processed, more primitive, or pristine grain material. Therefore, inference between comet families drawn from the study of coma dust is a challenge. The assertion that ECs are compositionally distinct from NICs as a class is no longer valid based on the Deep Impact experiment (Hanner & Zolensky, 2010).
In its 1995 apparition, the Jupiter-family comet 73P/Schwassmann-Wachmann 3 (henceforth SW3) exhibited a sudden increase in brightness (Crovisier et al., 2006) near perihelion breaking into three bright fragments and several fainter components (Scotii et al., 1996). The observing geometry of SW3’s next perihelion passage (orbital period yr) was not very favorable for Earth-based observers (Sekanina, 2005). During SW3’s 2006 return to perihelion fragments were detected (Weaver et al., 2008), many of which were remnants of the splitting event of 1995 (Reach et al., 2009). Fragments SW3-[B] and [G] continued to split, and swarms of mini-comets were discovered in Hubble Space Telescope images of the tails of these fragments (Weaver et al., 2008). Fragmentation of this comet’s nucleus, a natural analogy to the Deep Impact mission, provided a rare opportunity to observe potentially pristine material from the progenitor interior (Della Russo et al., 2007).
Here we present mid-infrared narrowband imagery and spectroscopy (§2) and coma dust mineralogy derived from thermal grain models (§ 3) of the two largest surviving fragments, SW3-[B] and SW3-[C] during the 2006 apparition, discussing comparison (§4) between grain properties of this comet (one of the most active known ECs) to the putatively more primitive dust populating the coma of NIC comets such as C/1995 O1 (Hale-Bopp). Our conclusions are summarized in §5.
2 OBSERVATIONS
Mid-infrared (IR) 10 µm spectra and 10 and 20 µm images of fragments SW3-[B] and SW3-[C] of comet SW3 pre-perihelion (perihelion 2006 June 08 UT) on 2006 April 29.5 UT (fragment SW3-[B]) and 2006 April 30.5 UT (fragment SW3-[C]) were obtained using the Michelle imaging spectrograph on the 8-m Fredrick C. Gillett telescope (Gemini-N) on Mauna Kea, Hawaii conducted under program GN-2006A-DD-1. In addition, we obtained 20 µm spectra of fragment SW3-[B]. The observational summary is shown in Table 1.
Michelle has several mid-IR broad and narrow band filters (Alistair et al., 1997). For our observations, we used two narrow band filters: 1) the Si-5 filter with a central wavelength of 11.6 µm and width of 9.5%; and 2) the Qa filter with a central wavelength of 18.1 µm and width of 10.7%. Common mid-IR observing techniques (e.g., Joyce, 1992), chopping the secondary (″ at a angle in the NW-SE direction) and nodding the telescope (″ in the NW-SE direction) to reduce the thermal noise from the background and avoid contamination from the coma extending to the south west for both comets, were utilized. The brightness of the coma in the NW-SE direction for both fragments drops to the value of the background at 11.2 µm ( mJy arcsec-2) at 6″ away from the centralized core. A final image is produced by subtracting the two nod pairs.
Michelle uses a grating to produce spectra with wavelength coverage of µm and µm within the 10 µm and 20 µm ground-based atmospheric windows, respectively. A 0.6″ wide slit was used for all of our spectral observations, providing a resolution of and at 10 µm and 20 µm, respectively. We chopped on array at the maximum allowable chop throw of 15″ along the slit direction, perpendicular to the dispersion axis of Michelle.
Extraction of the comet and standard star spectra from the two-dimensional images used common mid-IR data reduction techniques (Joyce, 1992): 1) two nod pairs are subtracted to produce a background subtracted image which contains both a positive and negative spectrum; 2) two extractions (spatial dimension of 1.0″ yielding an effective aperture diameter of 0.87″) are made to produce each spectrum: one is the source spectrum, and the other is extracted 6″ to the north of the source spectrum for the purpose of calculating the residual background; 3) all of the counts at each pixel (i.e., wavelength) inside the source aperture are summed; 4) the sky extraction is used to calculate a median residual background value and variance, which is used to calculate the photometric error for the object spectrum; and 5) the median sky value is subtracted from the object spectrum. Nominally, a residual sky spectrum to the south of the source spectrum is also used to calculate the background value and variance. However, in this case, for both fragments, there is emission from the extended coma in this southern direction. Therefore, we have relied only on the northern sky extraction. Using this technique does not affect the overall value of the sky, but simply does not enable better constraint of the uncertainties in the sky variances. This uncertainty is reflected in the larger 1-sigma error in the final spectrum. We increased the signal-to-noise of the data with a 3-point statistically weighted average boxcar function. This operation decreased the spectral resolution to at 10 µm. The spectral resolution is sufficient to identify mineral resonances that may exist (Harker et al., 2002; Wooden et al., 1999). In 100.8 s of on-source integration time, a given flux point in the final spectra has a root-mean-square (RMS) error of W cm-2 m-1.
Cohen standards (Cohen et al., 1996) which provide superior IR spectrophotometric calibration, and ATRAN atmospheric models (Lord, 1993) are used to flux calibrate the spectra and correct for atmospheric extinction. The object spectrum is multiplied by the Cohen stellar template, divided by the extracted instrument spectrum of the standard, and finally multiplied by the ratio of the atmospheric transmission spectra calculated for the airmass of the comet and standard star. Photometric standards were also used to assess the seeing and derive estimates of the point-spread function (PSF). The average PSF FWHM was 0.4′′ at 11.6 µm and 0.5′′ at 18.1 µm.
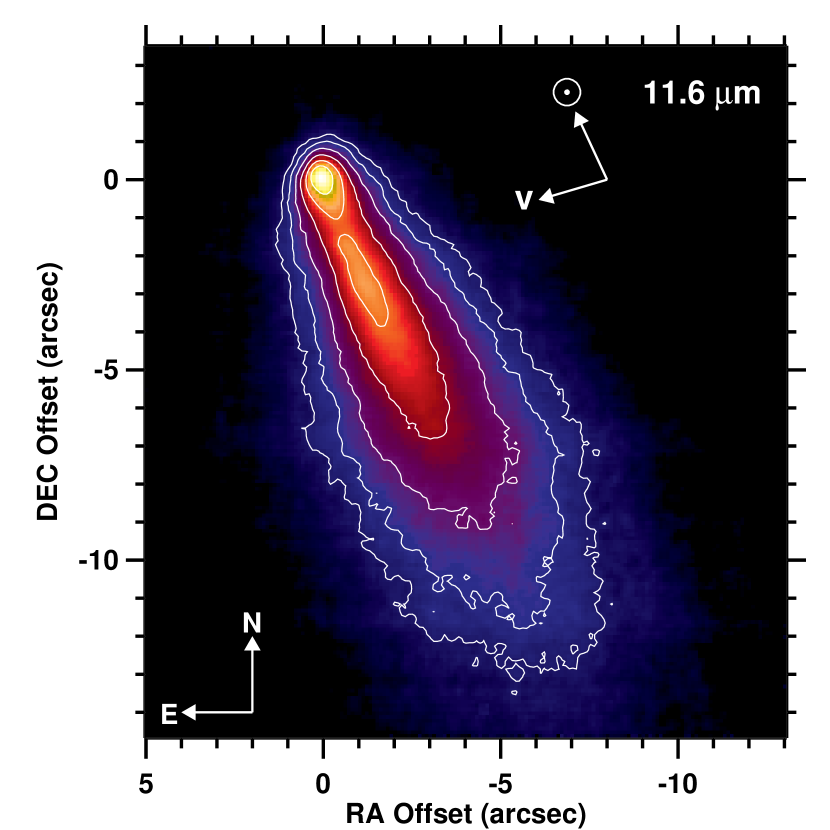
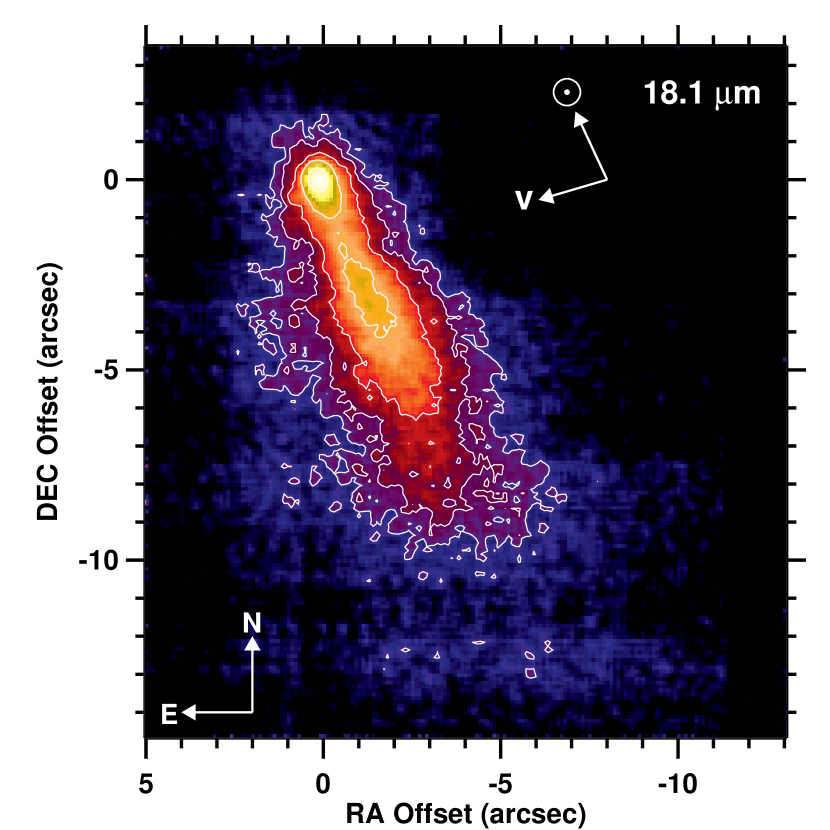
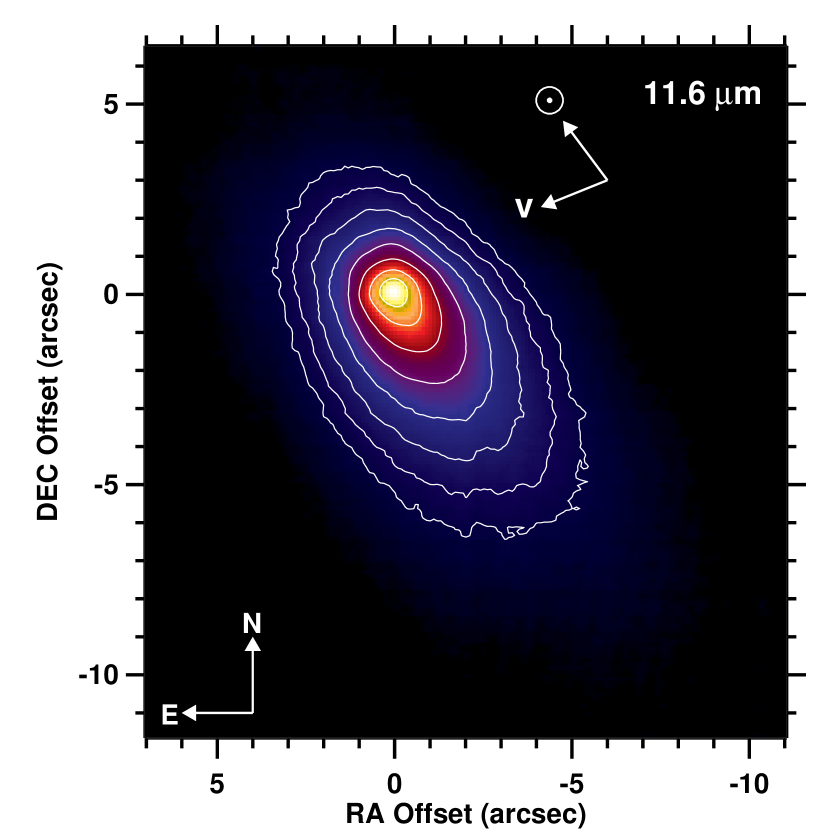
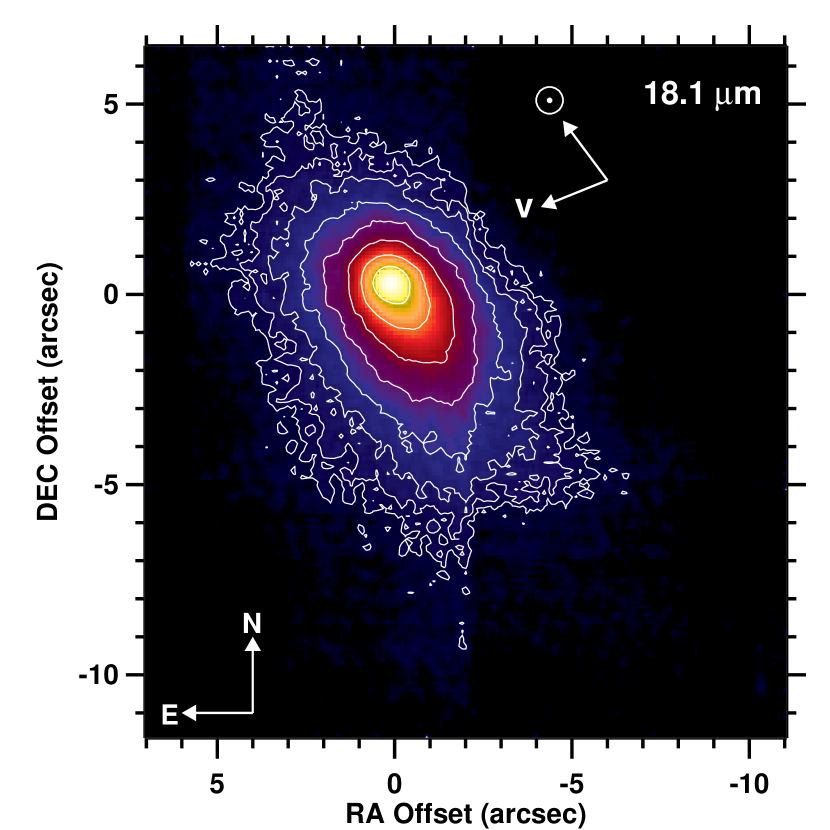
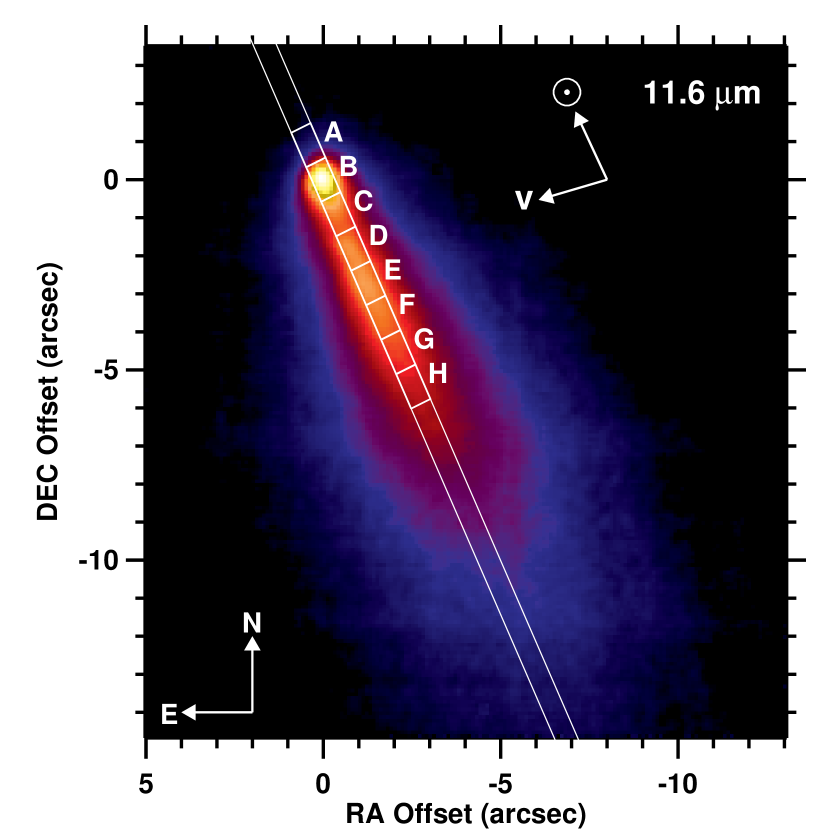
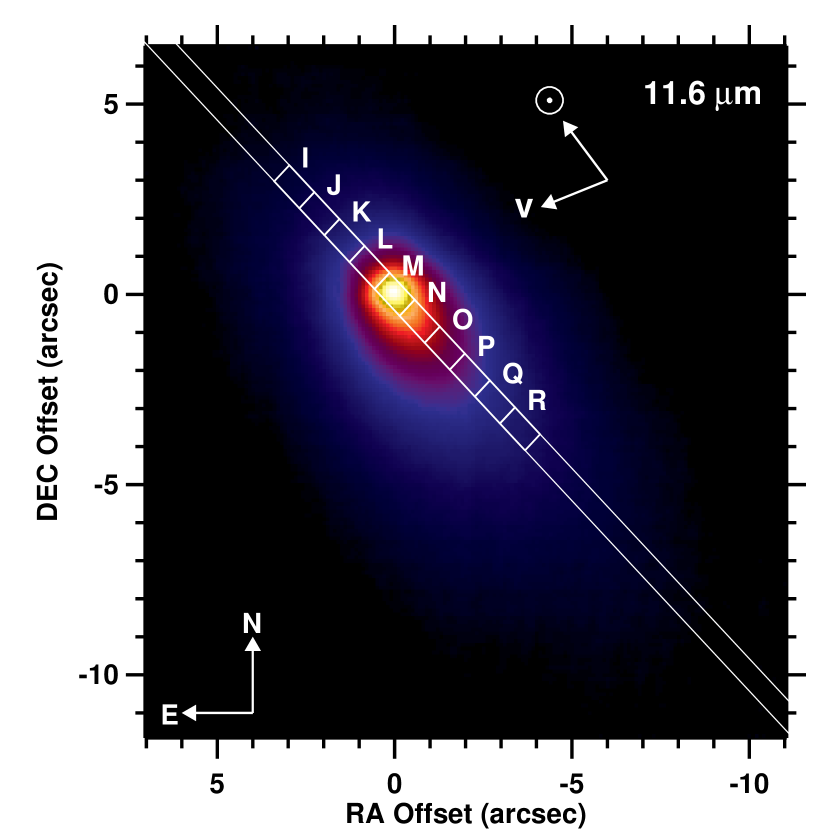
Figure 1 shows the 11.6 and 18.1 µm images of fragments SW3-[B] and SW3-[C], respectively. The 3-sigma detection limit of the coma of SW3-[B] extends ″ from the central nucleus region towards the south western direction at a position angle (PA) in both images. Notably, there is a region of enhanced flux (32% above the expected flux of a standard decline in coma surface brightness, where is the projected distance from the nucleus) approximately 3″ away from the centralized condensed region that is observed at both wavelengths. The coma of SW3-[C] is fairly condensed (0.6″ at 11.6 µm), the 3-sigma detection limit of the coma extending only about ″ at PA. We note that more sensitive Spitzer MIPS24 observations of 73P, obtained less than a week after our Michelle observations (2006 May 4 – 5 UT), showed that the surface brightness of the coma of fragment SW3-[B] extended some 4′ while that of SW3-[C] extended (Reach et al., 2009). Isophote-contour maps derived from our SW3-[C] image do not reveal any enhanced regions of flux density, in contrast to the surface brightness morphology evident in the coma of fragment SW3-[B].
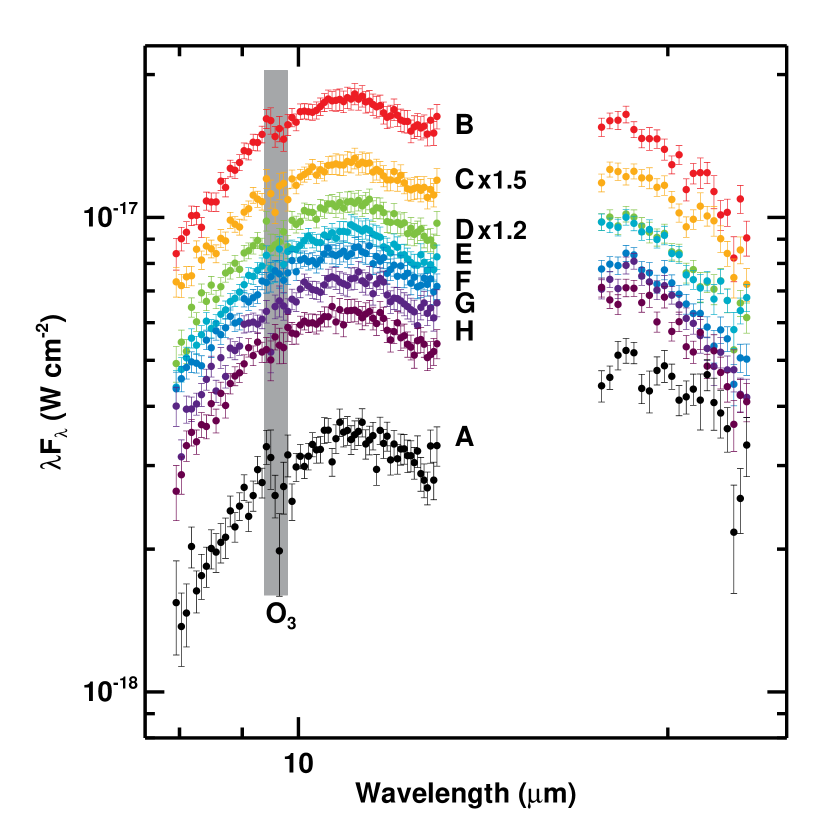
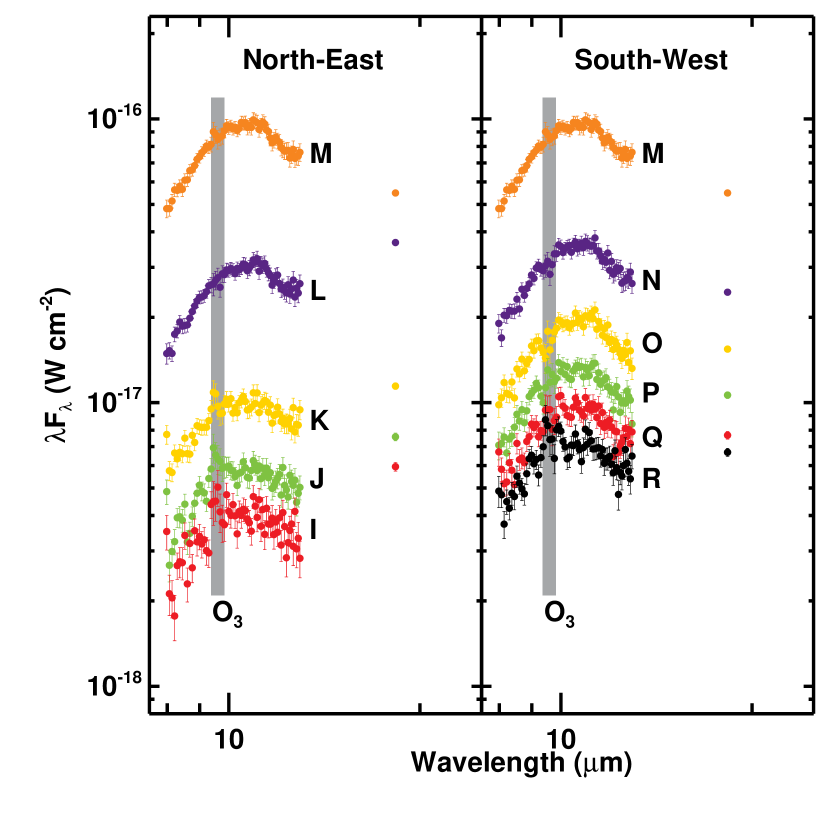
Figure 2 shows the location and orientation of the 0.6″ wide spectral slit during the observation of each fragment, the location and size of the extraction areas for the spectra, and the extracted spectra. The slits were centered on the peak of the azimuthally-averaged coma surface brightness profile, essentially coincident with the nucleus (unresolved at our platescale), and rotated to align along the direction of the extended coma. Individual spectra were extracted in 1.0″ segments in the spatial direction for mineralogical and grain analysis (§3).
The spectral extraction apertures centered on the nucleus contain both nuclear and coma fluxes. In order to study the coma dust properties, we need to properly assess the nuclear contribution to the flux. We can deconvolve the relative contribution of the nucleus flux to the coma by analyzing the high spatial resolution images at 11.6 µm. We take the PSF of the standard star HD 127665 as the shape of the nuclear contribution to the images. We assume a standard coma surface brightness decline. We derive the azimuthally-averaged cumulative photometry versus increasing , i.e., from the peak flux pixel, for the image and for the sum of a scaled PSF and the -coma. By -fitting the shape of the azimuthially-averaged coma profile, we constrain the contribution of the PSF to the image. By putting a synthetic beam of 0.6″ 1.0″ on this solution, the nucleus is found to contribute 1.4% 0.2% of the measured flux in the centered slit at 11.6 µm to a confidence level of 99% for fragment SW3-[B]. Our calculated scaling factor corresponds to an effective radius of the nucleus of 0.2 km 0.05 km for fragment SW3-[B], equal to the lower limit of the nucleus radius determined by Howell et al. (2007). The nucleus contribution is subtracted from the central extracted spectrum of fragment SW3-[B], so we only need to model the remaining coma grains. From the 11.6 µm image of fragment SW3-[C], we determine that the flux at the central region is produced solely from the surrounding coma, and that there is no contribution to the flux from the embedded nucleus (at the 99% confidence level). Therefore, we do not apply a correction to the spectrum for fragment SW3-[C].
3 MODEL OF THERMAL EMISSION FROM DUST GRAINS
The Harker et al. (2002) thermal emission dust code was used to model the observed dust grain emission in the coma of fragments SW3-[B] and SW3-[C]. The model assumes that an optically-thin collection of discrete (singular mineralogy) dust particles reside at the heliocentric () and geocentric () distance of the comet at the epoch of observations (Table 1). The 10 µm mineralogy used in the model is derived from laboratory studies of interplanetary dust particles (IDPs, Wooden et al., 2000), micrometeorites (Bradley et al., 1999), the NASA Stardust mission (Brownlee et al., 2006) and other remote sensing modeling efforts (e.g., Hanner, Lynch, & Russell, 1994; Harker et al., 2002; Wooden et al., 2004). Our selection of basic dust grain components is consistent with the major mineral groups used by other modelers to generate synthetic SEDs arising from dust thermal emission in the 10 µm region (Min et al., 2005; Sugita et al., 2005; Lisse et al., 2006; Werner et al., 2006). Amorphous silicates with chemical composition (stiochiometry) similar to olivine (Mgy,Fe(1-y))2SiO4 and pyroxene (Mgx,Fe(1-x))SiO3 with (i.e., ) reproduce the broad width of the 10 µm feature. Mg-rich orthopyroxene is detected through its 9.3 and 10.5 µm features (Wooden et al., 1999; Harker et al., 2002). Mg-rich crystalline olivine is uniquely identified through its distinct, relatively narrow 11.2 µm silicate feature (Hanner, Lynch, & Russell, 1994). Mg-rich crystalline species are defined as grains with a stoichometry of () (Wooden, 2008; Koike et al., 2003; Chihara et al., 2002).
Lastly, the presence of amorphous carbon grains in the coma is required in order to reproduce the underlying featureless emission (continuum) in the µm wavelength region. Other species such as PAHs, hydrous silicates (clays) and iron sulfides (see Werner et al., 2006; Gehrz et al., 2007), cannot be uniquely identified from our SW3 spectra. Therefore, these latter species are not included our model.
The amorphous grains are assumed to be spherical (Mie Theory) and range in size from µm. The indices of refraction used in Mie Theory to calculate the optical efficiencies of each amorphous silicate materials are from Dorschner et al. (1995) and the amorphous carbon is from Edoh (1983). The submicron sized crystalline olivine grains are modeled using a continuous distribution of ellipsoids (CDE) with one of the crystallographic axes elongated to a ratio of 10:1:1 to match the wavelength of the emission features with laboratory experiments (Fabian et al., 2001). The use of elongated grains is supported by polarization measurements of the diffuse interstellar medium which suggest the presence of elongated grains, and condensation experiments which show the formation of elongated forsterite (Mg-pure) crystals (Fabian et al., 2001). The radii of the crystalline olivine grains ranges from µm; larger crystals do not well match the shape of the observed resonances in comet Hale-Bopp (Min et al., 2005). The indices of refraction for the three crystallographic axes of the crystalline olivine between 3 and 250 µm are from Jäeger et al. (1998). The non-oriented crystalline olivine indices ranging from µm are from the Jena Laboratory Group111http://www.astro.uni-jena.de/Laboratory/Database/databases.html. The short wavelength indices are appended to each long wavelength axes prior to the CDE calculations. Note that the radius of the crystals is an “effective” radius, or the radius a crystal would be if it were spherical.
The temperature of each grain is calculated using a thermal equilibration calculation. In the coma, the grains reach radiative equilibrium quickly (Wooden, 1979) as they enter into the coma. The temperature of the crystalline olivine grains are calculated using the “hot crystal model” presented in Harker et al. (2002): the temperature of the crystalline olivine grains are increased by 1.9 times over those predicted from the optical constants in order to fit the Infrared Space Observatory (ISO) SEDs from comet C/1995 O1 (Hale-Bopp) at 2.9 AU (Croviser et al., 1997). The temperature increase was required to match the relative emission peak strengths in the 10 and 20 µm regions, and may be caused by crystals being in contact with warm material, or the crystals themselves contain some Fe making them Mg-rich, but not Mg-pure. We retain this “hot crystal model” in all of our comet modeling to compare results between comets, although the model awaits further constraining with additional long wavelength data from the comets observed by Spitzer (Kelley et al., 2006). An effect of using warm crystals in thermal models is the calculated dust species masses derived from mineral decomposition analysis are less than the mass fractions computed if cooler temperature grain populations were invoked. However, use of warm crystals does not affect the relative amount of crystalline silicates we calculate in the fragment comae of SW3.
For the grain size distribution, we use the Hanner modified power law (hereafter HGSD; Hanner, Lynch, & Russell, 1994). In the HGSD, the relative number of each grain size is calculated by: , where is the grain radius, µm, the minimum grain radius, and and are independent parameters. Since weights more of the larger radii particles and can be considered as the size distribution slope for large radii, it is best constrained at wavelengths longer than 13 µm. The value for is set at three different values in the model: 1) which weights more of the larger particles in the size distribution; 2) is the canonical value we determined from our modeling of comet C/1995 O1 (Hale-Bopp) (Harker et al., 2002); and 3) which weights more of the smaller particles in the size distribution. From the values of and , we also calculate the peak of the HGSD: . The value is not a freely varying parameter, but a calculated property of the size distribution. We varied such that changed by increments of 0.1 µm.
The amorphous dust can be modeled as porous grains (the crystals always remain solid). The fractal porosity of the amorphous grains is varied to create porous or “fluffy” particles (Lisse et al., 1998). The amount of vacuum is: with corresponding to solid grains and corresponding to the maximum fractal porosity allowed while still satisfying the assumptions of Mie Theory (Bazell & Dwek, 1990).
Finally, the flux (in W cm-2 µm-1) from each mineral is calculated by integrating over the grain size distribution between the minimum radius µm and the maximum grain radius µm,
| (1) |
where is the number of particles at the peak of the grain size distribution if the peak of is normalized to unity, is the geocentric distance of the dust grain, is the grain size distribution, is the emission efficiency for a grain of radius (µm) at wavelength (µm), and (K) is the heliocentric distance dependent (-dependent) dust temperature for a single grain size, , calculated by radiative equilibrium. The flux from each mineral species is coadded and fit to the Gemini spectra by varying . The best-fit is determined by calculating the lowest (reduced ) value at a confidence level of two-sigma.
4 RESULTS & DISCUSSION
4.1 Model Fits
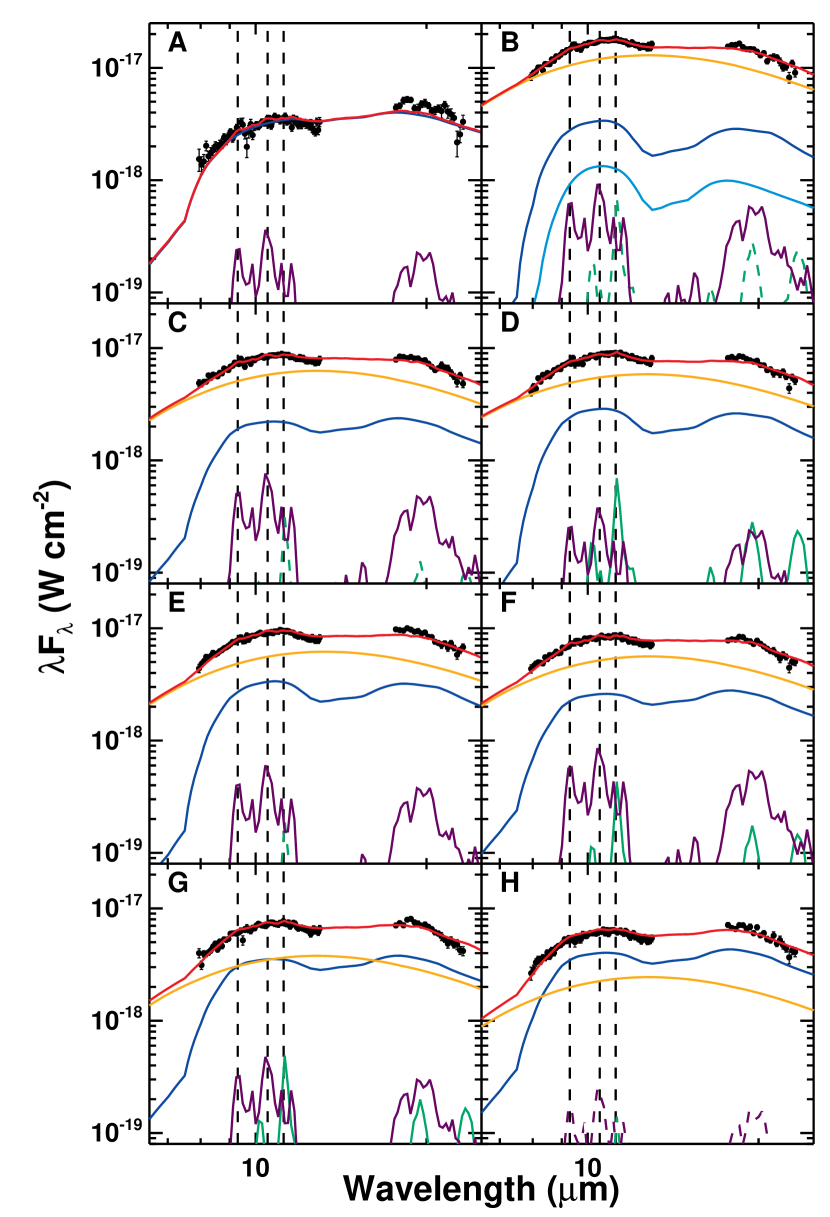
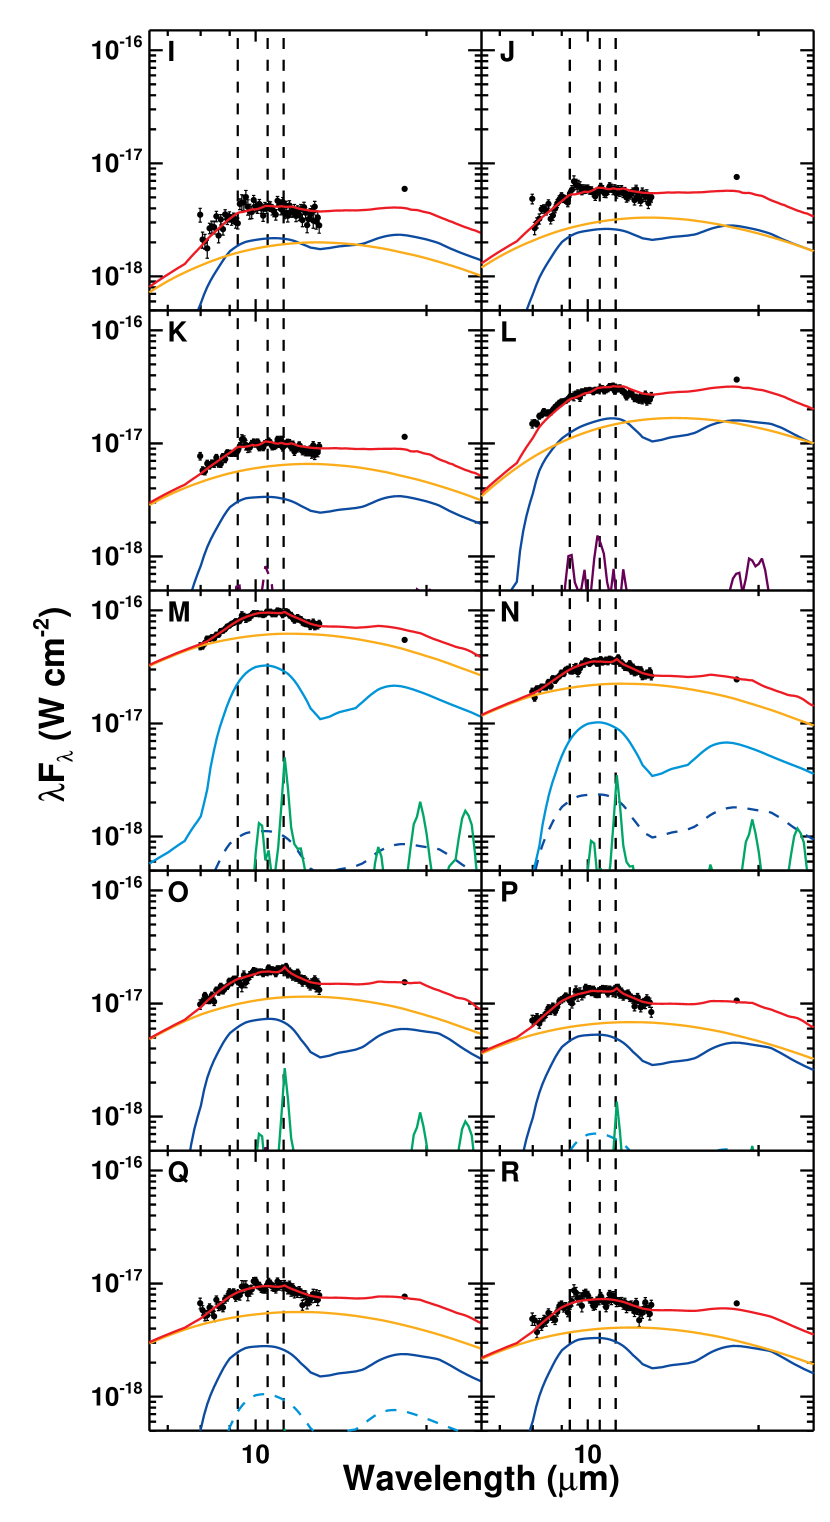
The best-fit model parameters for SW3-[B] are listed in Table 2 and the spectral decomposition is shown in Fig. 3. Similarly, the best fit model parameters for SW3-[C] are listed in Table 3 and the spectral decomposition is shown in Fig. 4.
The grain properties of both SW3 fragments are similar. The grains range from being solid to moderately fractally porous (). Fractally porous coma grains in SW3 fragments are also required to explain the high fractional polarization measured in the optical - and near-IR -band at high phase angles and throughout the comae of SW3-[B] and SW3-[C] by Jones et al. (2008). The peak of the HGSD for fragment SW3-[B] in the anti-sunward direction is slightly larger ( µm) than that of fragment SW3-[C] ( µm). However, the grain population in SW3 overall is not dominated by extremely small particles as was evident in the comae C/1995 O1 (Hale-Bopp) or 9P post-Deep Impact (Wooden et al., 1999; Harker, Woodward, & Wooden, 2005; Harker et al., 2007).
In both fragments, most of the thermal emission is dominated by amorphous (glassy) carbon and silicates. The silicate emission feature in both fragments is dominated by amorphous pyroxene grains, although there is some evidence for a population of amorphous olivine grains associated with the coma toward the nuclei of both fragments. Orthopyroxene is seen in the extended coma in both the sunward and anti-sunward direction of fragment SW3-[B], but only in the sunward direction, close to the nucleus (1″) in fragment SW3-[C]. A modest population of crystalline olivine grains is present in both fragments. The silicate crystalline mass fraction for the submicron to micron-size portion of the grain size distribution (Harker et al., 2002; Moreno et al., 2003), defined as (crystalline)/(crystalline + amorphous), for SW3-[B] ranges from at the nucleus, declining to at a cometocentric distance of 6.0″ out into the coma in the anti-sunward direction. The derived for SW3-[C] is towards the nucleus, declining to at a cometocentric distance of 5″ into the coma in the anti-sunward direction. Therefore, within the 1-sigma confidence level, both fragments have a similar crystalline silicate fraction. For many EC comets and in some NICs, the fraction of cometary grains that are Mg-rich is high (). In 9P, was found in the post-impact coma (Harker et al., 2007; Sugita et al., 2005). Overall, lack of significant mineralogical differences between SW3 fragments may indicate that the original nucleus of the comet was generally homogeneous in composition as opposed to that of 1P/Halley or 9P (Wooden, 2008).
The spectra of fragment SW3-[C] in the sunward direction are dominated by emission from amorphous pyroxene and carbon, with little to no emission from crystals (Table 3). The peak of the grain size distribution is also slightly larger (0.5 –1.3 µm) compared with the derived values in the anti-sunward direction (0.3 – 0.4 µm), in addition to being more solid than the latter. We attribute these differences in the grain properties to the dynamics of the grains as they are released from the nucleus of fragment SW3-[C]. Smaller and/or more porous grains which can exhibit crystalline emission are more easily affected by the radiation pressure or are better coupled to and entrained in the sublimating gas (e.g., (Harker et al., 2007; Orosei et al., 1995)). Likely these grains are more easily swept out into the anti-sunward direction. However, a full dynamical analysis of the trajectory of the grains is outside the scope of this work.
The relative abundance of amorphous carbon in the anti-sunward coma of SW3-[B] ranges between wt%, while for SW3-[C] the value ranges between wt%. The wt% of amorphous carbon in both fragments varies a little with distance from the nucleus (%) and is comparable to mean values deduced for other comets, especially ECs (10 to 50 wt%) comae (Wooden, 2008). For example Harker et al. (2002, 2004) find amorphous carbon abundance (relative to other refractory materials) of 21 wt% for comet C/1995 O1 (Hale-Bopp), Wooden et al. (2004) cite 15 wt% for C/2001 Q4 (NEAT), while Harker et al. (2007) deduce a 28 wt% relative abundance for the pre-impact coma of 9P. Each of the later values (including those for SW3) were derived using the same discrete composition thermal model approach for SED decomposition, enabling a consistent comparison of relative abundances that are not model dependent (Wooden, 2008).
The average silicate-to-carbon ratio in the extended anti-sunward coma for fragment SW3-[B] ranges between , while for fragment SW3-[C] the value ranges between . Overall, these ratios are comparable to values derived for other EC comets (Kelley et al., 2006; Harker et al., 2007; Lisse et al., 2006; Reach et al., 2010). Fragment SW3-[B] went through an outburst event just prior to our observations and this event could be responsible for the higher silicate-to-carbon ratio in fragment SW3-[B] compared to that of fragment SW3-[C], as well as the slight differences in the peak of the grain size distribution between the two fragments. The date of the outburst from fragment SW3-[B] has been estimated to have been between 2006 April 16 to 26 (Vincent et al., 2010). Likely, material from the outburst is responsible for the region of enhanced flux in fragment SW3-[B] seen 3″ from the nucleus region in our images. The activity from fragment SW3-[C] is primarily from two active jets on the nucleus (Vincent et al., 2010) that could be preferentially ejecting small grains from the nucleus subsurface. On the other hand, fragment SW3-[B] was exhibiting fragmentation that released all subsurface grains in a single event. Therefore, in bulk, the grains released during a fragmentation event are slightly larger and more silicate rich than those entrained in the active jet outflows from the nucleus surface.
The radial difference in the silicate-to-carbon ratio in each fragment could arise from fragmentation of composite silicate rich grain aggregates entrained in the out flowing gas. Jones et al. (2008) observed fragments SW3-[B] and SW3-[C] in imaging polarimetry mode in the near-IR, finding that the surface brightnesses of both fragments are consistent with significant grain fragmentation. Their model requires a factor of 10 change in the mean grain size within 2–200 km from the nucleus (corresponding to 2″ in our Michelle observations). In addition, the scattered light polarization profile slightly increased over the same distances. The latter observations suggest that the grains were fragmenting, although the polarization could have also increased from the release of volatiles such as water ice and organics, which may change the light scattering properties of the grains (Jones et al., 2008). Despite the evidence for fragmentation in the scattered light, the grain size distribution derived from our thermal models do not appreciably vary, nor does . Our best-fit grain size distributions have . This shallow power-law slope suggests that the scattered light could be dominated by the largest grains which are too cool to be seen in the 10 µm region. Because smaller grains have higher radiative equilibrium temperatures, the mid-IR emission at 10 µm may be dominated by µm grains (Reach et al., 2007). Therefore the two datasets may not be so incongruent if the largest grains, perhaps 10s or 100s of µm in size, are fragmenting, but do not significantly affect the 8–13 SED because of their cool radiative equilibrium temperatures.
Alternatively, the increase in silicate-to-carbon ratio with distance from the nucleus could be due to grain sorting in the coma. In this scenario, the more transparent silicate species would dynamically separate from the dark amorphous carbon grains. Moderately porous () amorphous carbon grains have a 2–3 times larger response to radiation pressure than do the same-sized silicate grains (Kelley, 2006). Grain sorting by size and mineral composition was suggested from the time-of-flight analysis of the 9P post-impact coma contaminated by material from the ejecta plume (Harker et al., 2007).
4.2 Comparison to Other Comets
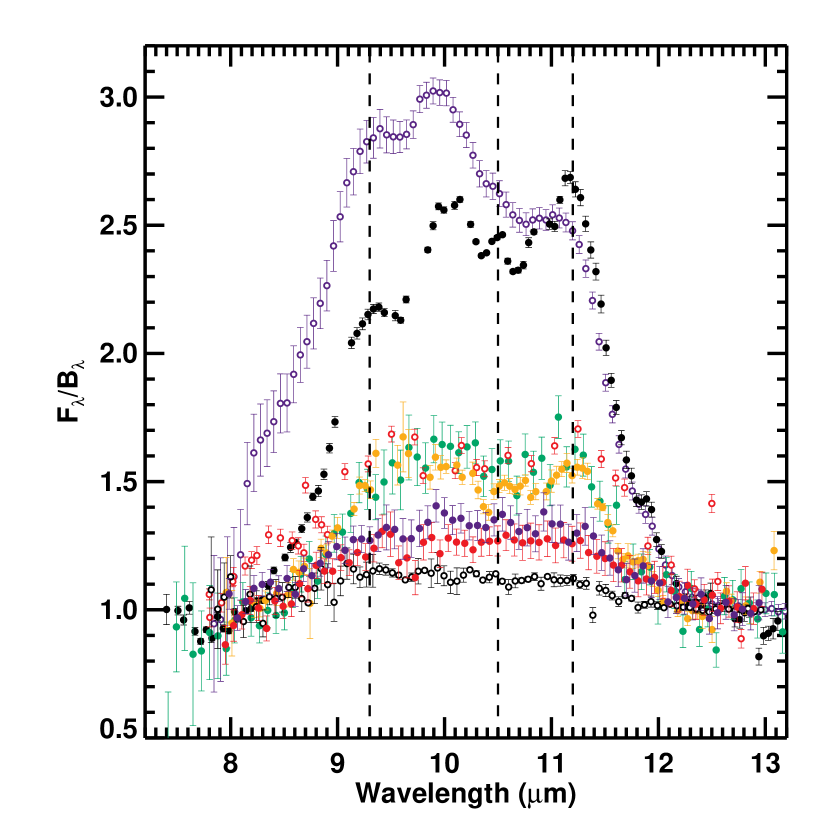
It is instructive to compare the spectral signature of coma dust in the environs of the SW3 fragments to other comets observed at mid-IR wavelengths to place the conclusion based on thermal model analysis and mineral decomposition analysis in context. Fig. 5 is a composite plot of the spectra of fragments SW3-[B], SW3-[C], comets C/1995 O1 (Hale-Bopp), 9P post-Deep Impact, and C/2001 Q4 (NEAT) observed with ground-based mid-IR spectrographs, C/2004 B1 (LINEAR) and 17P/ Holmes observed with Spitzer IRS spectrograph; and 1P/Halley observed by the Kupier Airborne Observatory. Comets C/1995 O1 (Hale-Bopp) and 17P/Holmes (17P) clearly have the strongest silicate features (defined as the excess over the blackbody continuum). However, we note that 17P was observed by Spitzer a little more than a couple of weeks after an extremely violent outburst event. This material was still within the Spitzer IRS spectral beam, and is therefore the reason for the relatively large silicate feature. The grains in the coma of C/1995 O1 (Hale-Bopp) were fractally very porous () with the HGSD peaking at µm (Harker et al., 2002). The coma dust in C/1995 O1 (Hale-Bopp) is also mineralogically diverse and includes amorphous and crystalline forms of both olivine and pyroxene (Harker et al., 2002). Similarly, the dust ejected from 9P post-Deep Impact was also mineralogically diverse and small ( µm) in size, although the grains were moderately fractally porous () (Harker, Woodward, & Wooden, 2005). Furthermore, comet C/2001 Q4 (NEAT) also displayed a mineralogically diverse grain population, however, the grains were solid () and and slightly larger than those in Hale-Bopp and 9P ( µm) (Wooden et al., 2004).
Comet 17P/Holmes also was observed to have distinct Mg-rich crystalline olivine features at 11.2 µm and 11.9 µm in apertures centered on the nucleus and in the diffuse coma, as well as toward the isolated dust cloud arising from the violent outburst event (Reach et al., 2010; Watanabe et al., 2010). In 17P, dust producing these 10 µm features may arise from fluffy aggregate complexes containing small Mg-rich crystalline silicates (e.g., Kimura et al., 2008), or small silicates ( µm) admixed larger amorphous dust. Sharp crystalline silicate features from small grains superposed on a thermal continuum arising from larger amorphous carbonaceous and silicate species in the 10 µm SED were evident in remote sensing observations of comet 1P/Halley by the Kupier Airborne Observatory (Bregman et al., 1987), while the in situ flyby measurement through the coma (McDonnell et al., 1987) indicated that the grain sized distribution was dominated by large µm sized particles. Comet C/2004 B1 (LINEAR) has a relatively weak and featureless silicate feature indicative of emission from a large (µm) grain population.
While there are similarities in dust grain characteristics between C/1995 O1 (Hale-Bopp), 9P, and 17P possibly a signature of a common formation zone in the solar nebula of the parent body aggregates for these comets, the composition of SW3 seems distinctly different. As SW3 fragmented into may pieces that subsequently sublimated leading to outbursts of gas entrained with dust particles from within the bulk interior of the original nucleus (natural excavation at depth akin to the subsurface penetration of Deep Impact projectile), surface weather affects cannot be invoked to explain dissimilarities in grain properties. ECs with frequent perihelion passages and low semi-major orbital axis are thought to have coma grain populations dominated by larger, compact dust particles arising from highly processed surface layers constituting the nucleus crust (Prialnik & Mekler, 1991) as opposed to the more pristine grains released in active Oort cloud comets. Larger grains are necessary to explain the aperture-dependent polarization properties and low total polarization ( few percent) of some ECs (Jones et al., 2008; Koloklova et al., 2007). However, SW3 has an unusually high polarization for an EC in both the optical and near-IR at a range of phase angles, which lead Jones et al. (2008) to suggest that observational feature is best explained by the release of unprocessed, porous aggregates with small effective radii from the interior of disintegrating comet nuclei.
Although fragment SW3-[B] underwent an outburst event revealing pristine grains from the nucleus interior, the grain properties and mineralogy of its dust does not resemble that of either 9P or of Hale-Bopp. This dissimilarity could be attributed to 1) the smaller, more porous dust grains traveling out of the coma of fragment SW3-[B] prior to our observations; or 2) the dust properties of SW3 fundamentally differ from that of 9P (and Hale-Bopp) implying a different formation process or evolutionary history. However, the former conjecture is ruled out by polarimetric observations and dust fragmentation studies of the SW3-[B] coma (Jones et al., 2008) obtained at epochs contemporaneous with our mid-IR spectrophotometry.
5 CONCLUSIONS
Mid-IR images and spectroscopic observations of the ecliptic (Jupiter family) comet 73P/Schwassman-Wachmann 3, fragments SW3-[B] and SW3-[C], were analyzed using thermal emission models. Based on our modeling, the comae dust, and by inference the bulk internal properties, of the individual fragments are similar with the observed mid-IR flux being dominated by emission from amorphous pyroxene and amorphous carbon, with evidence for emission from amorphous olivine towards the nucleus in both fragments. Emission from both fragments shows evidence for the existence of some crystalline olivine in the extended coma in the anti-sunward direction. The grain properties in both fragments are also similar: solid to moderately porous grains () with a large grain slope of and the peak of the HGSD ranging between 0.3 and µm. Finally, the two fragments exhibit a similar, but slightly different silicate-to-carbon ratio (1.341 for SW3-[B] and 0.671 for SW3-[C]); a ratio equivalent to those found for other ECs. The slight differences in grain size distribution and silicate-to-carbon ratio between the two fragments likely arises because SW3-[B] was actively fragmenting throughout its passage while the activity in SW3-[C] was primarily driven by jets. The breakup event populated the coma of fragment SW3-[B] with subsurface material. Conversely, for fragment SW3-[C], the dust population of its coma was driven by two active jets.
There are other differences between the two fragments, including the detection in fragment SW3-[B] of orthopyroxene in both the sunward and anti-sunward directions. In fragment SW3-[C], orthopyroxene is primarily detected in only the sunward direction. The crystalline silicate fraction is higher in SW3-[B] than in SW3-[C] based on constraints derived for the crystalline silicate fraction from thermal modelling of the SEDs. Although for both fragments is similar to the range of inferred for other ECs.
Comparison of coma dust properties of 73P to those of derived for ecliptic comet 9P/Tempel 1 just after the Deep Impact event, and to the archetypal, “pristine” nearly-isotropic (Oort cloud) comet C/1995 O1 (Hale-Bopp) suggests that materials released from fragment SW3-[B] which may expose grain material buried at depth below the surface of the original larger nucleus is devoid of very small ( µm) dust grains. The apparent absence, or diminished population of such small grain species may either be a result of dynamical sorting whereby this population has passed out of the coma before our observations, or more likely, the initial parent body makeup of 73P is different than that of 9P/Tempel 1 or even C/1995 O1 (Hale-Bopp).
References
- Alistair et al. (1997) Alistair C. G., Ettedgui-Atad, E., & Harris, J.W. 1997, Proc. SPIE 2871, 1197
- A’Hearn et al. (1985) A’Hearn, M. F., et al. 1995, Icarus, 118, 223
- Bazell & Dwek (1990) Bazell, D., & Dwek, E. 1990, ApJ, 360, 142
- Belton et al. (2006) Belton, M. J. S., et al. 2006, Icarus, 187, 332
- Bockelée-Morvan et al. (2002) Bockelée-Morvan, D., et al. 2002, A&A, 384, 1107
- Bradley et al. (1999) Bradley, J. P., Snow, T. P., Brownlee, D. E., & Hanner, M. S. 1999, in Solid Interstellar Matter: The ISO Revolution, Les Houches Workshop, February 2-6, 1998, Eds. L. d’Hendecourt, C. Joblin, and A. Jones (EDP Sciences, Springer-Verlag: Berlin), p.298
- Bradley (1994) Bradley, J. P. 1994, Science, 265, 925
- Bregman et al. (1987) Bregman, J. D., Witteborn, F. C., Allamandola, L. J., Campins, H., Wooden, D. H., Rank, D. M., Cohen, M., & Tielens, A. G. G. M. 1987, A&A, 187, 616
- Brownlee et al. (2006) Brownlee, D., et al. 2006, Science, 314, 1711
- Boss (2004) Boss, A. P. 2004, ApJ, 616, 1265
- Chihara et al. (2002) Chihara, H., Koike, C., Tsuchiyama A., Tachibana, S., & Sakamoto, D. 2002, A&A, 391, 267
- Ciesla (2007) Ciesla, F. J. 2007. Outward Transport of High-Temperature Materials Around the Midplane of the Solar Nebula. Science 318, 613.
- Cohen et al. (1996) Cohen, M., Witteborn, F. C., Carbon, D. F., Davies, J. K., Wooden, D. H., & Bregman, J. D. 1996, AJ, 112, 2274
- Crovisier (2007) Crovisier, J. 2007, in Planetary Sciences: Challenges and Discoveries, astro-ph/073758
- Crovisier et al. (2006) Crovisier, J., Bockelée-Morvan, D., Gerard, E., Rauer, H., Biver, N., Colom, P., & Jorda, L. 1996, A&A, 310, L17
- Crovisier et al. (2000) Crovisier, J., and 13 colleagues 2000. Thermal Emission Spectroscopy and Analysis of Dust, Disks, and Regoliths 196, 109-117.
- Crovisier (1999) Crovisier, J., 1999, in The Universe as Seen by ISO, ESA-SP 427, 161
- Croviser et al. (1997) Crovisier, J., Leech, K., Bockelée-Morvan, D., Brooke, T. Y., Hanner, M. S., Altieri, B., Keller, H. U., & Lellouch, E. 1997, Science, 275, 1904
- Cuzzi et al. (1993) Cuzzi, J. N., et al. 1993, Icarus, 106, 102
- Della Russo et al. (2007) Dello Russo, N., Vervack, R. J., Weaver, H. A., Biver, N., Bockelée-Morvan, D., Crovisier, J., & Lisse, C. M. 2007, Nature, 448, 172
- Dorschner et al. (1995) Dorschner, J., Begemann, B., Henning, T., Jaeger, C., & Mutschke, H. 1995. A&A, 300, 503
- Ebel et al. (2006) Ebel, D. S., et al. 2006, DPS 38, #13.19
- Edoh (1983) Edoh, O. 1983, Ph.D. Thesis, University of Arizona.
- Ehrenfreund et al. (2004) Ehrenfreund, P., et al. 2004, in Comets II, eds. M. Festou, et al., (Tucson, AZ: U. Arizona Press), p.115
- Fabian et al. (2001) Fabian, D., Henning, T., Jäeger, C., Mutschke, H., Dorschner, J., & Wehrhan, O. 2001, A&A, 378, 228
- Fernandez & Ip (1981) Fernandez, J. A. & Ip, W.-H. 1981, Icarus, 47, 470
- Gomes (2003) Gomes, R. S. 2003, Icarus, 161, 404
- Grossman (1972) Grossman, L. 1972. Condensation in the primitive solar nebula. Geochimica et Cosmochimica Acta 36, 597-619.
- Gehrz et al. (2007) Gehrz, R. D., Roellig, T. L., Werner, M. W., Fazio, G. G., Houck, J. R., Low, F. J., Rieke, G. H., Sofier, B. T., Levine, D. A., & Romana, E. A. 2007, Rev. Scientific Instruments 78, 1302
- Hallenbeck et al. (1998) Hallenbeck, S. L., et al. 1998, Icarus, 131, 193
- Hanner & Zolensky (2010) Hanner, M. S. & Zolensky, M. E. 2010, in Astromineralogy, 2nd Edition, ed. Th. Henning, Springer Verlag, in press.
- Hanner & Bradely (2004) Hanner, M. S. & Bradley, J. P. 2004, in Comets II, eds. M. Festou, et al. (Tucson, AZ: U. Arizona Press), p.555
- Hanner, Lynch, & Russell (1994) Hanner, M. S., Lynch, D. K., & Russell, R. W. 1994, ApJ, 425, 274
- Harker et al. (2007) Harker, D. E., Woodward, C. E., Wooden, D. H., Fisher, R. S., & Trujillo, C. 2007, Icarus, 191, 432
- Harker et al. (2005) Harker, D. E., Woodward, C. E., Wooden, D. H., 2005 Science 310, 278-280.
- Harker et al. (2004) Harker, D. E., Wooden, D. H., Woodward, C. E., & Lisse, C. M. 2004, ApJ, 615, 1081 errata
- Harker et al. (2002) Harker, D. E., Wooden, D. H., Woodward, C. E., & Lisse, C. M. 2002, ApJ, 580, 579
- Harker & Desch (2002) Harker, D. E. & Desch, S. 2002, ApJ, 565, L109
- Harker, Woodward, & Wooden (2005) Harker, D. E, Woodward, C. E., & Wooden, D. E. 2005, Science, 310, 278
- Harris (1998) Harris, A. W. 1998, Icarus, 131, 291
- Howell et al. (2007) Howell, E. S., Nolan, M. C., Harmon, J. K., Lovell, A. J., Benner, L. A., Ostro, S. J., Campbell, D. B., & Margot, J. 2007, Bulletin of the American Astronomical Society, 38, 486
- Jäeger et al. (1998) Jäeger, C., Molster, F. J., Dorschner, J., Henning, T., Mutschke, H., & Waters, L. B. F. M. 1998, A&A, 339, 904
- Jones et al. (2008) Jones, T. J., Stark, D., Woodward, C. E., Kelley, M. S., Kolokolova, L., Clemens, D., & Pinnick, A. 2008, AJ, 135, 1318
- Joyce (1992) Joyce, R. R. 1992. Observing With Infrared Arrays. ASP Conf. Ser. 23: Astronomical CCD Observing and Reduction Techniques 23, p.258
- Kelley & Wooden (2009) Kelley, M. S., & Wooden, D. H. 2009, Planetary Spac. Sci., 57, 1133
- Kelley et al. (2006) Kelley, M. S., et al. 2006, ApJ, 651, 1256
- Kelley (2006) Kelley, M. S. 2006, Ph.D. Thesis, University of Minnesota
- Kemper et al. (2005) Kemper, F., Vriend, W. J., & Tielens, A. G. G. M. 2005, ApJ, 633, 534
- Kemper et al. (2004) Kemper, F., Vriend, W. J., Tielens, A. G. G. M. 2004. The Absence of Crystalline Silicates in the Diffuse Interstellar Medium. Astrophysical Journal 609, 826-837.
- Kiselev et al. (2002) Kiselev, N., Jockers, K., & Rosenbush, V. 2002, Earth, Moon, Planets, 90, 167
- Koike et al. (2003) Koike C., Chihara, H., Tsuchiyzma, A., Suto, H., Sogawa, H., & Okuda, H. 2003, A&A, 399, 1101
- Kimura et al. (2008) Kimura, H., Chigai, T., & Yamamoto, T. 2008, A&A, 482, 305
- Koloklova et al. (2007) Kolokolova, L., Kimura, H., Kiselev, N., & Rosenbush, V. 2007, A&A, 463, 1189
- Levison & Mordidelli (2003) Levison, H. F. & Morbidelli, A. 2003, Nature, 426, 419
- Li & Draine (2001) Li, A., & Draine, B. T. 2001, ApJ, 550, L213
- Lisse et al. (2006) Lisse, C. M., et al. 2006, Science 313, 635-640.
- Lisse et al. (1998) Lisse, C. M., A’Hearn, M. F., Hauser, M. G., Kelsall, T., Lien, D. J., Moseley, S. H., Reach, W. T., & Silverberg, R. F. 1998, ApJ, 496, 971
- Lord (1993) Lord, S. D. 1993, NASA Techn. Rep. TM-103957 (Moffet Field: NASA/Ames Research Center)
- McDonnell et al. (1987) McDonnell, J. A. M., et al. 1987, A&A, 187, 719
- Meech & Svoren (2004) Meech, K. & Svoren 2004, in Comets II, eds. M. Festou, et al. (Tucson, AZ: U. Arizona Press), p.317
- Min et al. (2005) Min, M., Hovenier, J. W., de Koter, A., Waters, L. B. F. M., & Dominik, C. 2005, Icarus 179, 158
- Morbidelli et al. (2004) Morbidelli, A., Emel’yanenko, V. V., & Levison, H. F. 2004, MNRAS, 355, 935
- Morbidelli & Levinson (2003) Morbidelli, A. & Levison, H. F. 2003, Nature, 422, 30
- Moreno et al. (2003) Moreno, F., Muñoz, O., Vilaplana, R., & Molina, A. 2003, ApJ, 595, 522
- Oört (1951) Oört, J. 1950, Bull. Ast. Inst. Neth., 11, 91
- Orosei et al. (1995) Orosei, R., Capaccioni, F., Capria, M. T., Coradini, A., Espinasse, S., Federico, C., Salomone, M., & Schwehm, G. H. 1995, A&A, 301, 613
- Pan et al. (2005) Pan, M. & Sari, R. 2005, Icarus, 173, 342
- Prialnik & Mekler (1991) Prialnik, D., & Mekler, A. 1991, ApJ, 366, 318
- Reach et al. (2010) Reach, W. T., et al. 2010, arXiv:1001.4161v2
- Reach et al. (2009) Reach, W. T., Vaubaillon, J., Kelley, M. S., Lisse, C. M., & Sykes, M. V. 2009, Icarus, 203, 571
- Reach et al. (2007) Reach, W. T., Kelley, M. S., & Sykes, M. V. 2007, Icarus, 191, 298
- Scotii et al. (1996) Scotti, J. V., Galad, A., Boehnhardt, H., Kaufl, H. U., Chen, J., Jewitt, D., Reinsch, K., Storm, J., & Sekanina, Z. 1996, IAU Circ., 6301, 1
- Sekanina (2005) Sekanina, Z. 2005, International Comet Quarterly, 27, 225
- Sitko et al. (2004) Sitko, M. L., Lynch, D. K., Russell, R. W., & Hanner, M. S. 2004, ApJ, 612, 576
- Stansberry et al. (2004) Stansberry, J. A., and 17 colleagues, 2004. Spitzer Observations of the Dust Coma and Nucleus of 29P/Schwassmann-Wachmann 1. Astrophysical Journal Supplement Series 154, 463-468.
- Stern (2003) Stern, S. A. 2003, Nature, 424, 639
- Sugita et al. (2005) Sugita, S. et al. 2005, Science 310, 274
- Vincent et al. (2010) Vincent, J.-B., Böhnhardt, H., Bertini, I., Lara, L.-M., Küppers, M., & Rodrigo, R. 2010, Earth Moon and Planets, 106, 27
- Watanabe et al. (2010) Watanabe, J., et al. 2009, Pub. Astron. Soc. Japan, 61, 679
- Watanabe et al. (2005) Watanabe, J., Kawakita, H., Honda, M. Ootsubo, T., Fuse, T., Yamashita, T., Furusho, R., Kasuga, T., 2005. IAU Symposium Abstracts 229, 121.
- Weaver et al. (2008) Weaver, H. A., et al. 2008, Asteriods, Meteor, Comets, LPI Contr. 104.8248W
- Weaver et al. (1995) Weaver, H. A., et al. 1995, Science, 267, 1282
- Werner et al. (2006) Werner, M. W. Fazio, G., Rieke, G., Roellig, T. L., & Watson, D. M. 2006, Ann. Rev. of Astronomy and Astrophysics 44, 269
- Whitman et al. (2006) Whitman, K., Morbidelli, A., & Jedicke, R. 2006, Icarus, 183, 101
- Wooden (2008) Wooden, D. H. 2008, Space Sci. Rev., 138, 75
- Wooden (2005) Wooden, D. H. 2005, in Highlights of Astronomy, Vol. 13, eds. O. Engvold, (San Francisco, CA: Astron. Soc. Pacific), p.495
- Wooden et al. (2007) Wooden, D. H., et al. 2007, in PPV, eds. B. Reipurth, et al., (Univ. Arizona Press: Tucson), p.815
- Wooden et al. (2004) Wooden, D. H., Woodward, C. E., & Harker, D. E. 2004, ApJ, 612, L77
- Wooden (2002) Wooden, D. H., 2002. Comet Grains: Their IR Emission and Their Relation to ISM Grains. Earth Moon and Planets 89, 247-287.
- Wooden et al. (2000) Wooden, D. H., Butner, H. M., Harker, D. E., & Woodward, C. E. 2000, Icarus 143, 126
- Wooden et al. (1999) Wooden, D. H., Harker, D. E., Woodward, C. E., Butner, H. M., Koike, C., Witteborn, F. C., & McMurtry, C. W. 1999, ApJ, 517, 1034
- Wooden (1979) Wooden, D. H. 1979, Ph.D Thesis, Univ. California, Santa Cruz.
| UT | Start Time aa Start time of integration. | Airmass | Int. Timebb Integration time on-source. | Flux | Airmass of | Data | Flux ff Flux in a 7.44″ diameter aperture centered on the peak isophote of the surface brightness distribution. | |||
|---|---|---|---|---|---|---|---|---|---|---|
| Date | (hr:min) | Frag. | of Comet | (sec) | Standard | Standard | (AU) | (AU) | Obtained cc Low N Low-Res 10 µm spectrum; Low Q Low-Res 20 µm spectrum. | (Jy) |
| 29 Apr 2006 | 12:21 | [B] | 1.039 | 54.4 | HD127665 | 1.065 | 1.110 | 0.154 | 18.1 µm image | |
| 29 Apr 2006 | 12:23 | [B] | 1.043 | 51.8 | HD127665 | 1.072 | 1.110 | 0.154 | 11.6 µm image | |
| 29 Apr 2006 | 12:41 | [B] | 1.104 | 806.4 | HD127665 | 1.096 | 1.110 | 0.154 | Low Ndd Slit rotated to position angle | |
| 29 Apr 2006 | 13:55 | [B] | 1.199 | 756.0 | HD156283 | 1.151 | 1.110 | 0.154 | Low Qdd Slit rotated to position angle | |
| 30 Apr 2006 | 11:36 | [C] | 1.043 | 54.4 | HD156283 | 1.151 | 1.085 | 0.129 | 18.1 µm image | |
| 30 Apr 2006 | 11:42 | [C] | 1.039 | 51.8 | HD156283 | 1.048 | 1.085 | 0.129 | 11.6 µm image | |
| 30 Apr 2006 | 12:57 | [C] | 1.034 | 302.4 | HD156283 | 1.056 | 1.085 | 0.129 | Low Nee Slit rotated to position angle |
| ) | |||||||||||
|---|---|---|---|---|---|---|---|---|---|---|---|
| Extractionaa Lable of spectral extraction aperture (see Fig. 2) | Offset bb Distance that the center of the extraction box is offset from the peak brightness. A positive value indicates an offset in the N-E direction, and a negative value indicates an offset in the S-W direction (see Fig. 2). Both offsets are along the slit orientation axis of PA (see text). | N | M | cc Derived parameter | D | Amorphous | Amorphous | Amorphous | Crystalline | Ortho- | |
| Aperture | (arcsec) | Pyroxene | Olivine | Carbon | Olivine | Pyroxene | |||||
| A | 3.4 | 27.20 | 0.9 | 3.000 | 2.71 | ||||||
| B | 3.4 | 13.60 | 0.5 | 2.727 | 0.75 | ||||||
| C | 3.4 | 13.60 | 0.5 | 3.000 | 1.14 | ||||||
| D | 3.4 | 10.20 | 0.4 | 2.857 | 1.04 | ||||||
| E | 3.4 | 13.60 | 0.5 | 2.857 | 1.55 | ||||||
| F | 3.4 | 13.60 | 0.5 | 3.000 | 1.00 | ||||||
| G | 3.4 | 13.60 | 0.5 | 3.000 | 1.38 | ||||||
| H | 3.4 | 13.60 | 0.5 | 3.000 | 1.46 | ||||||
| ) | |||||||||||
|---|---|---|---|---|---|---|---|---|---|---|---|
| Extractionaa Same as for Table 2 | Offset bb Same as for Table 2 | N | M | cc Derived parameter | D | Amorphous | Amorphous | Amorphous | Crystalline | Ortho- | |
| Aperture | (arcsec) | Pyroxene | Olivine | Carbon | Olivine | Pyroxene | |||||
| I | 3.4 | 13.60 | 0.5 | 3.000 | 2.79 | ||||||
| J | 3.4 | 13.60 | 0.5 | 3.000 | 2.58 | ||||||
| K | 3.4 | 10.20 | 0.4 | 3.000 | 2.44 | ||||||
| L | 3.4 | 40.80 | 1.3 | 2.727 | 4.00 | ||||||
| M | 3.4 | 6.80 | 0.3 | 2.727 | 3.28 | ||||||
| N | 3.4 | 6.80 | 0.3 | 2.727 | 0.46 | ||||||
| O | 3.4 | 10.20 | 0.4 | 2.727 | 0.71 | ||||||
| P | 3.4 | 6.80 | 0.3 | 2.857 | 0.65 | ||||||
| Q | 3.4 | 6.80 | 0.3 | 2.857 | 0.91 | ||||||
| R | 3.4 | 6.80 | 0.3 | 2.857 | 1.24 | ||||||
| Mass Relative to Total Mass | ||||||||
|---|---|---|---|---|---|---|---|---|
| Extraction | Total Mass | Amorphous | Amorphous | Amorphous | Crystalline | Ortho- | Silicate/ | |
| Aperture | ( kg) | Pyroxene | Olivine | Carbon | Olivine | pyroxene | Carbon | aafootnotemark: |
| A | ||||||||
| B | ||||||||
| C | ||||||||
| D | ||||||||
| E | ||||||||
| F | ||||||||
| G | ||||||||
| H | ||||||||
| Mass Relative to Total Mass | ||||||||
|---|---|---|---|---|---|---|---|---|
| Extraction | Total Mass | Amorphous | Amorphous | Amorphous | Crystalline | Ortho- | Silicate/ | |
| Aperture | ( kg) | Pyroxene | Olivine | Carbon | Olivine | pyroxene | Carbon | aafootnotemark: |
| I | ||||||||
| J | ||||||||
| K | ||||||||
| L | ||||||||
| M | ||||||||
| N | ||||||||
| O | ||||||||
| P | ||||||||
| Q | ||||||||
| R | ||||||||