Host galaxyactive galactic nucleus alignments in the SDSS-DR7
Abstract
We determine the intrinsic shapes and orientations of type I and II active galactic nucleus (AGN) galaxies in the spectroscopic sample of the Sloan Digital Sky Survey Data Release 7, by studying the distribution of projected axis ratios of AGN hosts. Our aim is to study possible alignments between the AGN and host galaxy systems (e.g. the accretion disc and the galaxy angular momentum) and the effect of dust obscuration geometry on the AGN type. We define control samples of non-AGN galaxies that mimic the morphology, colour, luminosity and concentration distributions of the AGN population, taking into account the effects of dust extinction and reddening. Assuming that AGN galaxies have the same underlying three-dimensional shape distribution as their corresponding control samples, we find that the spiral and elliptical type I AGN populations are strongly skewed toward face-on galaxies, while ellipticals and spirals type II AGN are skewed toward edge-on orientations. These findings rule out random orientations for AGN hosts at high confidence for type I spirals () and type II ellipticals (), while the signal for type I ellipticals and type II spirals is weaker ( and , respectively). We obtain a much stronger tendency for the type II spirals to be edge-on when just high equivalent width (EW) AGN are considered, suggesting that % of low EW edge-on type II AGN may be missing from the optical sample. Galactic dust absorption of the broad-line region alone cannot explain the observed inclination angle and projected axis ratio distributions of type I and II Seyfert types, implying that obscuration by a small-scale circumnuclear torus is necessary. These results favour a scenario in which the angular momentum of the material which feeds the black hole retains a memory of its original gas source at least to some small, non-negligible degree.
keywords:
galaxies: evolution - galaxies: active1 Introduction
Galaxies with Active Galactic Nuclei (AGN) have become a major focus in extragalactic studies due to their role in galaxy formation scenarios favoured today. Feedback from the AGN, and its effects on gas infall and star formation are invoked to explain observed trends on galaxy star formation rates, luminosities and colours (see for instance, Bower et al. 2006; Croton et al. 2006; Cattaneo et al. 2006; Sijacki et al. 2007; Hopkins et al. 2007; Marulli et al. 2008; Lagos et al. 2008; Somerville et al. 2008). However, many aspects of the relationship between AGN and their hosts remain unclear, such as the relation between the angular momentum of the AGN system (i.e. accretion disc and black hole spin) and the galaxy kinematics. A level of coherence between the two could influence the development of the black hole (BH) spin (Lagos et al., 2009) which regulates the mass-to-energy conversion in radiatively efficient accretion phases (e.g. Rawlings & Saunders 1991; Marconi et al. 2004), and which has been postulated as key to the process of jet production (e.g. Sikora et al. 2007); therefore, this could directly affect the energetic capacity of a BH to produce effective feedback.
A way to study galaxy-AGN orientations, for example in weak objects such as radio-quiet AGN (i.e. Seyfert galaxies, Osterbrock 1984), is via the measurement of the inclination angles relative to the line of sight of AGN host galaxies, since narrow (Seyfert II) and broad line (Seyfert I) AGN are thought to be the same physical phenomenon seen under different orientations (see Antonucci 1993 for a review). This is called the “Unified AGN model” (e.g. Barthel 1989; Madau et al. 1994; Urry & Padovani 1995; Gunn & Shanks 1999) in which the emission lines come from the AGN system composed of a BH surrounded by an accretion disc and an obscuring torus. The accretion disc is responsible for the ionizing spectrum of the AGN, and the broad line region (BLR) gas is distributed on similar scales; the direct observation of these regions results in a Seyfert I galaxy. The opaque torus absorbs the optical emission from the accretion disc and the BLR along certain lines of sight, giving rise to a Seyfert II galaxy.
The main evidence in favour of the unified model comes from observations of broad emission lines in polarised light from Seyfert II galaxies (e.g. Antonucci & Miller 1985; Miller et al. 1990; Zakamska et al. 2005; Zhang et al. 2008; Borguet et al. 2008), and is further supported by e.g. measurements of similar BH accretion rates in the two AGN types (Netzer 2009; Hatziminaoglou et al. 2009). However, the unified model does not imply a relation between the inclination of the host galaxy and that of the obscuring torus (which may be linked with the BH spin; Volonteri et al. 2007, King et al. 2008; Lagos et al. 2009), leaving open the question of the existence of such a relation. Indications of a relation between the kinematic properties of the outer and inner galactic components have been recently found in the SAURON survey (Bacon et al. 2001; de Zeeuw et al. 2002) by Dumas et al. (2007) in AGN Seyfert galaxies. These show differences in the position angle of outer and inner components typically of , thus these two components are not randomly oriented with respect to one other. In addition, type II AGN spirals appear to be more elongated in optical bands than are non-active spiral galaxies (Shen et al., 2010), possibly indicating a tendency towards edge-on orientations in this type of AGN galaxies, which within the unified AGN model would point to a connection with the torus orientation. On the other hand, Krajnović et al. (2008) found kinematically decoupled cores (i.e. central regions) in % of a small sample of elliptical galaxies observed as part of the SAURON project. Thus, the evidence for alignment between the galaxy as a whole and the AGN is not conclusive.
Most of the studies in the literature on the orientations of AGN have been done using powerful radio objects, by studying the level of alignment of relativistic jets and their hosts. Since the jet direction is set by the angular momentum of the accretion disc (e.g. Lynden-Bell 2006) and/or the BH spin (e.g. Blandford & Znajek 1977; Fragile et al. 2007; Barausse & Rezzolla 2009), it can be directly compared with the orientation of the host galaxy. Several papers (e.g. Kinney et al. 2000; Schmitt et al. 2002; Greenhill et al. 2009) have found that radio and optical position angles are uncorrelated, although their samples contain objects, meaning that the statistical precision of these studies is limited. Indeed, Battye & Browne (2009) found a significant level of alignment between the minor axes of a sample of elliptical galaxies and the position angles of relativistic jets emitted from their central AGN. However, such an apparent alignment could be difficult to distinguish from the “alignment effect” (McCarthy et al. 1987; Chambers et al. 1987; McNamara et al. 1996 and 1996b) in bright radio sources, in which the jet triggers star formation (e.g. De Young 1995; Blundell et al. 1999) or where the blue component is simply scattered AGN light (McCarthy, 1993).
The BH spin development is intimately linked with the growth of the BH itself. This means that its value and its level of alignment with the galactic components give important clues about the way in which the accretion proceeds (e.g. Moderski et al. 1998; Hughes & Blandford 2003; Shapiro 2005). The spin of a BH depends on whether it gained most of its mass via mergers with other BHs or via accretion (e.g. Volonteri et al. 2005; Berti & Volonteri 2008; Lagos et al. 2009). Volonteri et al. (2005) found that gas accretion affects the spin evolution more than do mergers between BHs, since binary coalescences alone do not lead to a systematic spin-up or -down in time, while a prolonged accretion period efficiently spins BHs up to the maximum value. On the other hand, King & Pringle (2006) suggested that the accretion proceeds via a series of short episodes as small amounts of gas with randomly oriented angular momenta fall in. In contrast with the Volonteri et al. (2005) model, in this scenario BHs can achieve only low spin values, â through gas accretion (King et al., 2008) and relatively high spin values (i.e. â; Berti & Volonteri 2008) can only be achieved through the effects of galaxy and BH mergers (Fanidakis et al., 2009). X-ray observations reveal relativistically broadened Fe-K fluorescence lines in several AGN, indicative of â (Iwasawa et al. 1996; Fabian et al. 2002; Reynolds & Nowak 2003; Brenneman & Reynolds 2006). Another approach to constrain BH spins is via quasar demographics. The observed light from quasars is directly proportional to the rate at which supermassive black holes are accreting material, thus a comparison of the quasar luminosity function with the present-day BH mass function constrains the radiative efficiency (Soltan, 1982), which in turn depends on BH spin. Analyses based on this approach have come to different conclusions: Elvis et al. (2002), Cao & Li (2008), Yu & Lu (2008) reported large energy conversion efficiencies (%), indicative of large spins, while Yu & Tremaine 2002, Marconi et al. 2004, Martínez-Sansigre & Taylor (2009), reported efficiencies as low as %, indicative of slowly rotating BHs. This may depend on the redshift, given that the typical accretion rates of relatively massive BHs are likely to be much larger at earlier epochs (e.g. Wang et al. 2009).
Lagos, Padilla & Cora (2009, LPC09 hereafter) used the -disk model (Shakura & Sunyaev, 1973) to follow the BH spin development in the semi-analytic model of galaxy formation of Lagos et al. (2008) within a cosmological framework and showed that, in the hypothetical case in which accretion discs preserve the angular momentum direction of the bulk of the cold gas involved in star formation, massive galaxies should host BHs with spin values close to unity, regardless of additional physical effects such as accretion disc warps (King et al., 2005) or fragmentation (King & Pringle, 2006). We refer to this scenario, in which the BH is spun up smoothly via steady accretion of gas that conserves the angular momentum direction of the original gas source, as the coherent model. Using the same semi-analytic model, the authors tested the effect of assigning random orientations to the incoming material and show that high BH spin values can only be obtained by aligning the inner regions of the accretion disk with the BH spin (i.e. disc warps; King & Pringle 2006); this case will be referred to as the chaotic model.
In this work we focus on the chaotic/coherent accretion dichotomy, by studying intrinsic shapes and inclinations of host galaxies of AGN with obscured and unobscured BLR in the Sloan Digital Sky Survey (SDSS, York et al. 2000) Data Release 7 (DR7, Abazajian et al. 2009), to determine the degree of alignment between galaxy and accretion discs (or tori). Throughout the paper the term AGN will refer only to Seyfert galaxies. We will assume that the torus and the accretion disc are aligned, with the exception of a possible warp in the accretion disc in the vicinity of the central super-massive BH (King et al. 2005) as seen in AGN masers (e.g. Zhang et al. 2006). We compare the results obtained with predictions of the LPC09 model in the coherent and chaotic scenarios to constrain the physics of gas inflow.
This paper is organised as follows. In Section , we describe the sample and the selection of control samples matched to the properties of AGN galaxies. We characterise the three-dimensional intrinsic shapes of these samples following Padilla & Strauss (2008). In Section we study the orientations of AGN host galaxies, systematic effects in the AGN selection, and the origin of biases toward face- or edge-on orientations by analysing the effect of galactic disc and nuclear torus obscuration. In Section we compare the observed inclination angle distributions with theoretical predictions for the chaotic and coherent models of LPC09. We discuss and summarise our main results and their implications for AGN models in Section and Section , respectively. Throughout this paper we assume a cosmological model characterised by matter and dark-energy density parameters , and a Hubble constant . These parameters are consistent with the results from the Wilkinson Microwave Anisotropy probe (WMAP, Hinshaw et al. 2009, Dunkley et al. 2009, Sánchez et al. 2006).
2 The intrinsic shapes of AGN host galaxies in the SDSS
In this Section we characterise the three-dimensional intrinsic shapes of the hosts of AGN. Our AGN sample was identified using the method of Hao et al. (2005a) from the SDSS DR7 spectra. We assume that the AGN have the same intrinsic three-dimensional shapes as well-defined control samples of non-AGN galaxies. Galaxies in the control samples should be free of inclination biases, and therefore their observed projected shapes will only reflect their intrinsic three-dimensional shapes, plus the effect of extinction. Comparison of the axis ratio distribution of AGN galaxies with those of the control sample allows us to make inferences on the orientation distribution of the AGN.
2.1 The SDSS DR7 AGN sample
The AGN data used in this work consists of type I and type II AGN identified by their emission-line properties from about galaxy spectra (the MAIN survey; Strauss et al. 2002) in the SDSS DR7 using the methods of Hao et al. (2005a). In order to exclude objects with low emission lines, Hao et al. reject from the sample galaxies whose rest-frame equivalent width (EW) is . We exclude type III AGN (Kauffmann et al. 2003), which lie between the star-forming and AGN loci (Kewley et al., 2001) in the Veilleux & Osterbrock (1987) line ratio diagram, since much of their emission could come from star-formation activity. Hao et al. fit for and subtract the stellar continuum before measuring the strength and widths of emission lines. H and H are fit to two Gaussians; those objects with a significant broad component (km/s) are termed type I, while those objects lying beyond the star-forming line ratio limits of Kewley et al. (2001) are termed type II.
We separate the AGNs further by morphology, using the fraction of -band light which fits a de Vaucouleurs profile, (from model fits available from the SDSS pipeline, Abazajian et al. 2004). Early-type galaxies are selected by requiring , and we classify all other galaxies as spirals. We therefore define four AGN samples, selected by AGN type and morphological host galaxy type.
We apply a dust extinction and reddening correction to luminosities and colours, respectively, of spirals using the model by Padilla & Strauss (2008, PS08 hereafter), where it is assumed that the amount of reddening is proportional to the path length of the light through the galaxy. The extinction is a function of the inclination angle for any given galaxy, the mean galaxy height to diameter ratio, (where galaxies are modelled as triaxial ellipsoids of major, middle and minor axis , , and , respectively), and the edge-on extinction, (in magnitudes). Here, a perfect edge-on galaxy will have , while a face-on galaxy has . For each spiral galaxy we obtain and from Table of PS08 (interpolating in absolute magnitude). In turn, is determined from the observed projected axis ratio by interpolating in their Table . The edge-on reddening in magnitudes, , is related to via , where is the reddening parameter. PS08 showed that the model is not strongly dependent on , allowing us to use this simple approximation to correct both colours and luminosities. The extinction affects the maximum volume, , out to which a galaxy can be detected in the SDSS flux-limited catalogue. We select galaxies with in order to avoid very small values of , since fainter galaxies tend to dominate the noise in the estimate of the distribution functions we consider below.
2.2 Selection of Control Samples
We select control samples matching the colours (), luminosities () corrected for reddening and extinction, respectively, and concentrations111Concentration is defined as the ratio between the radii enclosing % and % of the Petrosian (1976) light, . of the AGN host samples. All magnitudes shown are -corrected to . We then construct a grid in the parameter space defined by these three galaxy properties, and populate each cell with the AGN hosts weighted by . The control samples are constructed by filling each grid cell with randomly chosen main sample galaxies from the SDSS so that ; is chosen so as to maximise the size of the control samples, with a maximum departure from the target distribution in any grid cell of less than %. is for our four AGN samples. Notice that this selection takes into account any intrinsic correlation between these quantities in the AGN sample. This ensures that control samples mimic the AGN hosts as closely as possible. Table 1 shows the number of galaxies in each AGN sample and their corresponding control sample.
| Sample | AGN sample | control sample |
|---|---|---|
| Type I ellipticals | 2,712 | 50,537 |
| Type II ellipticals | 7,653 | 45,253 |
| Type I spirals | 3,360 | 57,010 |
| Type II spirals | 13,578 | 66,626 |


Fig. 1 shows the (left panel), (middle-left panel) and (middle-right panel) -weighted distributions of each of the AGN subsamples (solid lines) and their corresponding control samples (dashed lines). The right panels show the redshift distributions of both populations. The control sample distributions all follow the AGN distributions very closely. Hao et al. (2005b) noted that sufficiently low luminosity AGN would not be selected spectroscopically due to (i) undetectable emission lines, (ii) higher noise in the measurements of emission line ratios for weaker emission line strengths, or (iii) total galaxy fluxes (including the nuclear emission) below the spectroscopic sample limit. This could result in a difference in the redshift distribution of AGN and non-AGN galaxies, which would cause a difference in the values of . The observed agreement between the redshift distributions of AGN and non-AGN galaxies (right panel of Fig. 1) suggests that this is not a problem. We also find a broad agreement between the distributions of AGN and control samples for the spiral population, and only a small offset at the flux limit () in the elliptical population. We conclude that our does not need extra corrections for these effects and is adequate for our analysis.
In Fig. 1, the host galaxy properties of the two AGN types (for the same morphology) show very similar photometric properties, a result consistent with the AGN unified model, in which the difference between the types is due solely to orientation. Even though the non-obscured nuclear emission from type I AGN could affect the photometry of the galaxies, the similar distributions of luminosities and concentrations of type I and type II AGN indicate that such an effect is minor. In fact, type I AGN galaxies are only redder than type II AGN, smaller than the binsize used. The colour distributions of spiral and elliptical AGN hosts differ only slightly; elliptical hosts are on average only redder than spiral hosts. This small difference is common in AGN hosts, as they often lie in the “green valley” of the colour-magnitude relation diagrams (see for instance Padilla et al. 2009).
We have thus constructed normal galaxy samples that reproduce the colour-luminosity-concentration properties of AGN populations (selected by AGN type and host morphology) which, unlike AGN of a given type, are expected to be randomly oriented with respect to the plane of the sky. We now characterise the intrinsic typical shapes and orientations of the selected galaxy control samples.
2.3 The intrinsic shapes of AGN galaxies in the SDSS
We measure the intrinsic galaxy shapes in each AGN sample by studying the projected distribution in the -band for the control samples.
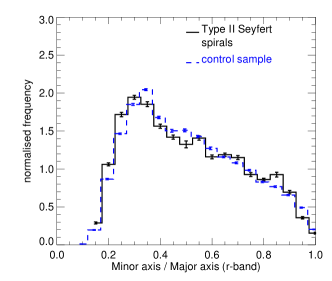
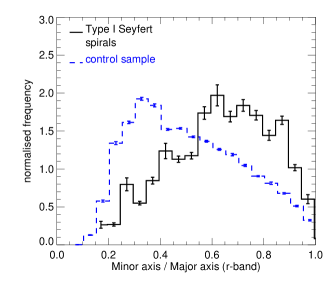
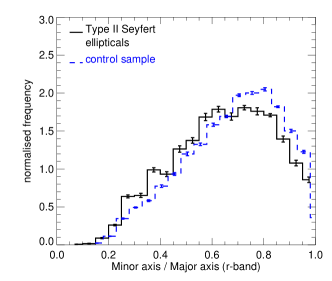
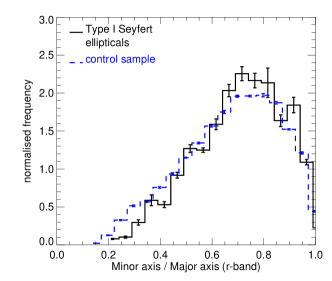
Fig. 2 shows the distribution of minor to major projected axis ratios ( from exponential or de Vaucouleurs fits corrected for the effects of the PSF) for spiral (top) and elliptical (bottom) type I (left panels) and type II (right panels) AGN galaxies (solid lines) and the corresponding control samples (dashed lines). All the distributions shown are -weighted. Errors are calculated using the jackknife technique. Both type II AGN ellipticals and spirals seem to be slightly more edge-on than their control samples, which are assumed to cover the full range of inclination angles. The shift in the distribution peak towards lower is about and for the spiral and elliptical type II populations, respectively. There are considerably larger differences between the distributions of the spiral type I AGN population and its control sample; the AGN population is skewed towards high values, indicating inclination angles closer to face-on orientations. The control sample shows a peak in the distribution at , while the AGN population peaks at . This suggests that the source of obscuration in type II objects has a large scale height, and is preferentially aligned with the plane of the galaxy disc.
At first glance, the larger inclination effect for type I AGN than that observed for type II AGN could be taken as a failure of the unified AGN model, since it naively suggests that the relation between the host galaxy and its AGN depends on the AGN type. However, a proper comparison between the two types of AGN requires a more detailed analysis of relative inclination angles which we will perform in Section 3; another possibility that we will also explore is that the samples of different types of AGN are subject to different selection effects.
2.3.1 Characterisation of the intrinsic shapes
We use the distributions to characterise the three-dimensional shapes of galaxies in each control sample. A variety of papers (Ryden 2004, Vincent & Ryden 2005, Padilla & Strauss 2008) have shown that both elliptical and spiral galaxies have shapes consistent with oblate spheroids. In this work we model galaxies as triaxial ellipsoids of major axis A, middle axis B and minor axis C parametrised by two axis ratios, and . We follow the PS08 assumption that the distribution of follows a Gaussian with mean and standard deviation , and the distribution of is Gaussian with mean and dispersion . Indeed Ryden (2004) found that the distributions of intrinsic axis ratios are consistent with the Gaussian and log-normal shapes we are using. We use the PS08 model to fit the observed projected distribution in order to determine these parameters for each galaxy sample. This approach also requires a model for internal extinction, as we described above. An important quantity is , the ratio of the number of galaxies seen at inclination to the number expected without extinction,
| (1) |
where and are the uncorrected luminosity (here in the r-band) and colour (here ) functions, respectively, for a given sample. The function is the ratio between the number of observed extincted galaxies and intrinsic number of galaxies at a given luminosity, where the subindex indicates that it refers to the extincted luminosity function. Similarly, is the ratio between the underlying and reddened distributions of galaxy colours. contains the correlation between and , which we assume to be Gaussian with mean and dispersion as measured directly from the data. The function is thus completely characterised by the dust-corrected luminosity and colour functions, and by the parameters of the dust and shape model, namely , , , and . A grid of parameters is constructed, and for each grid point, , we obtain a model projected axis ratio distribution, which is compared to the observed distribution;
| (2) |
The best-fitting parameters correspond to the minimum value of throughout the parameter grid. Following PS08, we assume for elliptical galaxies.
| Sample | ||||||
|---|---|---|---|---|---|---|
| Type I ellipticals | 0.5 | 2.3 0.6 | 0.45 0.03 | 0.21 0.04 | 0.86 | |
| Type II ellipticals | 0.4 | 1.7 0.5 | 0.45 0.03 | 0.23 0.04 | 0.88 | |
| Type I spirals | 0.3 0.3 | 0.35 | 1.7 0.2 | 0.75 0.02 | 0.07 0.03 | 0.25 |
| Type II spirals | 0.3 0.3 | 0.3 | 2.2 0.2 | 0.75 0.02 | 0.04 0.02 | 0.33 |
Fig. 3 shows the best-fitting model compared to the observed distributions for each control galaxy sample. Symbols represent the observed SDSS galaxy distributions, and solid lines are the best-fitting models. The best fit parameters for each population are given in Table 2. The likelihood, , that corresponds to the minimum value quantifies whether our model is a good fit to the data, and is given for each case. The model axis distributions follow the observed ones well. The values of and for both elliptical galaxy populations are consistent with oblate spheroids, in agreement with previous analyses (e.g. Ryden 2004; Vincent & Ryden 2005; Padilla & Strauss 2008; Battye & Browne 2009). Moreover, control samples of both morphological types are characterised by shapes consistent (within the errors) with those of the full galaxy population as measured by PS08 using the SDSS DR6 (Adelman-McCarthy et al., 2006). The measured distributions, as well as the best fit values of , and , are similar for the type I and II AGN spirals; and show differences which could be used to argue against the unified model, but these are only marginally significant (slightly above one standard deviation; errorbars are given in Table 2). These slight differences could be due to different selection effects acting on each AGN type, an issue that we will explore further in Section 3.1.

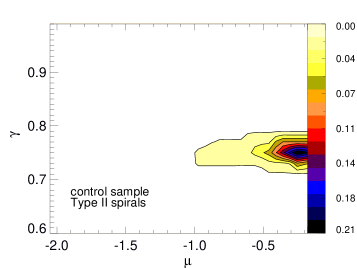
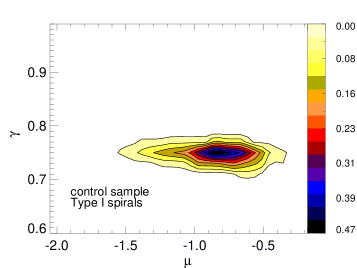
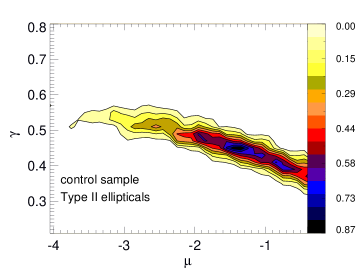
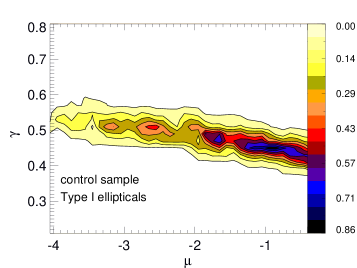
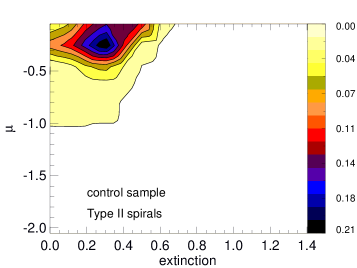
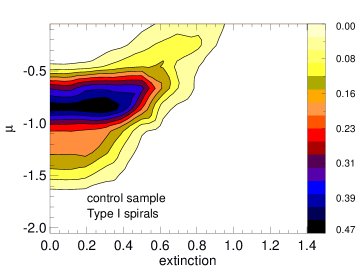
In order to analyse possible parameter degeneracies we study the probability contours (calculated from ) in the and spaces. Fig. 4 shows probability contours for the control samples of each AGN sample (as labelled). The white region surrounding the contours represents probabilities . The values of and are very well constrained, particularly for spiral galaxies, which show a very well defined region of high likelihood, while for elliptical galaxies the contours tend to be slightly elongated and tilted, allowing a larger range of possible parameter values in . This may be due to the lower sensitivity of the method to large negative values of , which are associated with very round shapes.
We also inspected the probability contours for all control samples (not shown) and find that these two parameters are slightly more degenerate than the plane. The quantity smooths the distributions, and therefore, the relatively large uncertainty in this parameter simply indicates that it does not have an important effect on the shape of the modelled axis ratio distributions.
Fig. 5 shows the probability contours in the space for the control samples of the type II (top panel) and type I (bottom panel) AGN spiral galaxy samples (ellipticals are assumed to have ). The extinction is only marginally detected in both cases. Dust strongly determines the likelihood that a galaxy will enter the sample at a given viewing angle, which consequently affects the observed axis ratio distribution. Note that is very insensitive to , except for extreme values of (i.e. ). This means that when galaxies are intrinsically elongated (independent of their inclination angle), a large extinction is needed in order to broaden the projected distribution and move its peak towards larger .
The modelled distributions do not show significant changes within the errors calculated for each parameter, implying that the confidence regions are reasonable. Now that we have characterised the intrinsic shape distribution of each control sample, we use these measured shapes to estimate the viewing angles of the AGN populations as a whole, and for different AGN and morphological types separately.
3 Inclinations and orientation alignments of the AGN population
We aim to obtain the inclination angle distribution of the AGN host galaxy population to determine whether there is a preference for face- or edge-on orientations in a given AGN population. To do this, we first calculate the predicted likelihood distribution of the projected as a function of the inclination angle (), given our model for the intrinsic shapes of galaxies of each control sample (i.e. parameters listed in Table 2). This is shown in Fig. 6. Here, the colour bar shows the likelihood normalized to give an integral of at each value of . Elliptical galaxies are characterised by wide distributions in at a given as a result of their intrinsic round shapes, while spiral galaxies have much narrower distributions, supported by the value of the probability peak in each case. Note that there are two local maxima in the top-right and bottom-left of each panel. These represent a non-null probability of having an intrinsically round or elongated object which has an edge- or face-on inclination, respectively. This probability is more significant in the case of elliptical galaxies.
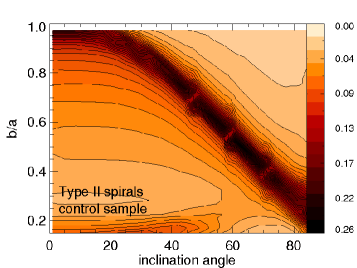
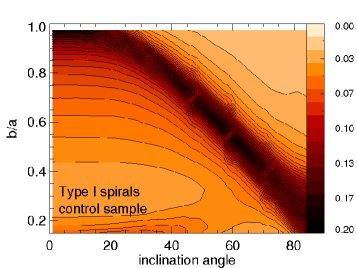
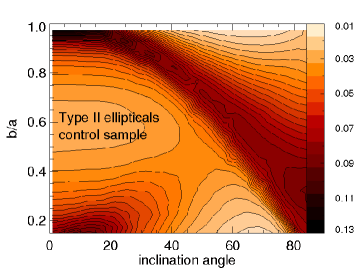
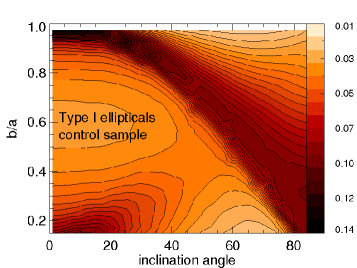
For each control galaxy sample we determine their distribution of inclination angles using the distribution of measured values and the probability function of inclination angles vs. shown in Fig. 6. These probability functions peak at higher values of inclination angle when decreases, and are narrower at lower values in all the control samples. We count the number of galaxies at each inclination angle, , weighting by , where is the probability that a given galaxy has an inclination angle of given its . When we do this for the control samples we find that they are consistent within the errors with uniform distributions in , as expected. To quantify the deviations from uniformity for the AGN sample, we study the ratios between the normalised distributions of of the AGN population and the corresponding control sample, .
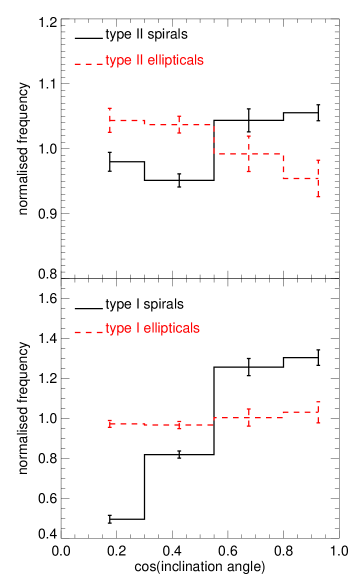
Fig. 7 shows the distributions of for spiral (solid) and elliptical (dashed) type II (top) and type I (bottom) AGN populations. The errorbars were calculated using the jackknife technique. Spiral type I AGNs have a clear tendency to be face-on; the tendency is weaker but still significant in the elliptical type I population. Type II ellipticals show the opposite tendency, with a distribution that has a maximum at , while type II spirals show no clear skew in their inclinations. The weak signal in the latter cases is consistent with the similarity in the distributions of the AGN and control samples (i.e. , Fig. 2), which can be interpreted in our model as differences in the polar viewing angle distributions. In general, the results from Fig. 7 allow us to rule out random orientations (i.e. a flat distribution in ) with a confidence of in the type I spiral population, in the type I elliptical population, in the type II elliptical population, and in the type II spiral population.
There have been several previous attempts to study the distributions of type I and II AGNs (e.g. Keel 1980, Lawrence & Elvis 1982, Kirhakos & Steiner 1990, McLeod & Rieke 1995, Nagar & Wilson 1999, Rigby et al. 2006), finding that type I AGN usually appear to have axis ratios close to , in agreement with our findings. Our approach is the first to include a consistent model that takes into account the intrinsic shapes of the AGN hosts and their intrinsic dust extinction.
In the unified model the type of AGN one observes is just a matter of the inclination of the obscuring torus to the line-of-sight (e.g. Antonucci 1993). Within this scenario, skewness in the distribution of the inclination angles of host AGN galaxies, like the ones we have found here, would reflect a preferential alignment between the large structures of the galaxy (kpc scales) and their central regions, as one would expect in the coherent scenario (see LPC09). However, the galactic disc itself may contribute to the absorption of the emission from the central engine, and particularly from the BLR (e.g. Maiolino & Rieke 1995; Lutz et al. 2003; Maiolino et al. 2003; Satyapal et al. 2008; Goulding & Alexander 2009, 2010), giving rise to skewness in the inclination angle distribution of AGN hosts. This is why it is important to explore the nature of the observed tendencies towards face- or edge-on of Fig 7.
In order to gain insight into the nature of the inclination angle distribution of the AGN samples, we study the dependence of the frequency shown in Fig 7 on properties of the emission line. We also calculate the expected distributions of for spirals if the galactic disc is responsible for the absorption of BLR emission in type II AGN.
3.1 Possible completeness problems in the AGN samples
Line emission from star formation activity in galaxies could represent an important bias in the optical classification of AGN from their emission-line properties. Several authors (e.g Goulding & Alexander 2009, 2010; Juneau & Dickinson 2011) have shown that a significant population of Seyfert IIs hosted by edge-on galaxies are misclassified due to this effect at low and intermediate redshifts. We expect this effect to be more important at low emission line luminosities since in this regime, the star-formation contribution to the emission-line flux could overwhelm the AGN light. Note that faint, low-luminosity emission lines are also difficult to detect given our high S/N limits. In this section we explore the sensitivity of the inclination angle distribution to the EW of the lines, with these effects included.
| Sample | AGN sample | control sample |
|---|---|---|
| All Type II AGN spirals | ||
| Low EW | ||
| High EW | ||
| All Type I AGN spirals | ||
| Low EW | ||
| High EW |
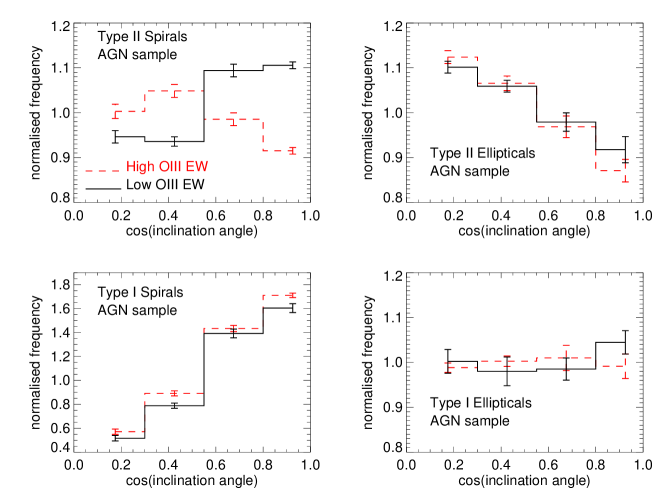
We divide the four samples of AGN galaxies in subsamples of low and high rest-frame EW of the emission line222We remind the reader that the emission line is generated in the narrow line region of AGNs, and therefore always appears narrow independent of the AGN type. This enables us to do a fair comparison between type I and II AGN subsamples. (divided at the sample median EW of ). For each subsample we construct its corresponding control sample as in . We find that these control samples are characterised by the same concentrations and colours as those shown in Fig. 1. However, the typical luminosities of the high and low EW samples are brighter and fainter by magnitudes than the distributions of Fig. 1, respectively. This is consistent with the observed BH-bulge relations (e.g. Ferrarese & Merritt 2000; Marconi & Hunt 2003; Häring & Rix 2004), where more massive BHs (which drive brighter AGN, in this case linked with higher EW) are hosted by more massive galaxies. Despite this difference in the intrinsic luminosity of the hosts, the intrinsic shape parameters derived from the control samples in each subsample of low and high [OIII] EW agree with each other within the uncertainties, and with the parameters found for each AGN sample overall (Table 2). Interestingly, the marginal differences seen between the intrinsic shapes of type I and II AGN spirals in Table 2 disappear when comparing the high [OIII] EW subsamples.
The resulting distributions of the subsample of AGN galaxies of high and low EW are shown in Fig. 8. The low/high EW subsamples are in good agreement with one another within the same AGN sample, except for type II spiral galaxies, where the high EW subsample shows a strong edge-on tendency.
Since the control samples have underlying shapes in agreement with each other, the differences seen between the low and high EW subsamples of the same AGN sample in Fig. 8 are not due to intrinsic differences in the hosts. This suggests that the low EW [OIII] subsample of type II spirals is subject to larger systematic biases than its high EW counterpart, and the unified model does provide a good explanation of the results for the latter.
In order to quantify the differences between the low and high EW subsamples of type II AGN spirals, we calculate the -weighted fractions of edge-on galaxies (those with , i.e. ) in each subsample. These fractions are shown in Table 3. For reference, we also show the edge-on galaxy fraction for type I AGN spirals, and for low and high [OIII] EW subsamples of the type I spirals. This fraction for the high EW subsample is % higher than in the low EW subsample in type II spirals, and is larger than the errors of the means. This suggests we are missing % of edge-on type II spirals with low EW. This number is a lower limit, since it assumes that the high EW subsample is complete and that we are just losing edge-on galaxies. This crude estimate is consistent within a factor of with the estimate by Juneau & Dickinson 2011 of optically misclassified SDSS DR4 AGN identified by their X-ray emission. They found that % of X-ray-bright edge-on galaxies are classified as star forming or composite star forming/AGN galaxies.
In the case of type I AGN spirals, the high [OIII] EW subsample shows a larger fraction of edge-on galaxies than the low [OIII] EW subsample, possibly indicating that the bias mentioned above is also affecting the type I AGN sample. However, when compared to the control sample, the difference is only %, which is smaller than the errors. Thus, the two subsamples are consistent within the errors, as expected from the distributions of Fig. 3. We conclude that obscuration from the galactic disc only has a significant effect on our ability to classify type II spirals.
3.2 Could the broad line absorption come from the galactic disc?
The obscuration preventing the direct observation of the accretion disc in type II AGN galaxies could be produced by a local torus or the galactic disc. Even though polarimetry results support the unified AGN model which invokes the local torus, detailed analysis of nearby galaxies have also revealed absorption of broad line regions by the galactic disc in some cases (Goulding & Alexander 2009; Goulding et al. 2010).
The results of the previous sections do not distinguish between these two possibilities. In an attempt to address this question, we test whether the observed distributions of type I and II spiral AGN can be reproduced by absorption by dust in the discs of their host galaxies333 It has been pointed out that elliptical galaxies often show circumnuclear discs which can also obscure the central engine (e.g. Kawata et al. 2007). However, our method is not able to probe this possibility.. To do this we use the heuristic dust model adopted by PS08, which depends on the parameter , the mean height of the galaxy ellipsoid. We assume that the dust lanes produce a covering fraction which depends on the luminosity of the galaxy and that varies with the inclination angle of the galaxy as
where is the edge-on covering fraction. Comparing with , the factor reflects the fact that we are considering extinction in luminosity rather than magnitudes. We adopt the extreme case of . We produce distributions of for galaxies with inclination angles in bins of weighted by the corresponding covering fraction , add them together, and compare the result with the observed distribution of type I and II AGN spirals.
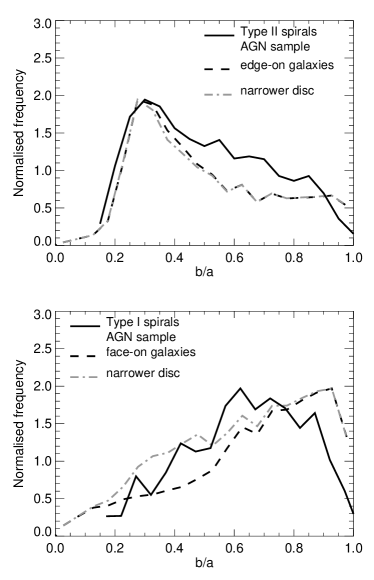
This is shown in Fig. 9, where the observed distributions for the AGN samples (see Fig. 2) are shown as solid lines, and the composite distributions for the case of pure disc absorption () are shown as dashed lines. For reference, we also show the composite distributions in the case where we consider galactic discs that are narrower, i.e. in , by a factor of two. The latter choice is motivated by the fact that the PS08 model attempts to fit the bulge and the galactic disc as a single photometric structure instead of distinguishing between them, which could spuriously broaden the galactic disc. Absorption by the galactic disc alone goes in the right direction, but does not fully reproduce the distributions of either type I or II AGN even assuming ; the resulting distributions show excesses of face-on and edge-on galaxies in the two cases, respectively. By considering narrower galactic discs we are able to broaden the distributions for type I spiral AGN slightly. However, the output distribution still has a clear excess of face-on galaxies. Moreover, is not strongly dependent on (i.e. a large population of type II AGNs could come from fairly face-on galaxies), meaning that we are forcing the composite distribution to be as broad as possible. Thus a more physical approach would give even narrower distributions. In addition, the pure galactic disc absorption scenario adopted here produces five times more type II than type I AGN at a given luminosity, in contradiction with the observed ratio of 444Note that these ratios are -weighted and thus refer to weighted number of detections. (Hao et al. 2005b; see also ).
Our results indicate that even if part of the broad line absorption takes place in galactic discs, additional sources of absorption such as a torus, are still needed. We will bear this in mind when analysing the relative orientations of torus and galactic disc angular momenta in the following section.
4 Alignments between the galaxy disc and an obscuring torus
We use the measured inclination angle distribution (cf. Fig. 7) to analyse alignments between the galaxy disc and the broad torus in spiral galaxies within the framework of the AGN unified model.
Within this paradigm, the obscuring torus must be broad in order to explain the wide inclination angle range over which type II AGN are found, and the ratio between the number of type II and type I AGN galaxies (e.g. Hao et al. 2005b; Treister et al. 2008; Reyes et al. 2008). We quantify the typical torus width by considering that the fraction of the solid angle covered by the torus corresponds to the weighted ratio of type II AGN to the total number of AGN,
| (3) |
where . This calculation shows that the torus has a typical azimuthal height of , which corresponds to a -weighted ratio of type I to II of 3:1. By measuring the luminosity function of type I and II AGNs, Hao et al. (2005b) show that this ratio depends on the AGN luminosity. They find ratios close to unity for low luminosities, for , and for , broadly consistent with our estimate, considering that the weighted mean luminosity of our sample is .
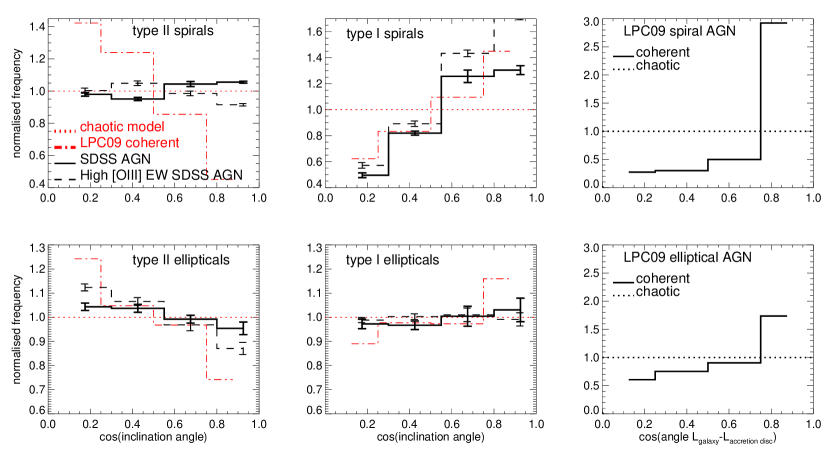
We use the output galaxies from the semi-analytic model of LPC09 to construct samples of modeled type I and type II AGN spirals and ellipticals using the typical torus width inferred above. We choose a random observer’s line of sight and estimate the projected angle subtended by the angular momentum of the accretion disc, . We assume perfect alignment between the obscuring torus and the accretion disc555This is expected at least to a high degree in models where the absorption of BLR occurs in radiation-driven winds from the accretion disk (see for instance Murray et al. 1995).. We run a Monte-Carlo simulation and extract torus heights, , so that the mean corresponds to . We consider those galaxies with as type II AGN, and the rest as type I AGN. Given each galaxy angular momentum direction, we estimate the observed projected inclination angles.
The left and middle panels of Fig. 10 show the resulting normalised frequency of the inclination angle of AGN hosts for the LPC09 semi-analytic model in the coherent and chaotic scenarios, and compare this with the observed distributions from Fig. 7. For reference, we also show the inclination angle distributions for the high [OIII] EW subsamples from Fig. 8 since they are more likely to be complete samples (see ). The right panel of Fig. 10 shows the theoretical expectations for the angle between the angular momentum of the galaxy and the accretion disc in the coherent and chaotic scenarios. In the chaotic model, the two angular momenta are unrelated and the distribution is flat. In the coherent model they are highly aligned due to the assumption that the accretion flow to the BH is perfectly aligned with the large-scale source of the gas. The coherent scenario reproduces the observed distributions of type I AGN quite closely, but it fails for type II AGN (particularly for type II AGN spirals). The discrepancies decrease slightly when comparing to the high [OIII] EW subsamples.
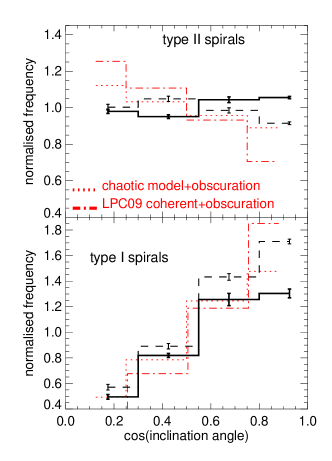
As was mentioned above, obscuration by the galactic disc may also affect the determination of the AGN type in spiral galaxies (see ). We consider this possibility by also including the heuristic model for the obscuration of the AGN emission by the galactic disc of in the predictions of the LCP09 model in the coherent and chaotic scenarios. In this case, highly inclined spiral galaxies have higher probability of being seen as type II AGN. A fraction of spiral galaxies at inclination will be classified as type II AGN. Fig. 11 shows the distribution of for spiral galaxies from Fig. 10, together with the chaotic model and the coherent model when the obscuration from the disc is included. The tendency of alignment observed in the LPC09 model in the coherent scenario becomes weaker for the type II spirals, and stronger in type I spirals. A tendency towards edge- and face-on orientations appears for type II and I AGN, respectively, in the chaotic model. This tendency is very similar to that observed: a very weak edge-on tendency for type II spirals, and a much stronger tendency towards face-on orientations for type I spirals. This suggests that the observed stronger signal for a preferred inclination of type I compared to type II hosts may be driven by obscuration from the galactic disc. However, the model of galactic disc obscuration we have used is maximal in the sense that it assumes that edge-on AGN galaxies are observed as type II AGN. More importantly, the adopted disc obscuration cannot reproduce the distribution of projected shapes of AGN hosts (see Fig. 9) or explain the tendencies observed in the elliptical population. Thus, disc obscuration cannot fully explain the type I and II dichotomy reported here.
On the other hand, the coherent model predicts a higher skewing towards face- or edge-on orientations of AGN hosts than we see in the observations, indicating that the degree of alignment between the galaxy and the torus (or accretion disc), in the observational sample is much weaker than in the idealized coherent scenario.
We summarize the comparison between the observed distribution of each AGN sample and the predictions of the LPC09 model with and without disc obscuration in Table 4. As can be seen from the between observations and models, neither, the chaotic nor the coherent model, is able to closely reproduce the observed distributions. The only exception is the high [OIII] EW subsample of type I AGN ellipticals, which is consistent with random orientations. This suggests that in general, the coherent and the chaotic scenarios represent idealized conditions; i.e. some loss of the angular momentum direction is expected during the infall, but this cannot be complete.
| Sample | chaotic | coherent | coherent+obscuration | chaotic+obscuration |
|---|---|---|---|---|
| Type I AGN spirals | 229 | 20 | 137 | 7 |
| Type II AGN spirals | 6 | 2007 | 700 | 250 |
| Type I AGN ellipticals | 3 | 8 | - | - |
| Type II AGN ellipticals | 15 | 86 | - | - |
| Type I AGN spirals high [OIII] EW | 535 | 94 | 100 | 61 |
| Type II AGN spirals high [OIII] EW | 37 | 1236 | 270 | 18 |
| Type I AGN ellipticals high [OIII] EW | 0.5 | 33 | - | - |
| Type II AGN ellipticals high [OIII] EW | 30 | 23 | - | - |
Our results indicate that, within the AGN unified model framework, there is some weak coherence between the torus and the host galaxy angular momenta, and that the purely chaotic scenario is ruled out.
5 Discussion
The results shown in the last two sections point to a scenario in which the AGN components, i.e. torus and accretion disc, are aligned to a significant degree with the angular momentum of the host galaxy.
Theoretical suggestions by LPC09 indicate that, under this condition, high BH spin values would be commonplace (cf. Section ). This preference for alignments could be explained by short timescales characterising the gas infall to the central parts of the galaxy. Bogdanović et al. (2007) show that this is likely to happen in gas-rich mergers (see also Barausse & Rezzolla 2009), where the BHs taking part in the galaxy merger will acquire %-% of their mass in a time which is short compared to the time needed for the BHs to spiral in towards the center ( yr, Escala et al. 2004, 2005), or the time for a starburst to deplete the supply of gas ( yr, Larson 1987). A potential problem with the preservation of the angular momentum direction in inflowing gas assumed in the coherent model comes from the difficulty in transporting gas through the corotation resonance radii of galaxies (Zhang & Buta 2007). However, Haan et al. (2009) found evidence for gas inflow beyond this radius in seven galaxies in the sample studied by García-Burillo et al. (2003), which continues to their resolution limit, pc away from the nuclei.
Direct comparison with detailed simulations of the feeding of BHs (e.g. Hobbs et al. 2010; Power et al. 2010; Hopkins & Quataert 2010) represents an attractive tool to test accretion scenarios and compare their expectations with the orientation results presented in this work. Nonetheless, BH feeding is indeed a challenging issue; understanding it depends strongly on modeling the local environmental effects such as star formation activity, supernovae explosions, local winds, and so on (e.g. Ciotti & Ostriker 2007; King et al. 2008; Nayakshin & Power 2010).
6 Summary and conclusions
We study the intrinsic shapes of SDSS DR7 AGN host galaxies and their inclination angle distributions, under the assumption that AGN host galaxies have the same underlying shapes as normal galaxies matched in colour, band luminosity, and concentration, . We examine elliptical and spiral type I and II AGN galaxies separately, and characterise the -D shapes of these samples using the model of Padilla & Strauss (2008). With these models we infer the distributions of inclination angles of AGN hosts. The main results are as follows.
(i) The structural parameters of the AGN control samples (Table ) are consistent with the full SDSS DR6 spiral and elliptical population reported by Padilla & Strauss (2008), and correspond to oblate spheroids with typical of for elliptical galaxies, and for spiral galaxies. The unified AGN model states that type I and II AGN are similar objects seen with different orientations. Consistent with this, we find that the intrinsic shapes of type I and II AGN hosts of a given morphological type are comparable.
(ii) Using the intrinsic shape parameters of control samples, we find that type I AGN galaxies have a strong tendency to be face-on, while type II AGN galaxies have only a slight tendency to be edge-on. In particular, type II spiral galaxies show a more uniform inclination angle distribution consistent with random orientations; only galaxies in the subsample of high [OIII] EW show clear edge-on orientations, indicating a possible selection effect acting on the low [OIII] EW spiral AGN. In the case of type I galaxies we are able to rule out random orientations with a confidence of and in the elliptical and spiral populations, respectively. In the case of the type II elliptical and spiral galaxies, we rule out random orientations with a confidence of and , respectively.
(iii) We use the estimated three-dimensional shapes of spiral galaxies to test whether dust extinction in the galactic discs could be responsible for the absorption of broad AGN lines in type II AGN galaxies. We find that the resulting predicted distributions are not compatible with those observed for either type I or II AGNs. This indicates that galactic discs cannot be the only source of broad line absorption, and supports the existence of broad tori surrounding the active nuclei.
(iv) Using the weighted frequency of type I to type II AGN, we found that the torus producing the absorption of broad lines has a typical azimuthal height of degrees.
(v) We compare the observed inclination angle distributions with the theoretical predictions of the LPC09 semi-analytic model for the coherent scenario under the AGN unified model (e.g. Fanaroff & Riley 1974; Barthel 1989; Madau et al. 1994; Gunn & Shanks 1999). We find that the model overpredicts the observed skewing towards face- or edge-on orientations of AGN hosts, but sucessfully reproduces the differences in the skewing between ellipticals and spirals. On the other hand, the chaotic scenario predicts tendencies towards face- and edge-on orientations of the type I and II AGN spirals, respectively, only if absorption from the galactic disc is assumed. However, in the case of elliptical galaxies the chaotic scenario fails unless large amounts of dust aligned with the major axis of the galaxy are assumed. Our results suggest that some, but not all, of the direction of the angular momentum of the material falling to the nucleus is coherent.
These results put important constraints on the physical processes involved in the gas inflow from the outer parts of the galaxy to the central engine. If the coherence of the accretion flow is frequent and large enough, high spin values () would be commonplace at the massive end of the BH population (Lagos et al. 2009), regardless of other physical processes as warps (King et al., 2005) and fragmentation inside the accretion disc (King et al., 2008). However, a scenario where just a small fraction of the gas flow keeps its original angular momentum direction has not been studied theoretically yet, and its consequences on BH growth and its spin remain to be explored.
Kinematic studies of individual AGN galaxies, as in Dumas et al. (2007), can help to further explore the alignments between gas infall and the whole galaxy. It should also be borne in mind that our approach of fitting the intrinsic shapes of galaxies from the photometry in SDSS has its limitations; a possible improvement could come from using the Galaxy Zoo Project (Lintott et al. 2008) morphologies, which can help to obtain more precise intrinsic shapes and, therefore, better and more reliable distributions of inclination angles for AGNs of different types. A different and promising approach based on the study of the orientations of host galaxies of radio sources, selected as to indicate relativistic jets pointing close to the line of sight, would give insight on the alignment between the galaxy and the BH spin (Lagos et al. in prep.).
Looking further to the future, the LISA survey (Johann et al. 2008) along with new high-resolution X-ray spectroscopy, will provide unequivocal information on the typical spins of the BH population and the orientations of jets. This will be complemented with detailed kinematic studies of the gas in large samples of galaxies (revealing the gas inflows) that the Square Kilometer Array (SKA; Schilizzi et al. 2008) will achieve, helping to solve these still open questions.
Acknowledgements
We kindly thank Carlton Baugh, Dave Alexander, Stéphanie Juneau, Philip Best, Chris Power, Peter Creasey and Yetli Rosas-Guevara for useful comments and discussions. We acknowledge the annonymous Referee for helpful remarks that allowed to improve this work. CL gratefully acknowledges an STFC Gemini studentship. CL and NP were supported by FONDAP ’Centro de Astrofísica’, BASAL-CATA, and FONDECYT No. 1071006. MAS was supported by NSF grant AST-0707266. For this project, 500 hours of cputime from the geryon cluster at AIUC were used.
Funding for the SDSS and SDSS-II has been provided by the Alfred P. Sloan Foundation, the Participating Institutions, the National Science Foundation, the US Department of Energy, the National Aeronautics and Space Administration, the Japanese Monbuka-gakusho, the Max Planck Society and the Higher Education Funding Council for England. The SDSS web site is http://www.sdss.org/. The SDSS is managed by the Astrophysical Research Consortium for the Participating Institutions. The Participating Institutions are the American Museum of Natural History, Astrophysical Institute Potsdam, University of Basel, University of Cambridge, Case Western Reserve University, University of Chicago, Drexel University, Fermilab, the Institute for Advanced Study, the Japan Participation Group, Johns Hopkins University, the Joint Institute for Nuclear Astrophysics, the Kavli Institute for Particle Astrophysics and Cosmology, the Korean Scientist Group, the Chinese Academy of Sciences (LAMOST), Los Alamos National Laboratory, the Max-Planck-Institute for Astronomy (MPIA), the Max-Planck-Institute for Astrophysics (MPA), New Mexico State Uni- versity, Ohio State University, University of Pittsburgh, University of Portsmouth, Princeton University, the United States Naval Observatory and the University of Washington. We have also used the FIRST radio data obtained with the NRAO VLA. The National Radio Astronomy Observatory is a facility of the National Science Foundation operated under cooperative agreement by Associated Universities, Inc. This research has made use of the NASA/IPAC Extragalactic Database (NED) which is operated by the Jet Propulsion Laboratory, California Institute of Technology, under contract with the National Aeronautics and Space Administration.
References
- Abazajian et al. (2004) Abazajian K., Adelman-McCarthy J. K., Agüeros M. A., Allam S. S., Anderson K., Anderson S. F., Annis J., Bahcall N. A. et al, 2004, AJ, 128, 502
- Abazajian et al. (2009) Abazajian K. N., Adelman-McCarthy J. K., Agüeros M. A., Allam S. S., Allende Prieto C., An D., Anderson K. S. J., Anderson S. F. et al, 2009, ApJS, 182, 543
- Adelman-McCarthy et al. (2006) Adelman-McCarthy J. K., Agüeros M. A., Allam S. S., Anderson K. S. J., Anderson S. F., Annis J., Bahcall N. A., Baldry I. K. et al, 2006, ApJS, 162, 38
- Antonucci (1993) Antonucci R., 1993, ARA&A, 31, 473
- Antonucci & Miller (1985) Antonucci R. R. J., Miller J. S., 1985, ApJ, 297, 621
- Bacon et al. (2001) Bacon R., Copin Y., Monnet G., Miller B. W., Allington-Smith J. R., Bureau M., Carollo C. M., Davies R. L. et al, 2001, MNRAS, 326, 23
- Barausse & Rezzolla (2009) Barausse E., Rezzolla L., 2009, ApJ, 704, L40
- Barthel (1989) Barthel P. D., 1989, ApJ, 336, 606
- Battye & Browne (2009) Battye R. A., Browne I. W. A., 2009, MNRAS, 399, 1888
- Berti & Volonteri (2008) Berti E., Volonteri M., 2008, ApJ, 684, 822
- Blandford & Znajek (1977) Blandford R. D., Znajek R. L., 1977, MNRAS, 179, 433
- Blundell et al. (1999) Blundell K. M., Rawlings S., Willott C. J., 1999, AJ, 117, 677
- Bogdanović et al. (2007) Bogdanović T., Reynolds C. S., Miller M. C., 2007, ApJ, 661, L147
- Borguet et al. (2008) Borguet B., Hutsemékers D., Letawe G., Letawe Y., Magain P., 2008, A&A, 478, 321
- Bower et al. (2006) Bower R. G., Benson A. J., Malbon R., Helly J. C., Frenk C. S., Baugh C. M., Cole S., Lacey C. G., 2006, MNRAS, 370, 645
- Brenneman & Reynolds (2006) Brenneman L. W., Reynolds C. S., 2006, ApJ, 652, 1028
- Cao & Li (2008) Cao X., Li F., 2008, MNRAS, 390, 561
- Cattaneo et al. (2006) Cattaneo A., Dekel A., Devriendt J., Guiderdoni B., Blaizot J., 2006, MNRAS, 370, 1651
- Chambers et al. (1987) Chambers K. C., Miley G. K., van Breugel W., 1987, Nature, 329, 604
- Ciotti & Ostriker (2007) Ciotti L., Ostriker J. P., 2007, ApJ, 665, 1038
- Conselice (2006) Conselice C. J., 2006, MNRAS, 373, 1389
- Croton et al. (2006) Croton D. J., Springel V., White S. D. M., De Lucia G., Frenk C. S., Gao L., Jenkins A., Kauffmann G. et al, 2006, MNRAS, 365, 11
- De Young (1995) De Young D. S., 1995, ApJ, 446, 521
- de Zeeuw et al. (2002) de Zeeuw P. T., Bureau M., Emsellem E., Bacon R., Carollo C. M., Copin Y., Davies R. L., Kuntschner H. et al, 2002, MNRAS, 329, 513
- Dumas et al. (2007) Dumas G., Mundell C. G., Emsellem E., Nagar N. M., 2007, MNRAS, 379, 1249
- Dunkley et al. (2009) Dunkley J., Komatsu E., Nolta M. R., Spergel D. N., Larson D., Hinshaw G., Page L., Bennett C. L. et al, 2009, ApJS, 180, 306
- Elvis et al. (2002) Elvis M., Risaliti G., Zamorani G., 2002, ApJ, 565, L75
- Escala et al. (2004) Escala A., Larson R. B., Coppi P. S., Mardones D., 2004, ApJ, 607, 765
- Fabian et al. (2002) Fabian A. C., Vaughan S., Nandra K., Iwasawa K., Ballantyne D. R., Lee J. C., De Rosa A., Turner A. et al, 2002, MNRAS, 335, L1
- Fanaroff & Riley (1974) Fanaroff B. L., Riley J. M., 1974, MNRAS, 167, 31P
- Fanidakis et al. (2009) Fanidakis N., Baugh C. M., Benson A. J., Bower R. G., Cole S., Done C., Frenk C. S., 2009, ArXiv e-prints
- Ferrarese & Merritt (2000) Ferrarese L., Merritt D., 2000, ApJ, 539, L9
- Fragile et al. (2007) Fragile P. C., Blaes O. M., Anninos P., Salmonson J. D., 2007, ApJ, 668, 417
- García-Burillo et al. (2003) García-Burillo S., Combes F., Eckart A., Tacconi L. J., Hunt L. K., Leon S., Baker A. J., Englmaier P. P., Boone F., Schinnerer E., Neri R., 2003, in Astronomical Society of the Pacific Conference Series, Vol. 290, Active Galactic Nuclei: From Central Engine to Host Galaxy, S. Collin, F. Combes, & I. Shlosman, ed., pp. 423–+
- Goulding & Alexander (2009) Goulding A. D., Alexander D. M., 2009, MNRAS, 398, 1165
- Goulding et al. (2010) Goulding A. D., Alexander D. M., Lehmer B. D., Mullaney J. R., 2010, MNRAS, 406, 597
- Greenhill et al. (2009) Greenhill L. J., Kondratko P. T., Moran J. M., Tilak A., 2009, ApJ, 707, 787
- Gunn & Shanks (1999) Gunn K. F., Shanks T., 1999, Advances in Space Research, 23, 1155
- Haan et al. (2009) Haan S., Schinnerer E., Emsellem E., García-Burillo S., Combes F., Mundell C. G., Rix H., 2009, ApJ, 692, 1623
- Hao et al. (2005a) Hao L., Strauss M. A., Fan X., Tremonti C. A., Schlegel D. J., Heckman T. M., Kauffmann G., Blanton M. R. et al, 2005a, AJ, 129, 1795
- Hao et al. (2005b) Hao L., Strauss M. A., Tremonti C. A., Schlegel D. J., Heckman T. M., Kauffmann G., Blanton M. R., Fan X. et al, 2005b, AJ, 129, 1783
- Häring & Rix (2004) Häring N., Rix H., 2004, ApJ, 604, L89
- Hatziminaoglou et al. (2009) Hatziminaoglou E., Fritz J., Jarrett T. H., 2009, MNRAS, 399, 1206
- Hinshaw et al. (2009) Hinshaw G., Weiland J. L., Hill R. S., Odegard N., Larson D., Bennett C. L., Dunkley J., Gold B. et al, 2009, ApJS, 180, 225
- Hobbs et al. (2010) Hobbs A., Nayakshin S., Power C., King A., 2010, ArXiv e-prints
- Hopkins et al. (2007) Hopkins P. F., Hernquist L., Cox T. J., Robertson B., Krause E., 2007, ApJ, 669, 45
- Hopkins & Quataert (2010) Hopkins P. F., Quataert E., 2010, MNRAS, 407, 1529
- Hughes & Blandford (2003) Hughes S. A., Blandford R. D., 2003, ApJ, 585, L101
- Iwasawa et al. (1996) Iwasawa K., Fabian A. C., Mushotzky R. F., Brandt W. N., Awaki H., Kunieda H., 1996, MNRAS, 279, 837
- Johann et al. (2008) Johann U. A., Ayre M., Gath P. F., Holota W., Marenaci P., Schulte H. R., Weimer P., Weise D., 2008, Journal of Physics Conference Series, 122, 012005
- Juneau & Dickinson (2011) Juneau S., Dickinson M., 2011. Submitted to ApJ
- Kauffmann et al. (2003) Kauffmann G., Heckman T. M., White S. D. M., Charlot S., Tremonti C., Peng E. W., Seibert M., Brinkmann J. et al, 2003, MNRAS, 341, 54
- Kawata et al. (2007) Kawata D., Cen R., Ho L. C., 2007, ApJ, 669, 232
- Keel (1980) Keel W. C., 1980, AJ, 85, 198
- Kewley et al. (2001) Kewley L. J., Dopita M. A., Sutherland R. S., Heisler C. A., Trevena J., 2001, ApJ, 556, 121
- King et al. (2005) King A. R., Lubow S. H., Ogilvie G. I., Pringle J. E., 2005, MNRAS, 363, 49
- King & Pringle (2006) King A. R., Pringle J. E., 2006, MNRAS, 373, L90
- King et al. (2008) King A. R., Pringle J. E., Hofmann J. A., 2008, MNRAS, 385, 1621
- Kinney et al. (2000) Kinney A. L., Schmitt H. R., Clarke C. J., Pringle J. E., Ulvestad J. S., Antonucci R. R. J., 2000, ApJ, 537, 152
- Kirhakos & Steiner (1990) Kirhakos S. D., Steiner J. E., 1990, AJ, 99, 1435
- Krajnović et al. (2008) Krajnović D., Bacon R., Cappellari M., Davies R. L., de Zeeuw P. T., Emsellem E., Falcón-Barroso J., Kuntschner H. et al, 2008, MNRAS, 390, 93
- Lagos et al. (2008) Lagos C. D. P., Cora S. A., Padilla N. D., 2008, MNRAS, 388, 587
- Lagos et al. (2009) Lagos C. D. P., Padilla N. D., Cora S. A., 2009, MNRAS, 395, 625
- Larson (1987) Larson R. B., 1987, in Starbursts and Galaxy Evolution, T. X. Thuan, T. Montmerle, & J. Tran Thanh van, ed., pp. 467–482
- Lawrence & Elvis (1982) Lawrence A., Elvis M., 1982, ApJ, 256, 410
- Lintott et al. (2008) Lintott C. J., Schawinski K., Slosar A., Land K., Bamford S., Thomas D., Raddick M. J., Nichol R. C. et al, 2008, MNRAS, 389, 1179
- Lutz et al. (2003) Lutz D., Sturm E., Genzel R., Spoon H. W. W., Moorwood A. F. M., Netzer H., Sternberg A., 2003, A&A, 409, 867
- Lynden-Bell (2006) Lynden-Bell D., 2006, MNRAS, 369, 1167
- Madau et al. (1994) Madau P., Ghisellini G., Fabian A. C., 1994, MNRAS, 270, L17+
- Maiolino et al. (2003) Maiolino R., Comastri A., Gilli R., Nagar N. M., Bianchi S., Böker T., Colbert E., Krabbe A. et al, 2003, MNRAS, 344, L59
- Maiolino & Rieke (1995) Maiolino R., Rieke G. H., 1995, ApJ, 454, 95
- Marconi & Hunt (2003) Marconi A., Hunt L. K., 2003, ApJ, 589, L21
- Marconi et al. (2004) Marconi A., Risaliti G., Gilli R., Hunt L. K., Maiolino R., Salvati M., 2004, MNRAS, 351, 169
- Martínez-Sansigre & Taylor (2009) Martínez-Sansigre A., Taylor A. M., 2009, ApJ, 692, 964
- Marulli et al. (2008) Marulli F., Bonoli S., Branchini E., Moscardini L., Springel V., 2008, MNRAS, 385, 1846
- McCarthy (1993) McCarthy P. J., 1993, ARA&A, 31, 639
- McCarthy et al. (1987) McCarthy P. J., van Breugel W., Spinrad H., Djorgovski S., 1987, ApJ, 321, L29
- McLeod & Rieke (1995) McLeod K. K., Rieke G. H., 1995, ApJ, 441, 96
- McNamara et al. (1996) McNamara B. R., Wise M., Sarazin C. L., Jannuzi B. T., Elston R., 1996, ApJ, 466, L9+
- Miller et al. (1990) Miller L., Peacock J. A., Mead A. R. G., 1990, MNRAS, 244, 207
- Moderski et al. (1998) Moderski R., Sikora M., Lasota J., 1998, MNRAS, 301, 142
- Murray et al. (1995) Murray N., Chiang J., Grossman S. A., Voit G. M., 1995, ApJ, 451, 498
- Nagar & Wilson (1999) Nagar N. M., Wilson A. S., 1999, ApJ, 516, 97
- Nayakshin & Power (2010) Nayakshin S., Power C., 2010, MNRAS, 402, 789
- Netzer (2009) Netzer H., 2009, MNRAS, 399, 1907
- Osterbrock (1984) Osterbrock D. E., 1984, QJRAS, 25, 1
- Padilla et al. (2009) Padilla N., Garcia Lambas D., Gonzalez R., 2009, ArXiv e-prints
- Padilla & Strauss (2008) Padilla N. D., Strauss M. A., 2008, MNRAS, 388, 1321
- Petrosian (1976) Petrosian V., 1976, ApJ, 209, L1
- Power et al. (2010) Power C., Nayakshin S., King A., 2010, ArXiv e-prints
- Rawlings & Saunders (1991) Rawlings S., Saunders R., 1991, Nature, 349, 138
- Reyes et al. (2008) Reyes R., Zakamska N. L., Strauss M. A., Green J., Krolik J. H., Shen Y., Richards G. T., Anderson S. F. et al, 2008, AJ, 136, 2373
- Reynolds & Nowak (2003) Reynolds C. S., Nowak M. A., 2003, Phys. Rep., 377, 389
- Rigby et al. (2006) Rigby J. R., Rieke G. H., Donley J. L., Alonso-Herrero A., Pérez-González P. G., 2006, ApJ, 645, 115
- Ryden (2004) Ryden B. S., 2004, ApJ, 601, 214
- Sánchez et al. (2006) Sánchez A. G., Baugh C. M., Percival W. J., Peacock J. A., Padilla N. D., Cole S., Frenk C. S., Norberg P., 2006, MNRAS, 366, 189
- Satyapal et al. (2008) Satyapal S., Vega D., Dudik R. P., Abel N. P., Heckman T., 2008, ApJ, 677, 926
- Schilizzi et al. (2008) Schilizzi R. T., Dewdney P. E. F., Lazio T. J. W., 2008, in Society of Photo-Optical Instrumentation Engineers (SPIE) Conference Series, Vol. 7012, Society of Photo-Optical Instrumentation Engineers (SPIE) Conference Series
- Schmitt et al. (2002) Schmitt H. R., Pringle J. E., Clarke C. J., Kinney A. L., 2002, ApJ, 575, 150
- Shakura & Sunyaev (1973) Shakura N. I., Sunyaev R. A., 1973, A&A, 24, 337
- Shapiro (2005) Shapiro S. L., 2005, ApJ, 620, 59
- Shen et al. (2010) Shen S., Shao Z., Gu M., 2010, ArXiv e-prints
- Sijacki et al. (2007) Sijacki D., Springel V., Di Matteo T., Hernquist L., 2007, MNRAS, 380, 877
- Sikora et al. (2007) Sikora M., Stawarz Ł., Lasota J., 2007, ApJ, 658, 815
- Soltan (1982) Soltan A., 1982, MNRAS, 200, 115
- Somerville et al. (2008) Somerville R. S., Hopkins P. F., Cox T. J., Robertson B. E., Hernquist L., 2008, MNRAS, 391, 481
- Strauss et al. (2002) Strauss M. A., Weinberg D. H., Lupton R. H., Narayanan V. K., Annis J., Bernardi M., Blanton M., Burles S. et al, 2002, AJ, 124, 1810
- Treister et al. (2008) Treister E., Krolik J. H., Dullemond C., 2008, ApJ, 679, 140
- Urry & Padovani (1995) Urry C. M., Padovani P., 1995, PASP, 107, 803
- Veilleux & Osterbrock (1987) Veilleux S., Osterbrock D. E., 1987, ApJS, 63, 295
- Vincent & Ryden (2005) Vincent R. A., Ryden B. S., 2005, ApJ, 623, 137
- Volonteri et al. (2005) Volonteri M., Madau P., Quataert E., Rees M. J., 2005, ApJ, 620, 69
- Volonteri et al. (2007) Volonteri M., Sikora M., Lasota J., 2007, ApJ, 667, 704
- Wang et al. (2009) Wang J., Hu C., Li Y., Chen Y., King A. R., Marconi A., Ho L. C., Yan C. et al, 2009, ApJ, 697, L141
- York et al. (2000) York D. G., Adelman J., Anderson Jr. J. E., Anderson S. F., Annis J., Bahcall N. A., Bakken J. A., Barkhouser R. et al, 2000, AJ, 120, 1579
- Yu & Lu (2008) Yu Q., Lu Y., 2008, ApJ, 689, 732
- Yu & Tremaine (2002) Yu Q., Tremaine S., 2002, MNRAS, 335, 965
- Zakamska et al. (2005) Zakamska N. L., Schmidt G. D., Smith P. S., Strauss M. A., Krolik J. H., Hall P. B., Richards G. T., Schneider D. P. et al, 2005, AJ, 129, 1212
- Zhang et al. (2006) Zhang J. S., Henkel C., Kadler M., Greenhill L. J., Nagar N., Wilson A. S., Braatz J. A., 2006, A&A, 450, 933
- Zhang et al. (2008) Zhang S., Bian W., Huang K., 2008, A&A, 488, 113
- Zhang & Buta (2007) Zhang X., Buta R. J., 2007, AJ, 133, 2584