Forward Physics at CMS
Abstract
Studies of forward processes are important tests of the standard model and inputs for Monte Carlo tuning. A measurement of the energy flow in the forward pseudorapidity region of CMS, , is presented for 3 values of the centre-of-mass energy = 0.9 TeV, 2.36 TeV and 7 TeV. The forward energy flow is measured for minimum bias events and for events with a central dijet system the transverse energy of which provides a hard scale. The energy flow is compared to various Monte Carlo models with different multiparton interaction schemes. A study of forward jets in the pseudorapidity range is presented for = 7 TeV.
Keywords:
Forward Energy Flow - Forward Jets:
12.38.Aw - 13.85.Hd - 13.87.Ce1 Measurement of the forward energy flow
Measurements in the forward region probe the parton content of the proton at small values of the proton momentum fraction, in a region where the parton densities might become very large and where the probability for more than one partonic interaction per event should increase. The measurement of the energy flow in the CMS forward region FwdEFlow:2010 , in the pseudorapidity range , should therefore be sensitive to the modelling of parton radiation at large and the description of multiparton interactions (MPI) Sjostrand:1987su . The measurement is performed for two event classes: a minimum bias sample and a sample of events with a central dijet system. The first class is characterized by zero or few partonic interactions, while the second one has at least one hard scattering at the parton level. The amount of parton radiation in the forward region is therefore expected to be larger for the dijet sample, which should be directly reflected in the forward energy flow. The forward measurement can thus provide a complementary and independent constraint on the MPI modelling.
1.1 HF calorimeter and Trigger subsystem
A detailed description of the CMS experiment can be found elsewhere :2008zzk and we only describe here the subsystems used to obtain the presented results. The two Hadronic Forward calorimeters HF+ and HF-, located at 11.2 m from the nominal interaction point (IP), cover the pseudorapidity region . These are Cerenkov calorimeters made of radiation hard quartz fibers embedded into steel absorbers. Two subsystems, the Beam Scintillator Counters (BSC) and the Beam Pick-up Timing for the eXperiments (BPTX) are used to trigger the detector readout BSCBPTX . The two BSCs are located at 10.86 m from the IP and cover the pseudorapidity region . Each is a set of 16 scintillator tiles. The BSC elements have a time resolution of 3 ns and are designed to provide hit and coincidence rates. The two BPTXs, located around the beam pipe at 175 m from the IP, are designed to provide precise information on the bunch structure and timing of the incoming beam, with better than 0.2 ns time resolution.
1.2 Analysis strategy and event selection
The forward energy flow is measured at 3 values of = 0.9 TeV, 2.36 TeV and 7 TeV, for the 2 event classes described above. The following conditions are imposed to select the minimum bias sample. A signal is required in each of the BSCs in conjunction with BPTX signals from both beams passing the IP. This condition rejects a large fraction of diffractive events. A primary vertex is required with 15 cm and a transverse distance from the axis smaller than 2 cm. Further cuts are applied to reject beam-halo event candidates, beam-scraping events and events with large signals consistent with noise in HF. The energy flow is then measured in 5 different bins by summing up all the energy deposits in the HF towers above a noise threshold of 4 GeV. The following conditions are imposed to select the dijet sample. Jets are reconstructed by means of the anti- jet algorithm Cacciari:2008gp with R = 0.5. The dijet sample consists of events with at least two leading jets with and . Jets are required to have GeV at = 0.9 TeV and 2.36 TeV, and GeV at = 7 TeV.
1.3 Results and Monte Carlo Comparison
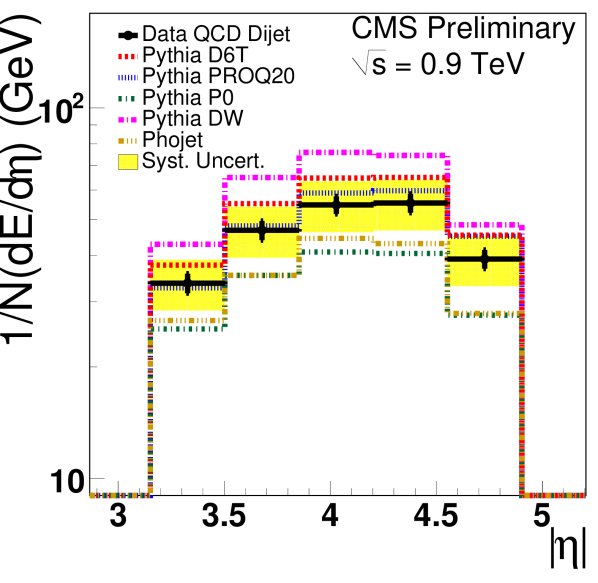
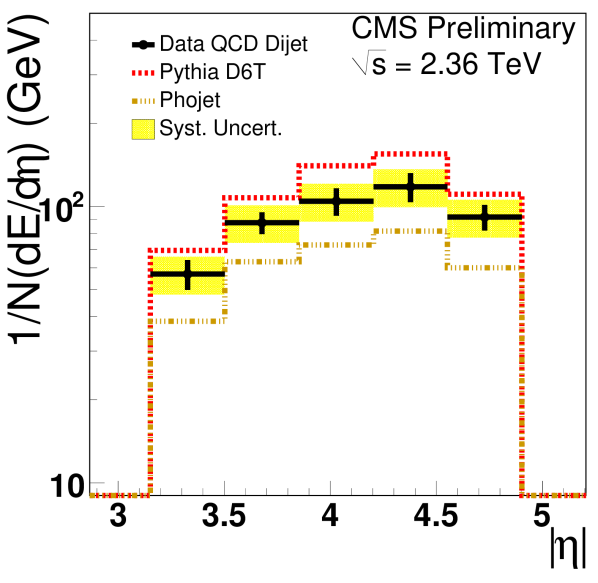
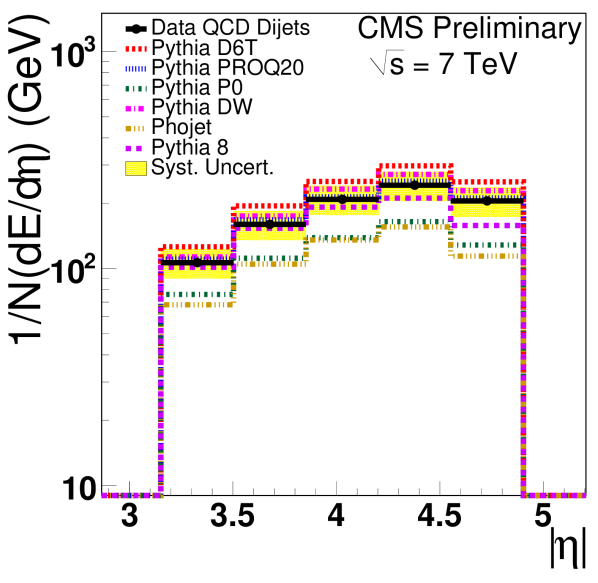
Figure 1 shows the energy flow in HF at detector level, in the region , for the minimum bias and dijet samples, at = 0.9 TeV, 2.36 TeV and 7 TeV. Error bars indicate statistical uncertainties, while the dashed bands represent the total systematic uncertainty. The dominant contribution of 15 corresponds to the global HF energy scale uncertainty. Detector level distributions are compared to predictions from Monte Carlo event generators passed through the full CMS detector simulation based on Geant4 Agostinelli:2002hh . The predictions from PYTHIA6 Sjostrand:2006za use different sets of parameters for the MPI: the tunes D6T Field:2009zz , DW Field:2009zz , PROQ20 Buckley:2009bj and Perugia P0 Skands:2009zm . In the latter case a new MPI model is used Wicke:2008iz . The predictions from the Monte Carlo event generators PYTHIA8 Sjostrand:2007gs and PHOJET Bopp:1998rc are also shown. The forward energy flow in the miminum bias sample shows a stronger energy dependence in data than in Monte Carlo. This behaviour is not observed in the dijet event sample. The energy flow in the 900 GeV minimum bias sample is best described by the D6T tune, whereas the PROQ20 and P0 tunes and PHOJET underestimate the data. At = 7 TeV, all the Monte Carlo predictions underestimate the data, with PYTHIA8 being close to the PROQ20 tune. In the dijet sample, the D6T tune is too high compared to the data, the P0 tune and PHOJET are too low, and the best description is given by the PROQ20 tune and PYTHIA8.
![[Uncaptioned image]](/html/1011.4672/assets/x1.png)
![[Uncaptioned image]](/html/1011.4672/assets/x2.png)
![[Uncaptioned image]](/html/1011.4672/assets/x3.png)
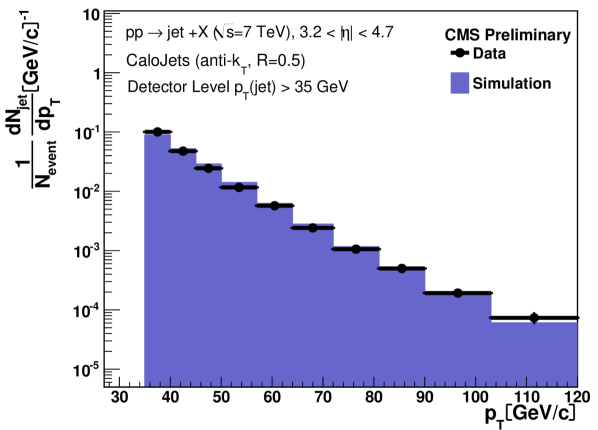
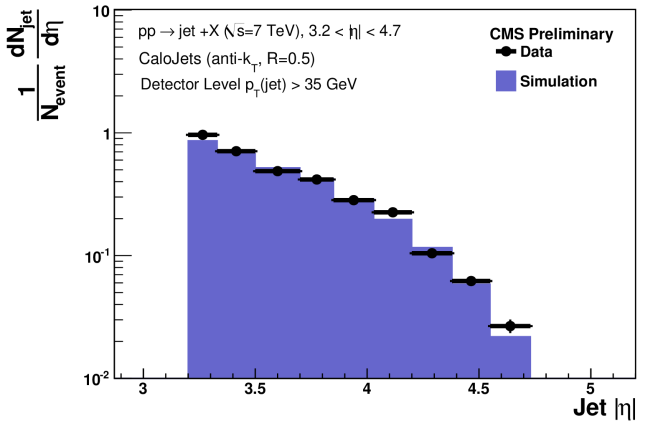
2 Reconstruction of forward jets
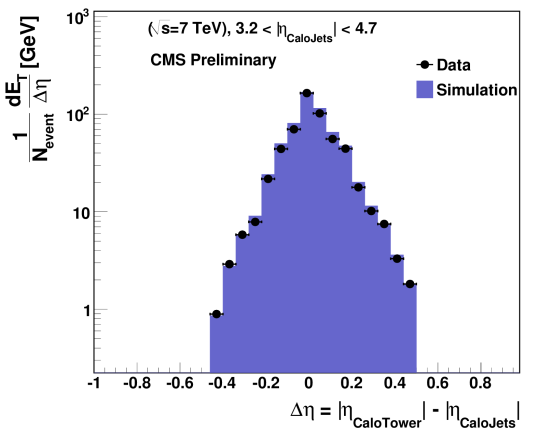
Jet production has never been investigated at hadron colliders in such a forward region as the one covered by the HF calorimeter. The first step before measuring forward jets in HF is to validate the jet reconstruction in that region FwdJets:2010 . The event selection is similar to that used to select the miminum bias sample. Jets are reconstructed by means of the anti- jet algorithm Cacciari:2008gp with R = 0.5, are required to have GeV and . The jet energy is corrected for energy loss and non-linear response of the calorimeter. The sample used for the study has been recorded at = 7 TeV and corresponds to an integrated luminosity of 10 nb-1. Figure 2 shows the distribution of the transverse energy flow inside of the jets as a function of the distance with respect to the jet axis (left), the forward jet spectrum (center) and spectrum (right). Detector level distributions with statistical errors only are compared to the predictions of the Monte Carlo event generator PYTHIA6 using the D6T tune. A reasonable agreement is found for the different distributions.
3 Conclusion
The first measurement at hadron colliders of the forward energy flow in the region has been presented, for a minimum bias sample and a sample of events with a hard scale defined by a central dijet system. The forward energy flow in the miminum bias sample shows a stronger energy dependence in data than in Monte Carlo. At = 7 TeV, all the Monte Carlo predictions underestimate the measured minimum bias energy flow. Such a behaviour is not observed in the dijet event sample. The Monte Carlo tunes giving the best description in the forward region differ from those giving the best description of the charged particle spectra in the central region Krajczar:2009zz . The validation of the forward jets reconstruction in the HF acceptance has been presented at = 7 TeV.
References
- (1) CMS Collaboration, PAS-FWD-10-002 (2010).
- (2) T. Sjostrand and M. van Zijl, Phys. Rev. D 36 (1987) 2019.
- (3) R. Adolphi et al. [CMS Collaboration], JINST 3 (2008) S08004.
- (4) T. Aumeyr, Master thesis, Vienna University of Technology, Austria, 2008.
- (5) M. Cacciari, G. P. Salam and G. Soyez, JHEP 0804 (2008) 063 [arXiv:0802.1189 [hep-ph]].
- (6) S. Agostinelli et al. [GEANT4 Collaboration], Nucl. Instrum. Meth. A 506 (2003) 250.
- (7) T. Sjostrand, S. Mrenna and P. Z. Skands, JHEP 0605 (2006) 026 [arXiv:hep-ph/0603175].
- (8) R. Field, “Studying the Underlying Event at CDF and the LHC,” proceedings of the first International Workshop on Multiple Partonic Interactions at the LHC, Perugia, Italy, October 27-31, 2008.
- (9) A. Buckley, H. Hoeth, H. Lacker, H. Schulz and J. E. von Seggern, Eur. Phys. J. C 65 (2010) 331.
- (10) P. Z. Skands, “The Perugia Tunes,” [arXiv:0905.3418 [hep-ph]].
- (11) D. Wicke and P. Z. Skands, Nuovo Cim. 123B (2008) S1 [arXiv:0807.3248 [hep-ph]].
- (12) T. Sjostrand, S. Mrenna and P. Z. Skands, Comput. Phys. Commun. 178 (2008) 852.
- (13) F. W. Bopp, R. Engel and J. Ranft, arXiv:hep-ph/9803437.
- (14) CMS Collaboration, DPS-2010-026 (2010).
- (15) K. Krajczar [CMS Collaboration], PoS E PS-HEP2009 (2009) 062.