The First Systematic Study of Type Ibc Supernova multi-band light curves
Abstract
We present detailed optical photometry for 25 Type Ibc supernovae (SNe Ibc) within Mpc obtained with the robotic Palomar 60-inch telescope in 2004-2007. This study represents the first uniform, systematic, and statistical sample of multi-band SNe Ibc light curves available to date. We correct the light curves for host galaxy extinction using a new technique based on the photometric color evolution, namely, we show that the color of extinction-corrected SNe Ibc at d after band maximum is tightly distributed, mag. Using this technique, we find that SNe Ibc typically suffer from significant host galaxy extinction, mag. A comparison of the extinction-corrected light curves for helium-rich (Type Ib) and helium-poor (Type Ic) SNe reveals that they are statistically indistinguishable, both in luminosity and decline rate. We report peak absolute magnitudes of mag and mag for SNe Ib and Ic, respectively. Focusing on the broad-lined (BL) SNe Ic, we find that they are more luminous than the normal SNe Ibc sample, mag, with a probability of only 1.6% that they are drawn from the same population of explosions. By comparing the peak absolute magnitudes of SNe Ic-BL with those inferred for local engine-driven explosions (GRB-SN 1998bw, XRF-SN 2006aj, and SN 2009bb) we find a probability that relativistic SNe are drawn from the overall SNe Ic-BL population. Finally, we fit analytic models to the light curves to derive typical 56Ni masses of and for SNe Ibc and SNe Ic-BL, respectively. With reasonable assumptions for the photospheric velocities, we further extract kinetic energy and ejecta mass values of and erg for SNe Ibc, while for SNe Ic-BL we find higher values, and erg. We discuss the implications for the progenitors of SNe Ibc and their relation to those of engine-driven explosions.
Subject headings:
supernovae — gamma-ray bursts1. Introduction
Type Ibc supernovae (SNe Ibc) are a distinct class of catastrophic stellar explosions, identified by the lack of hydrogen features and the presence of weak silicon features in their optical spectra (see Filippenko 1997 for a review). In the traditional classification scheme, the presence and strength of helium absorption features may further differentiate the class of SNe Ibc into two sub-classes: Ib (He-rich) and Ic (He-poor; see Matheson et al. 2001). Based on their proximity to star-forming regions (Porter & Filippenko, 1987; van Dyk, Hamuy & Filippenko, 1996), and their often strong radio/X-ray emission attributed to circumstellar interaction (Weiler et al. 1986; Chevalier 1998; Berger et al. 2003; Chevalier & Fransson 2006; Soderberg 2007), SNe Ibc are now recognized as core-collapse explosions of massive stars111There are notable exceptions, however, which comprise only a small fraction of the bulk SN Ibc population and include SN 2005E-like white dwarf events (Perets et al., 2010), pair-instability SNe (Gal-Yam et al., 2009) and pulsational pair-instability SNe (Quimby et al., 2009). stripped of their hydrogen (and often helium) layers (Elias et al., 1985; Filippenko & Sargent, 1985; Wheeler & Levreault, 1985; Uomoto, & Kirshner, 1985; Clocchiatti et al., 1996; Woosley, Heger & Weaver, 2002).
Unlike other core-collapse SNe, however, the progenitor systems of SNe Ibc have yet to be directly identified in pre-explosion images (see Smartt 2009 for a review). Motivated by their observed properties, two primary progenitor channels have been proposed: (i) isolated and massive Wolf-Rayet (WR) stars that ejected their outer envelope through radiation-driven stellar winds (Begelman & Sarazin, 1986; Woosley, Langer & Weaver, 1995), and (ii) lower mass helium stars in close binary systems characterized by mass transfer (Wheeler & Levreault, 1985; Podsiadlowski, Joss & Hsu, 1992; Yoon, Woosley & Langer, 2010). It remains open to debate whether one or both of these progenitor channels gives rise to the observed SN Ibc population.
Recent host galaxy studies suggest dissimilar progenitor channels for SNe Ib and Ic based on the properties (e.g., luminosity, chemistry, star-formation rate) of the explosion sites (Kelly, Kirshner & Pahre 2008; Prieto, Stanek & Beacom 2008; Arcavi et al. 2010; Modjaz et al. 2010 but see Anderson et al. 2010). These results indicate that progenitor age, mass and/or metallicity drive the observed optical spectroscopic diversity seen for SNe Ibc, namely the presence/strength of the He I features. Furthermore, the discovery that some SNe Ic produce relativistic outflows that give rise to long-duration gamma-ray bursts (GRBs) points to a unique progenitor channel for a small fraction of these events (see Woosley & Bloom 2006 for a review). These relativistic outflows are powered by an additional energy source, a central engine, commonly thought to be a rapidly rotating and accreting compact object (MacFadyen, Woosley & Heger, 2001) or a magnetar (Thompson, Chang & Quataert, 2004). We refer to these explosions as “engine-driven”.
In this paper we search for additional progenitor clues based on the optical light curves of SNe Ibc. Free from the massive envelopes and/or circumstellar shells associated with other core-collapse explosions, the photospheric emission of “naked” SNe Ibc is powered by the radioactive decay of freshly synthesized 56Ni. This optical signal reaches maximum intensity within a month of the explosion, producing parabola-shaped light curves that resemble those of SNe Ia. In the simple picture, three physical parameters determine the shape of the light curves and peak luminosity: the mass of newly synthesized 56Ni (), the total ejecta mass (), and the kinetic energy of the explosion (; see Arnett 1982). In addition, spectroscopic measurements of the photospheric velocity, ,directly constrain the quantity, . Since the explosion parameters are imprinted on the optical emission, their detailed study can reveal clues as to the properties and diversity within the progenitor channel(s).
Literature studies of the photospheric emission from SNe Ibc are relatively few (Richardson, Branch & Baron, 2006) and tend to focus on detailed photometric and/or spectroscopic observations of single explosions. These studies often target those SNe Ibc with extreme properties, such as the 5-10% of the population showing evidence for unusually broad absorption features (“broad-lined”, BL; Podsiadlowski et al. 2004) and photospheric velocities of (e.g., SN 2003jd, Valenti et al. 2008). Such events are spectroscopically similar to GRB-SNe. Preliminary comparisons of the optical luminosities of ordinary SNe Ibc and GRB-SNe revealed overlap between the two samples, with GRB-SNe populating the upper end of the SN luminosity distribution (Soderberg et al., 2006; Woosley & Bloom, 2006; Richardson, 2009). However, a more comprehensive and uniform sample of ordinary SNe Ibc is required for a robust comparison.
More recently, a set of two dozen unfiltered light curves for SNe Ibc was reported by the Lick Observatory Supernova Search (LOSS) within an estimated completeness limit of Mpc (Li et al., 2010). The LOSS light curves reveal an overall dispersion in decay rate and peak magnitude with some evidence that SNe Ib are more luminous than SNe Ic. However, due to the lack of photometric color information and often poor light curve coverage of the LOSS SNe Ibc, a robust and systematic study of their multi-band light curves and host galaxy extinction-corrected peak luminosities, and an extraction of their explosion parameters remain outstanding projects.
Motivated thus, between 2004 and 2007 we conducted a dedicated optical monitoring campaign of nearby SNe Ibc with the robotic Palomar 60-inch telescope (P60; Cenko et al. 2006). The primary goal of this effort was to observationally constrain the physical parameters of the explosion (, , and ). In this paper we present the P60 light curves for a sample of SNe Ibc, representing the first uniform and systematic multi-band study to date. We present a novel approach to correct the light curves for (often significant) host galaxy extinction. We compare the observed light curve properties to those of SNe Ibc compiled from the literature and engine-driven SNe within the same volume, and we derive the physical parameters for the extended sample using a systematic modeling approach. The parameters are compared for SNe Ib, Ic and SNe Ic-BL with the goal of shedding light on the progenitor channels. Finally, we provide our SNe Ibc light curves and light curve templates to the community to facilitate on-going and future efforts to distinguish between SNe Ia and SN Ibc at larger distances and/or without spectroscopic diagnostics.
2. Observations and Photometry
We used the robotic Palomar 60-inch telescope (P60; Cenko et al. 2006) to obtain multi-epoch, multi-band optical observations for our SN follow-up campaign. P60 is a queue-scheduled facility dedicated to rapid-response and monitoring observations of optical transients. We selected targets for our study from the sample of local ( Mpc) SN discoveries publicly announced via the on-line circulars, including the International Astronomical Union Circulars (IAUC), Central Bureau for Electronic Telegrams (CBET), and the Astronomers Telegram (ATEL) between Fall 2004 and Spring 2007. We note that the majority of these SNe were discovered by SN searches that target the most luminous (and likely metal-rich) nearby galaxies (e.g., LOSS).
Here we present the P60 data from our campaign for all 25 SNe spectroscopically classified and reported in the on-line circulars as Type Ib (11 events) and Ic (11 events) and Ic-BL (3 events) for which we were able to obtain at least eight photometric measurements. We note that two SNe Ib in our sample subsequently developed hydrogen features prompting their re-classification as Type IIb and we include them here given their connection to the Type Ib class (e.g, Chevalier & Soderberg 2010).
The majority of the SNe in this sample (15 of the 25) were observed between Fall 2005 and Spring 2007 (see Soderberg 2007). An additional 10 SNe were observed as part of the Caltech Core-Collapse supernova Program (CCCP; Gal-Yam et al. 2007) which carried out photometric and spectroscopic follow-up of all young ( d since explosion) and nearby ( Mpc) SNe of Types Ibc or II between July 2004 and Sep 2005. We note that the CCCP data for the peculiar, Ca-rich SN 2005E were reported separately by Perets et al. (2010) and so we do not include them here.
The properties of each SN in our sample are summarized in Table LABEL:tab:list, including spectroscopic classification, host galaxy distance, and Galactic extinction (Schlegel, Finkbeiner & Davis, 1998). For SNe with conflicting classification reports, we adopt the latest classification since He I absorption features often become more prominent with age (e.g., SN 1999ex; Hamuy et al. 2002). We adopt host galaxy distances from the NASA/IPAC Extragalactic Database of cosmology independent distances (NED-D222http://nedwww.ipac.caltech.edu/Library/Distances/) when available. For the remaining objects we adopt the NED distances after correction for Virgo, Great Attractor, and Shapley Supercluster Infall and assuming km s-1 Mpc-1 (Mould et al., 2000).
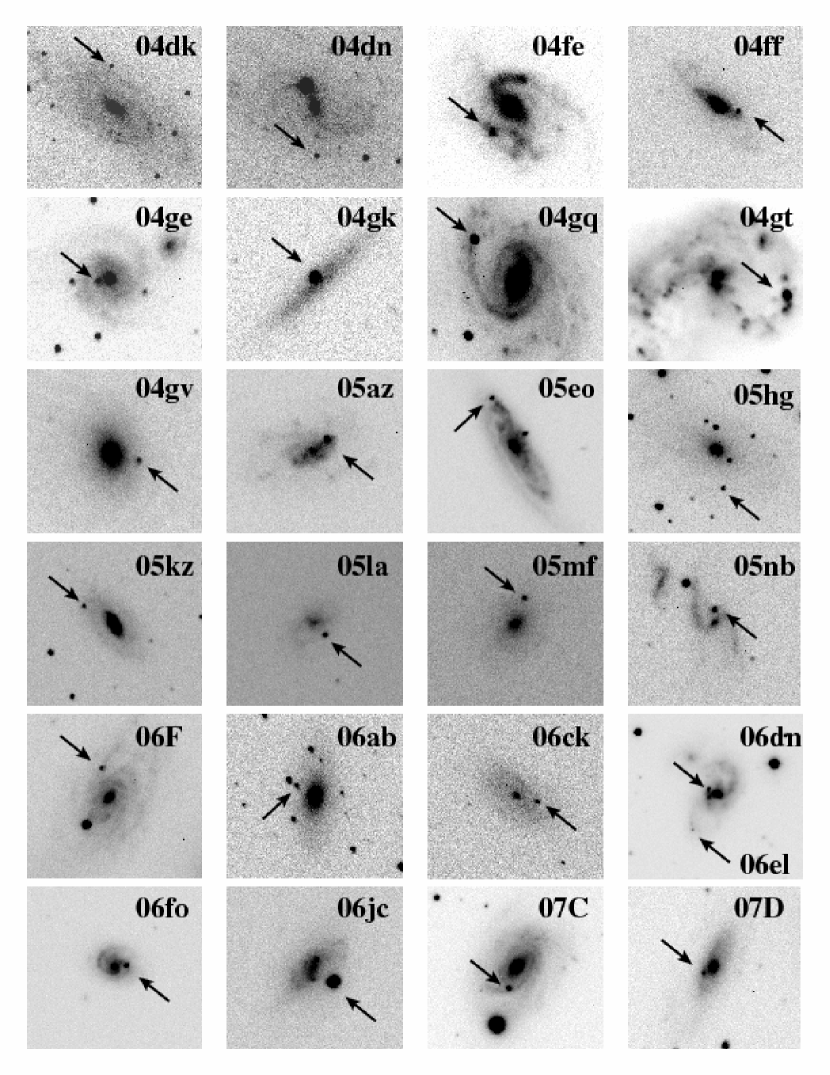
For each newly discovered SN accessible to P60, we promptly initiated nightly photometric follow-up in the Johnson and bands. The sensitivity functions of these filters are described and displayed in Cenko et al. (2006). Our monitoring campaign was optimized for a cadence of day, with observations typically extending for several months after discovery. All P60 images were reduced in IRAF333IRAF is distributed by the National Optical Astronomy Observatory, which is operated by the Association for Research in Astronomy, Inc., under cooperative agreement with the National Science Foundation. using a custom real-time reduction pipeline (Cenko et al., 2006). In Figure 1 we display a montage of the region around each SN as observed with P60.
We used PSF photometry to extract the relative magnitudes of the SNe with respect to several stars within the full P60 field-of-view444We compare our PSF photometry light curves for SNe 2004dk and 2004dn with those produced after digitally subtracting the host galaxy emission using the Common PSF Method and find them to be comparable (Gal-Yam et al., in prep). Absolute calibration of the relative light curves was performed using a combination of P60 observations of Landolt standard fields and SDSS photometry of field stars. We used the Smith et al. (2002) transformations to convert the SDSS ugriz photometry of field stars to the and bands.
The P60 photometry for all 25 SNe is available in Table 2 (machine-readable) and are characterized by typical uncertainties of to 0.05 mag per epoch. We supplemented our photometry with measurements from the literature, primarily drawn from the initial discovery circulars, thereby providing early-time and often pre-discovery flux measurements including upper limits (see Table LABEL:tab:list for references). In this compilation, we have assumed that unfiltered magnitudes from the circulars are roughly equivalent to band measurements and assign to the detections an uncertainty of mag. In cases where extensive photometry is available from the literature, we find that our photometry is fully consistent (i.e., SN 2006jc, Pastorello et al. 2007; SN 2005la, Pastorello et al. 2008)
2.1. Sample Definitions
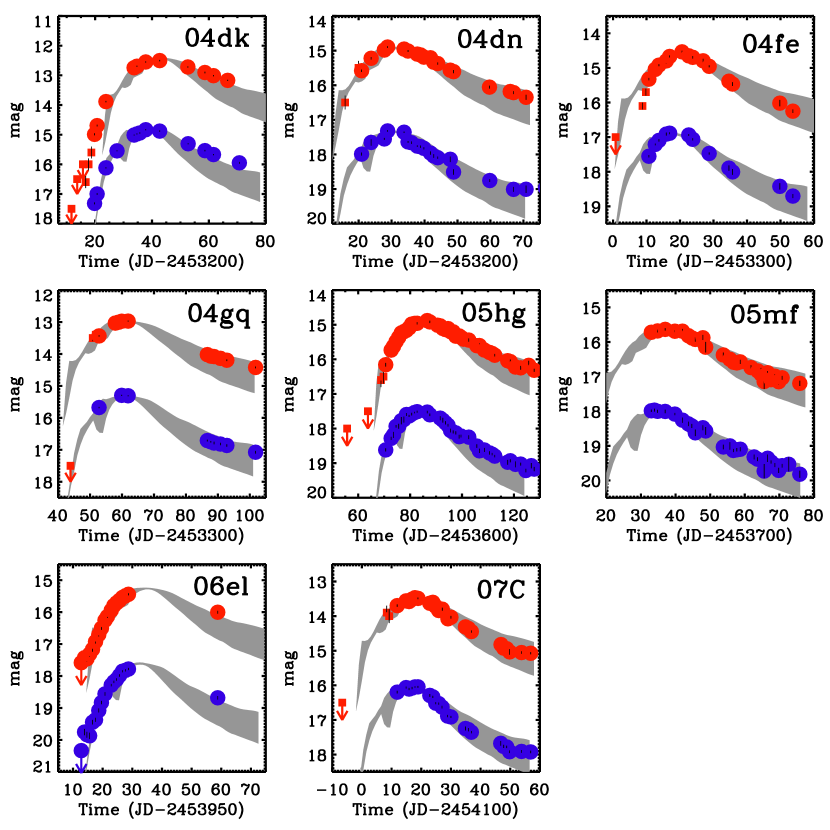
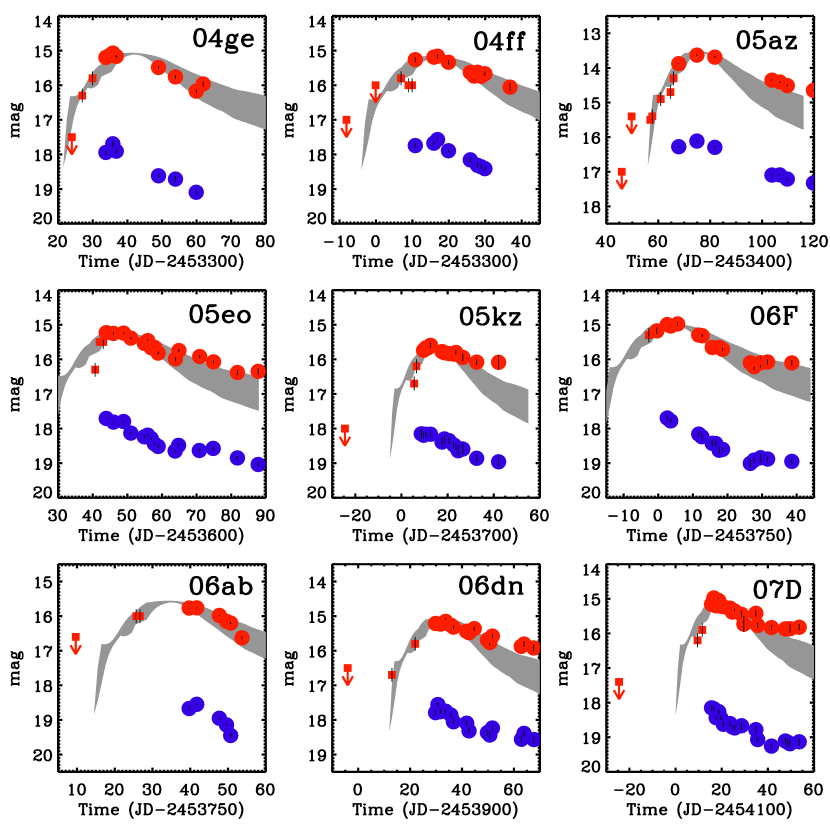
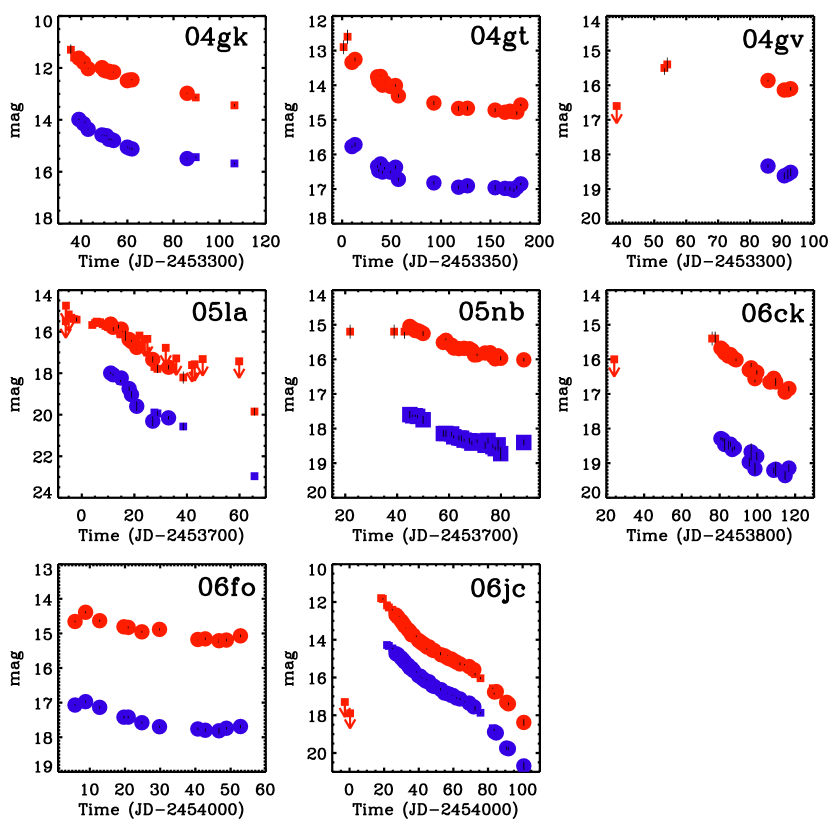
Our SN Ibc light curves can be divided into three groups, based on constraints on the epoch and apparent magnitude of the light curve maxima. For the eight SNe in the Gold group, our P60 observations covered the light curve maximum in both and band (Figure 2). These data alone nearly double the existing sample of well-studied SNe Ibc light curves available in the literature. The Silver group is composed of nine SNe for which the band light curve maximum is observationally constrained through a combination of P60 monitoring and literature measurements (Figure 3). Finally, there are eight SNe in our Bronze group, for which the epoch and magnitude of the light curve maximum is poorly constrained in both bands (Figure 4). As shown in Figures 2-4, the light curve shapes are diverse.
3. Observed Light Curve Properties
The shape of the SN Ibc light curves is fully determined by the three explosion parameters, , , and (e.g., Arnett 1982). Specifically, the peak optical luminosity, , scales with the mass of 56Ni as . Here, is the characteristic time or width of the light curve and our notation refers to a normalization of by erg and of by (Iwamoto et al., 2003). light curves with larger values have correspondingly slower post-maximum decay rates. Therefore, while is primarily determined by the fractional mass of 56Ni, the width of the light curve (and, in turn, the decay rate) is determined by and . In our study of SNe Ibc light curves we therefore focus on their two main observable properties, namely their peak absolute magnitudes and post-maximum decay rates. To enable a systematic comparison of these observables, we first define a procedure and apply it to an existing set of well-studied SNe Ibc available in the literature.
3.1. The Sample of Literature SNe
We compiled and band photometry for the existing sample of well-studied SNe Ibc within a similar distance of Mpc that are available in the literature.555We note that with this selection criteria, we exclude the rare, overluminous SNe Ibc detected in magnitude-limited surveys, e.g., SN 2007bi (Gal-Yam et al., 2009) and SN 2005ap (Quimby et al., 2009). Our selection criteria required the light curve maxima to be well-sampled and the total extinction to have been estimated using the equivalent width of the Na I D lines and/or fitting of the broadband photometric spectrum. After excluding the SNe associated with GRBs (SN 1998bw, Galama et al. 1998; SN 2006aj, Pian et al. 2006) and the notably peculiar events (i.e., the Ca-rich SN 2005E; Perets et al. 2010, the double-peaked SN 2005bf; Folatelli et al. 2006, and the SNe Ibn 2006jc and 2005la; Foley et al. 2007; Pastorello et al. 2007, 2008), we construct a sample of 10 SNe Ibc: 1994I, 1999ex, 2002ap, 2003jd, 2004aw, 2007Y, 2007gr, 2007ru, 2008D, and 2008ax. In Table 3 we compile the basic properties of this literature sample including the SN Type, the Galactic extinction (from Schlegel, Finkbeiner & Davis 1998), and the host galaxy name, distance estimate, and inclination. In line with the P60 sample, we adopt up to date NED-D host galaxy distances for the literature sample when available. In Table 4 we further list the epoch and apparent magnitude of the and band light curve maxima. For three of the literature SNe, the published light curves were obtained in the SDSS -band filter, and we converted these to -band using the transformations of Smith et al. (2002). These are noted in Table 3. We note that more detailed transformations (e.g., S corrections; Stritzinger et al. 2002) are outside the scope of this paper, and thus the derived band photometry for these three SNe may include a small systematic uncertainty.
After correcting the light curves for the typically low Galactic extinction ( mag), we derive peak absolute magnitudes in the and bands and find that they span magnitudes. This has been noted previously based on similar samples of SNe Ibc drawn from the literature (Richardson, Branch & Baron, 2006; Soderberg et al., 2006). In the band, the range extends from to mag. Dividing the sample into SNe Ib, Ic, and Ic-BL (4, 3, and 3 SNe, respectively) we calculate mean values of mag (Ib), mag (Ic), and mag (Ic-BL).
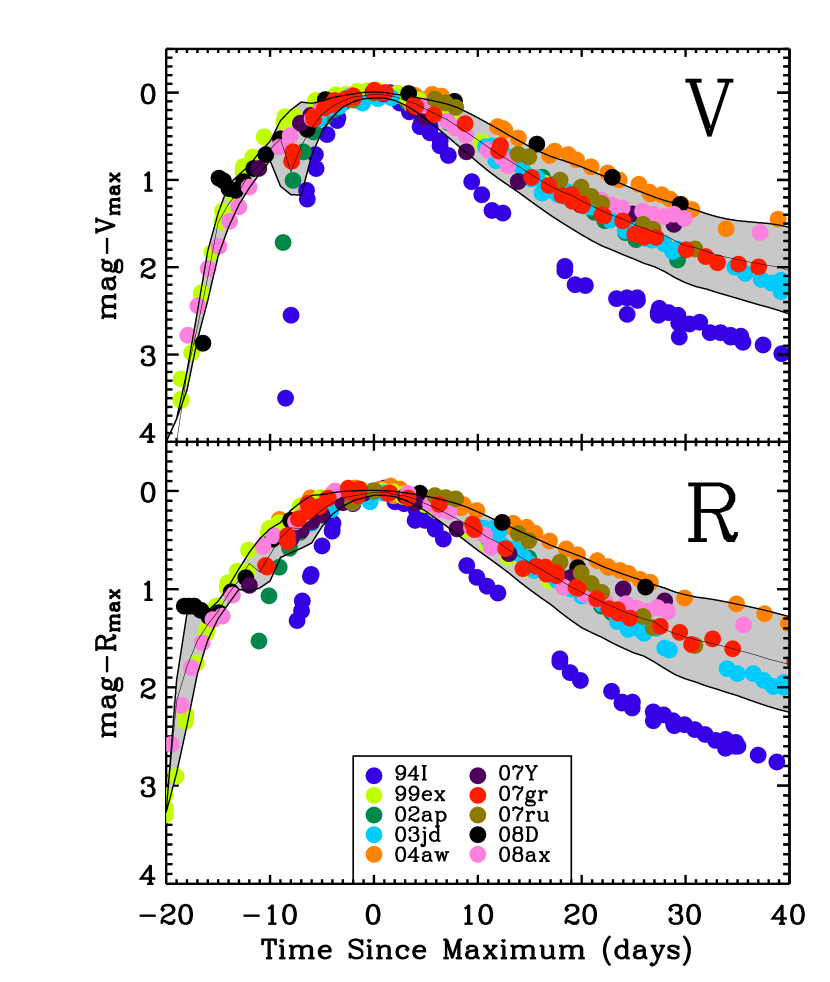
We next compare the light curve shapes of the literature sample after shifting each curve relative to the epoch and magnitude of maximum light (Figure 5). This figure highlights the significant dispersion in the light curve widths (see also Clocchiatti & Wheeler 1997a,Clocchiatti & Wheeler 1997b). We build template light curves in the and bands by interpolating over these normalized light curves and extracting the weighted mean flux density for time intervals spanning to days with respect to the epoch of maximum light. The uncertainties in the resulting templates are derived from the standard deviation in the interpolated curves at each time interval and represent the intrinsic dispersion in light curve widths. Our resulting template curves are shown in Figure 5.
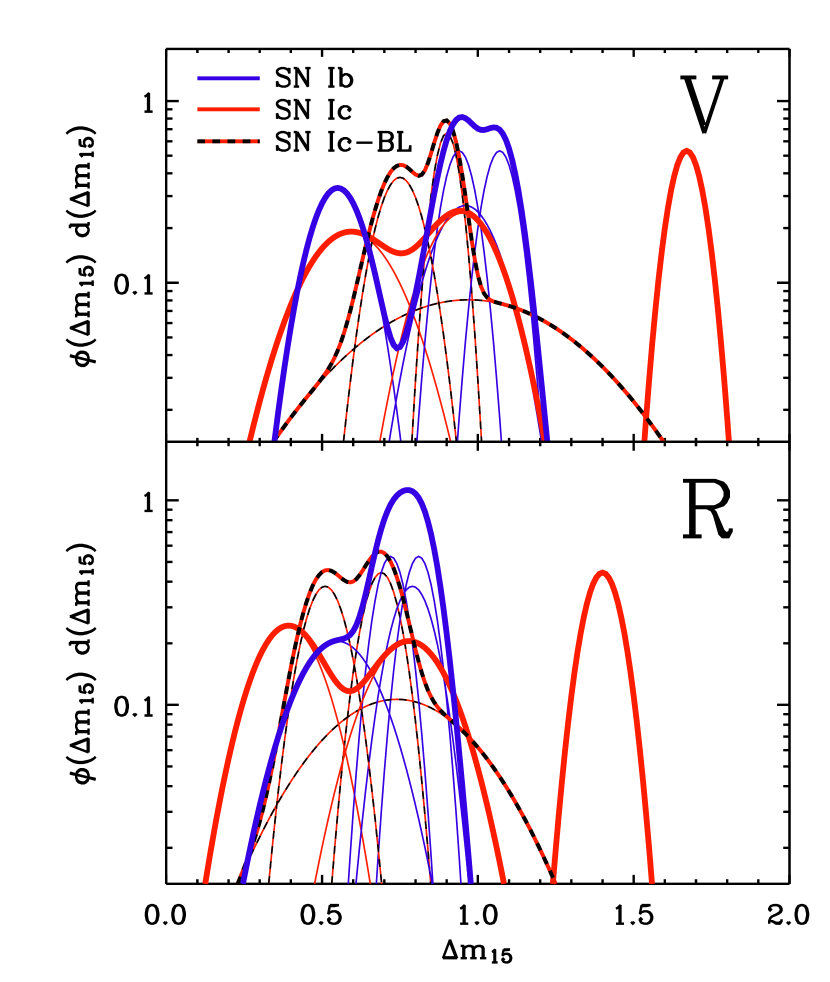
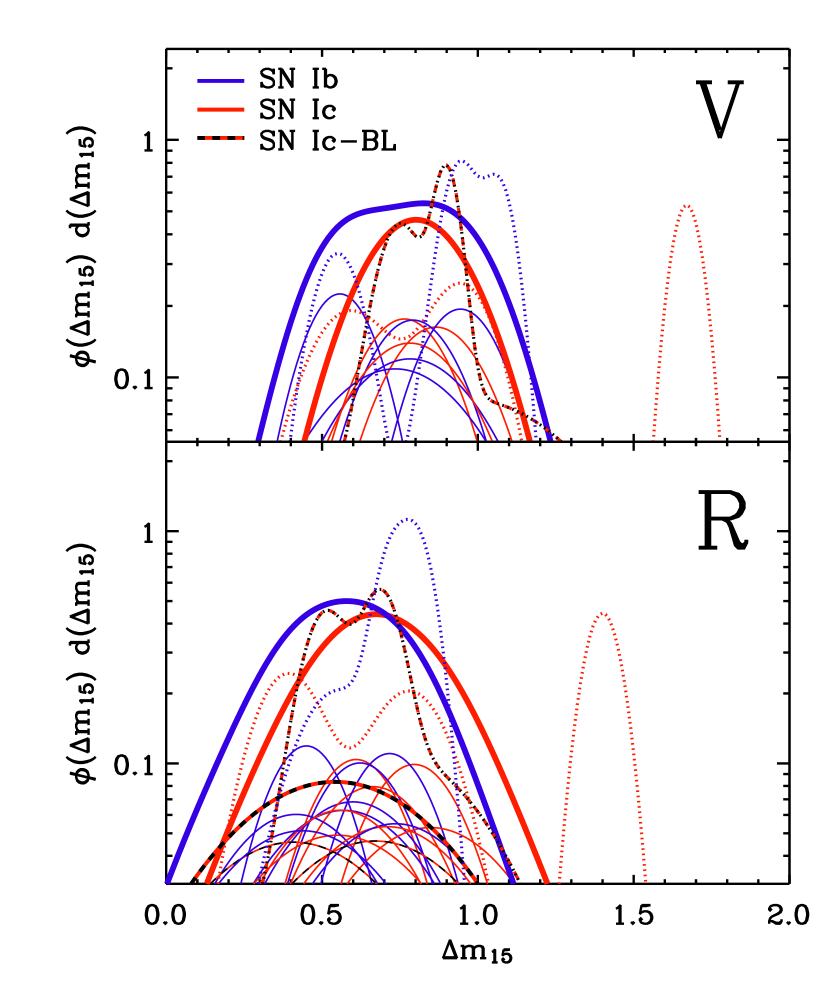
We measure the post-maximum decay rate for each of the literature SNe using the diagnostic which represents the decay in magnitudes during the 15 days following the light curve maximum (Phillips, 1993). By interpolating over the well-sampled and band light curves, we derive and estimates, respectively (Table 4). We note that this is a variation on the standard definition for which assumes a time baseline relative to the band light curve maximum. As shown in Figure 6, the literature sample reveals a broad dispersion in with mean values of mag and mag. Thus, the band light curves decay more slowly than those in the band.
After dividing the literature sample into the SN sub-classes, we find that the values are statistically consistent: mag (Ib), mag (Ic), and mag (Ic-BL). We also note that the fast-fading Type Ic SN 1994I is a outlier of the overall SN Ibc distribution.
3.2. The Sample of P60 SNe
Since the light curves for some of the SNe in our P60 sample are not as densely sampled as those of the literature sample, we use the and band template light curves described above to fit the epoch and magnitude of the light curve maxima for all Gold and Silver P60 SNe. We use a minimization technique for the template fitting analysis and extract typical uncertainties on the epoch and apparent magnitude at maximum of about () d and () mag, respectively for the Gold (Silver) SNe. For the Silver SNe, we fit only the band light curves since the band data are insufficient to estimate the parameters of the light curve maxima. The Gold and Silver P60 light curves are compared with the individual template fits in Figures 2 and 3, respectively, and the estimated epoch and magnitude of maximum light for our sample are listed in Table 5. The Bronze sample do not have sufficient early data to reasonably constrain the epoch and magnitude of the light curve peak through template fitting.
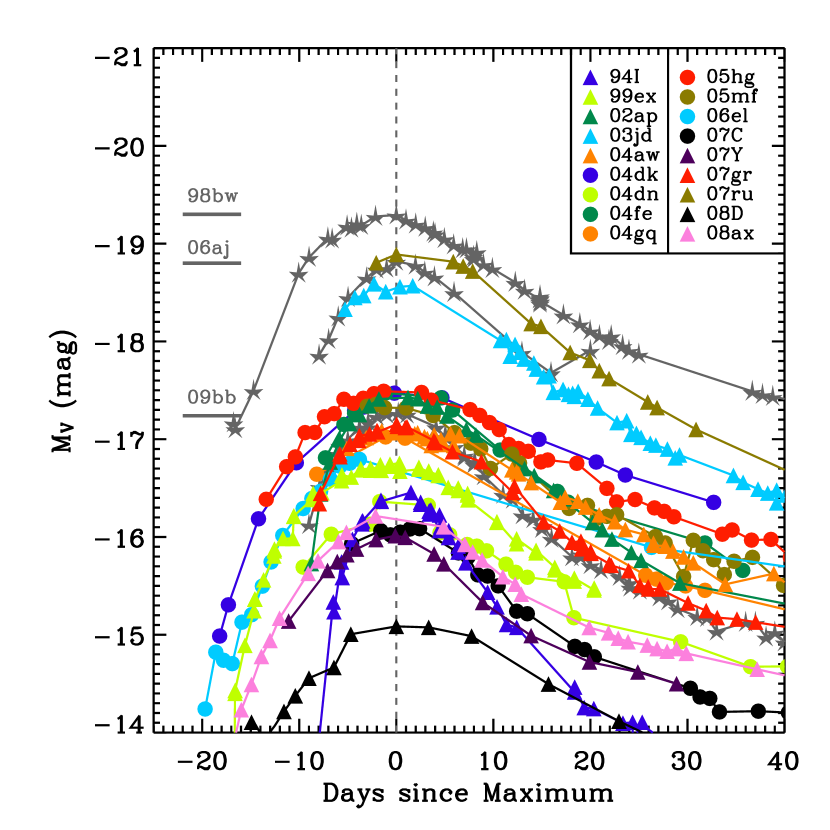
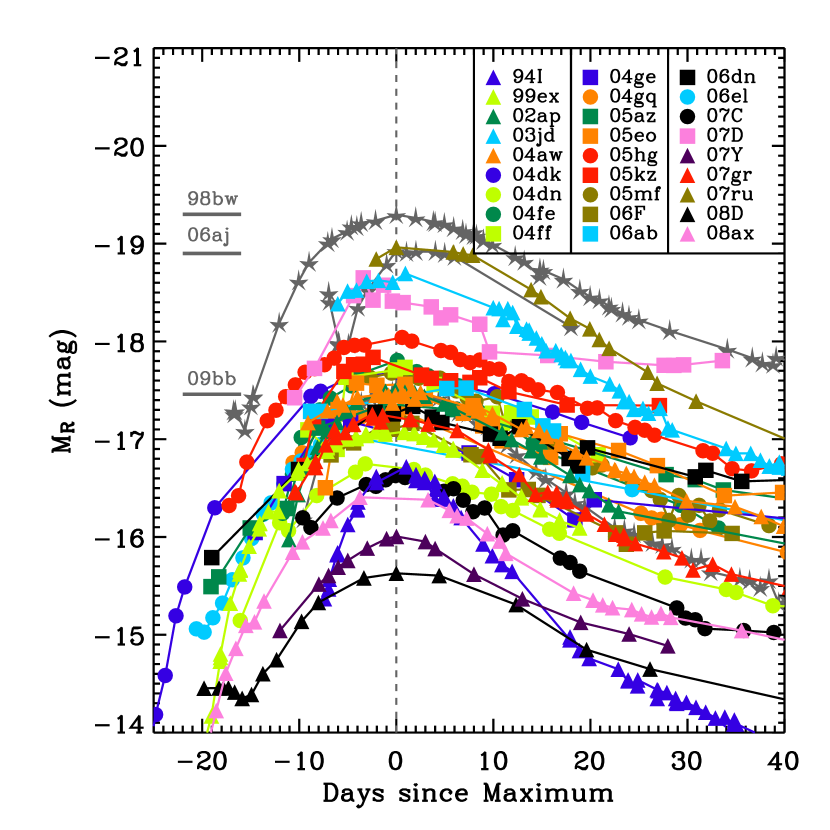
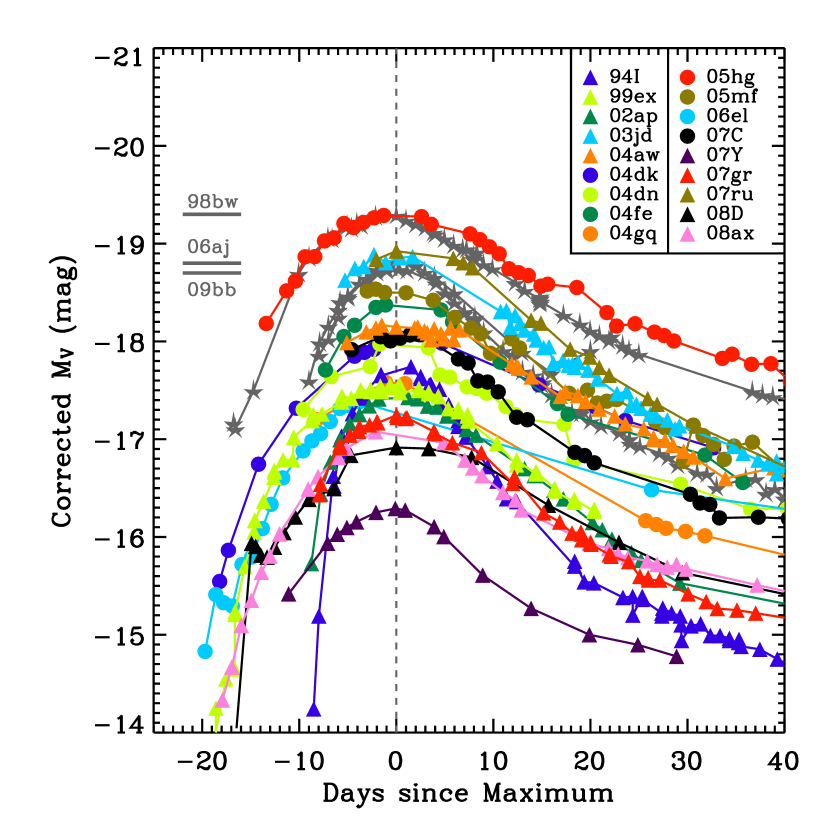
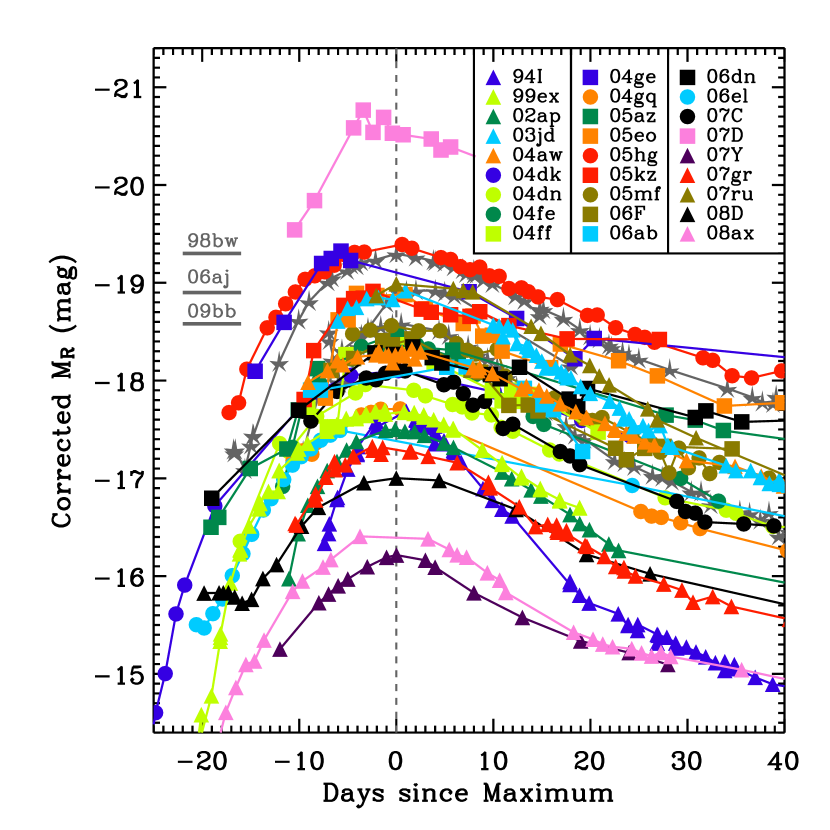
In Figures 7 and 8 we display the absolute magnitude light curves for the P60 Gold and Silver samples after shifting them to the epoch of maximum light and correcting for Galactic extinction ( mag for the P60 sample). Similar to the case of the literature sample, we find a broad distribution in and values that span magnitudes. Dividing the Gold and Silver samples into the SNe Ib, Ic, and Ic-BL (8, 7, and 2 SNe, respectively), we report mean values of mag (Ib), mag (Ic), and mag (Ic-BL). These values are overall consistent with those of the literature sample.
Adopting the fitted parameters for the light curve maxima, we next extract and values for our Gold and Silver SNe following the same procedure adopted for the literature sample (§3.1). In Table 5 we list the resulting values for the and bands, and in Figure 9 we compare their distributions with those from the literature sample. We find mean values of mag and mag, somewhat lower than those derived for the literature sample but consistent within the uncertainties. Similar to the case of the literature sample, we find no evidence for a statistically significant difference between the decay rates of the SNe sub-classes.
Finally, we comment on the rise time of the SNe Ibc in this sample, i.e. the time interval between the epoch of first detection and the epoch of maximum light. As shown in Figures 7 and 8, SNe Ibc with broader light curves tend to have correspondingly longer rise times. We find that several SNe in this P60 sample have band rise times exceeding 20 days and thus are comparable (even longer) than those observed for SNe Ia (Conley et al., 2006; Hayden et al., 2010). This study emphasizes the dispersion in rise times of SNe Ibc light curves through dense, multi-band photometry of young explosions.
3.3. The Combined Sample
By combining the Gold and Silver P60 samples with the literature sample, we derive mean values for the peak absolute magnitudes and light curve decline rates for a larger sample of SNe Ibc to search for statistical differences. Correcting for Galactic extinction only, we find mag and mag. For comparison, Li et al. (2010) recently reported that the typical unfiltered peak absolute magnitudes for SNe Ibc within Mpc are mag. Restricting our sample to this same distance, we find a slightly higher value of mag in the band, although we note that these values are consistent within the uncertainties.
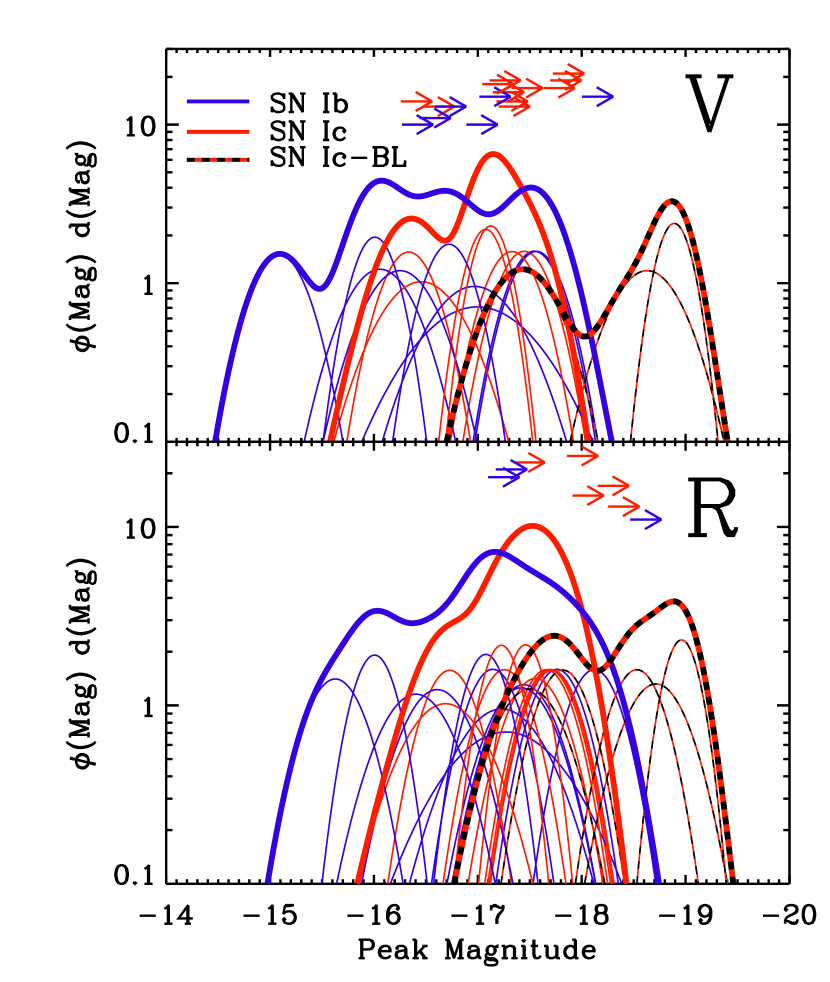
Dividing our extended sample into the three spectroscopic sub-classes (12 Ib, 10 Ic, and 5 Ic-BL), we report mean peak magnitudes with higher statistical confidence: mag (Ib), mag (Ic), and mag (Ic-BL). This is in contrast to the report of Li et al. (2010) that SNe Ib are marginally brighter than SNe Ic; we attribute this apparent difference to small number statistics. While the light curve maxima for our sample of Bronze SNe are not well constrained, we are able to place strict lower limits on the peak absolute magnitudes by adopting the brightest data point the and bands and correcting for Galactic extinction. These lower limits range from to mag and to mag. In Figure 10 we present the differential distribution of peak absolute magnitudes for our combined sample, including the lower limits derived for the Bronze P60 SNe.
We next calculate mean decay rates for the combined sample of mag and mag. Dividing into the sub-classes, we find mag (Ib), mag (Ic), and mag (Ic-BL). A Kolmogorov-Smirnov (K-S) test on these distributions reveals an 89% probability that SNe Ib and Ic are drawn from the same population, and the probability that SNe Ic and Ic-BL are the same is 86%. Summing the SNe Ib and Ic distributions together, a K-S test reveals a 91% probability that SNe Ic-BL are drawn from the ordinary SNe Ibc sample. This study demonstrates that the post-maximum decay rate of SN Ibc optical light curves cannot be used to distinguish between SNe Ib, Ic, and Ic-BL.
4. Host Galaxy Extinction Corrections
In §3.3 we report the peak absolute magnitudes for our combined sample of SNe Ibc light curves after a typically small correction for Galactic extinction. However, SNe Ibc are known to reside in dusty star-forming regions (van Dyk, Hamuy & Filippenko, 1996; Kelly, Kirshner & Pahre, 2008), and thus extinction within the host galaxy likely dominates the total line-of-sight extinction.
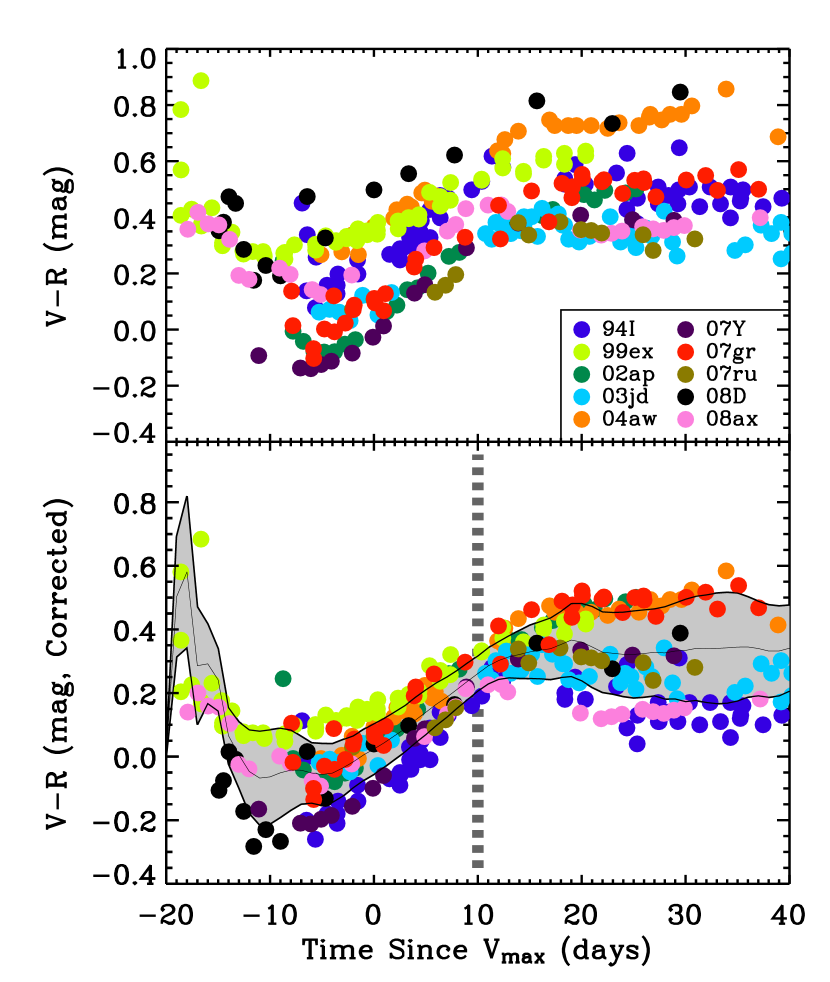
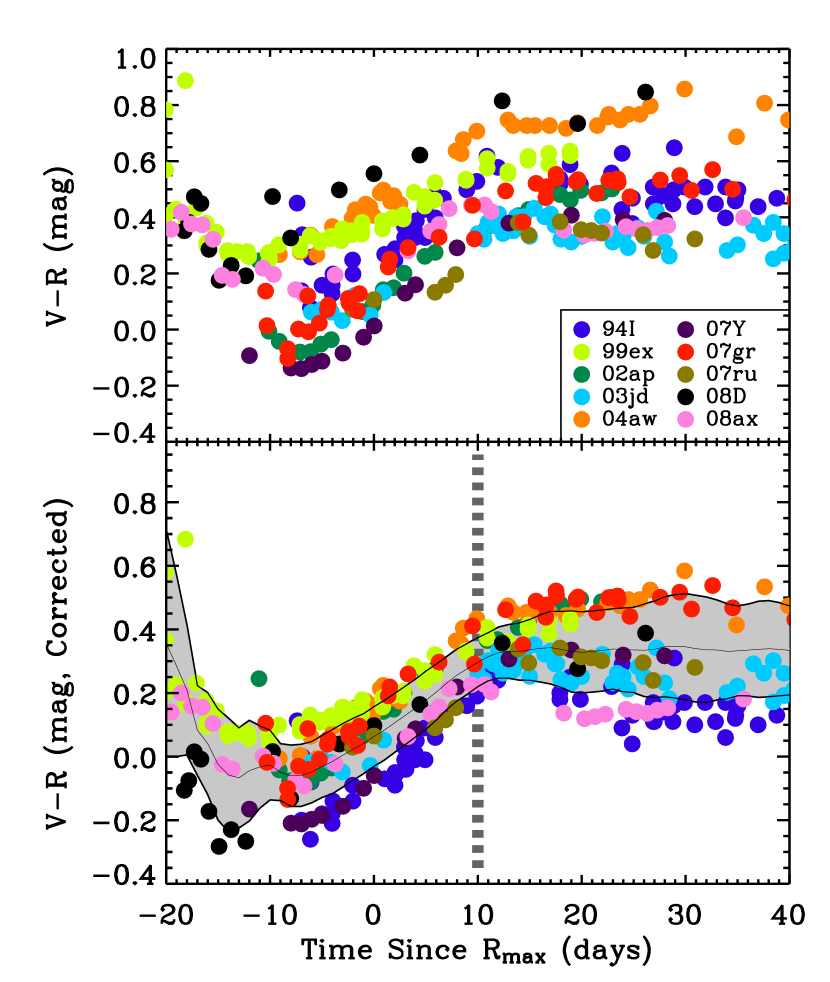
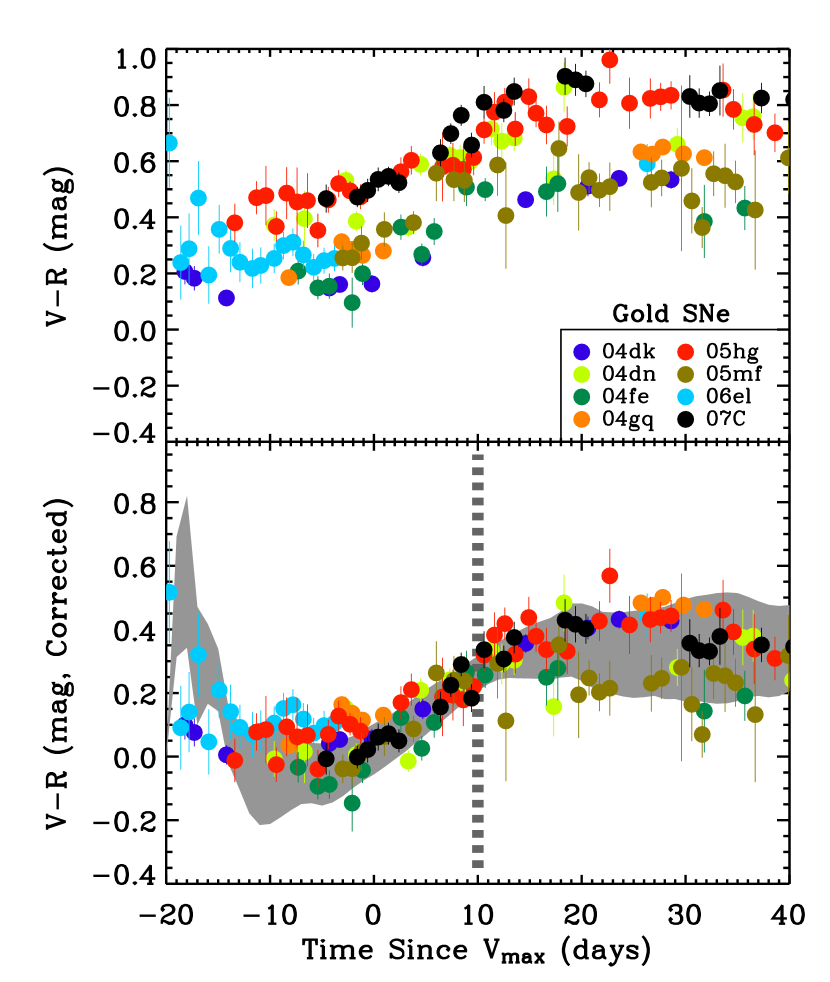
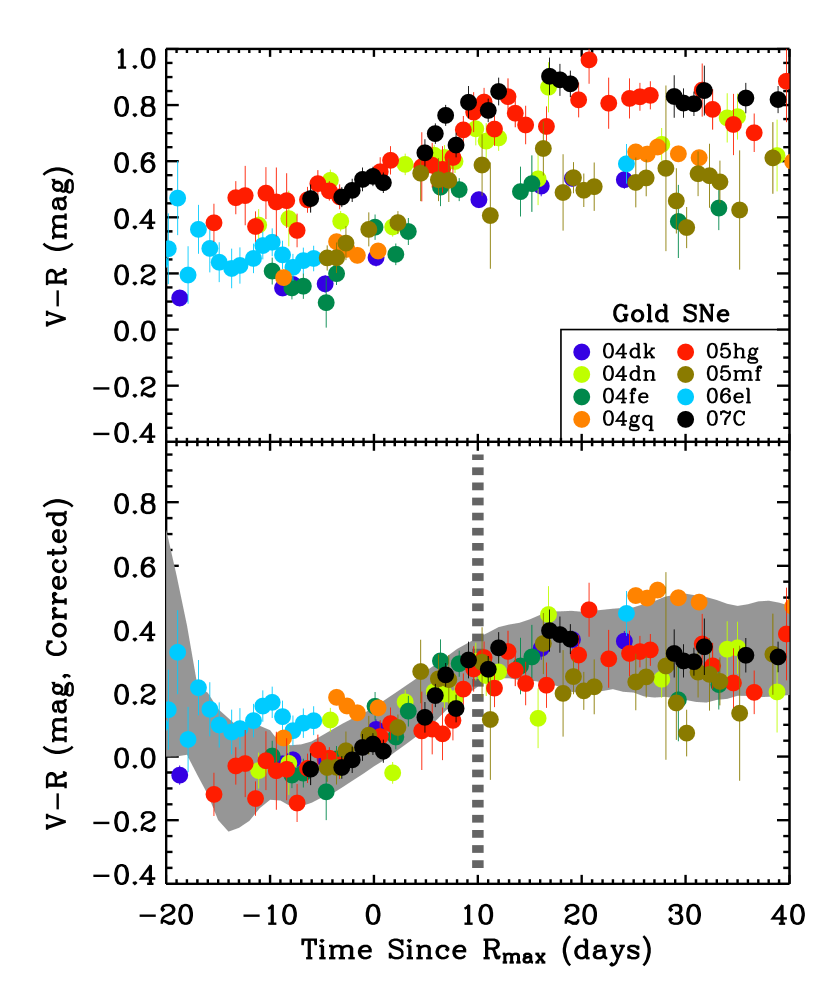
Motivated by the well-studied Lira relation observed for SNe Ia (Phillips et al., 1999), we investigate whether the color evolution of SN Ibc may be used to infer the total line-of-sight extinction. To this end, we construct color curves for the literature sample and compare their temporal evolution with respect to the epoch of and band light curve maxima. In Figures 11 and 12 (top panels), we display the color curves after correcting only for Galactic extinction. All of these SNe show a clear trend of increasing color beginning week prior to maximum light, however, there is a broad dispersion in the colors at any single epoch.
For each of these literature sample SNe, host galaxy extinction estimates, , are available based on the equivalent width of the Na I D lines and/or fitting of the spectral energy distribution (Table 4). The respective authors assume an Milky Way extinction law for the host galaxy in every case. A comparison of and values for each SN reveals that host galaxy extinction is (nearly) always dominant. Indeed, we find a mean host galaxy extinction of mag for the literature sample, a factor of higher than the average Galactic extinction for these same SNe.
By summing the Galactic contribution with the host galaxy extinction estimates, we correct the color curves for the total line-of-sight extinction666We do not include a correction to the values since (i) the SNe all reside in the local Universe, and (ii) the uncertainties in the host galaxy extinction values are often significant. As shown in Figures 11 and 12 (bottom panels), the dispersion in the resulting color curves is significantly decreased after correcting for host galaxy extinction. We construct extinction-corrected template color curves over timescales spanning to days since light curve maxima in both the and bands by extracting the mean and standard deviation of the color at each epoch. As shown in the Figures, the dispersion in the template curves is minimized at roughly d after the and band light curve maxima.
Interpolating the color curves to d after maximum, we estimate mean values of mag mag and a full range extending from to 0.34 mag and to 0.44 mag. We conclude that the color evolution observed for SNe Ibc can be exploited as a useful diagnostic for estimating their host galaxy extinction.
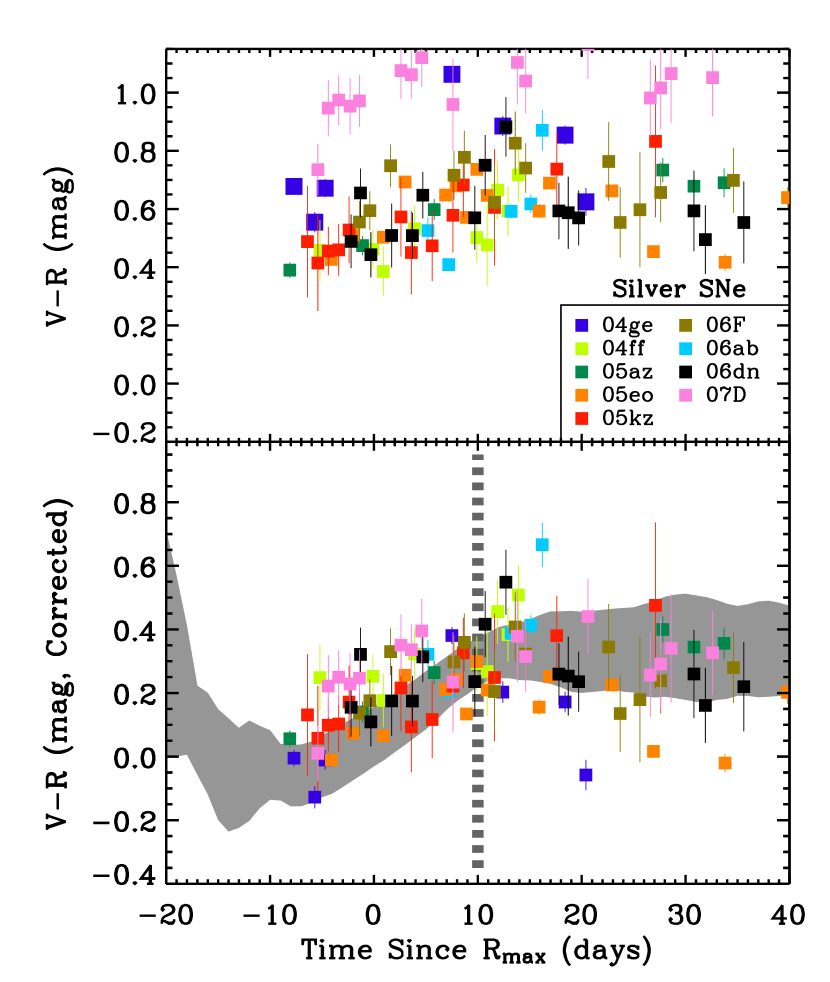
We adopted these extinction-corrected mean colors and their associated dispersions at d as template values and used them to infer the total host galaxy extinction for our P60 sample. To this end, we first constructed color curves for the P60 sample and corrected each for Galactic extinction (see Table LABEL:tab:list). We interpolated over the P60 color curves to estimate the respective values of and for all Gold SNe and for all Silver SNe. By attributing any residual color excess over the template values to host galaxy extinction, we derived estimates for each SN.
As shown in Figures 13-15, the extinction-corrected color curves for our P60 sample are generally consistent with the templates curves constructed from the literature sample. The host galaxy extinction values are listed in Table 5 where the associated uncertainties are dominated by the standard deviation of the template values at 10 days after and band maxima. To ensure consistency with the literature sample extinction estimates, we similarly adopted a Milky Way extinction law for the host galaxies.
We combine the values for the literature and P60 samples and report a mean extinction of mag. Dividing the sample into spectroscopic sub-classes, we find no evidence for a statistically significant difference in their host galaxy extinction values. A K-S test reveals that the probability that SNe Ib, Ic and Ic-BL are drawn from the same population of events is . Therefore, based on our compilation of and band light curves from the literature and our P60 study, we conclude that most SNe Ibc show evidence for significant host galaxy extinction. This is slightly higher than the extinction estimates for SNe IIP ( mag; Smartt et al. 2009) suggesting that SNe Ibc tend to be more embedded in the star-forming regions of their host galaxies than SNe IIP and consistent with the results of (Kelly, Kirshner & Pahre, 2008). Finally we note that this result is broadly consistent with the extinction estimates derived systematically from optical and near-IR afterglow studies of a sample of long-duration GRBs (Perley et al., 2009; Greiner et al., 2010).
4.1. Consistency with Independent Extinction Estimates
For the SNe from our sample with high estimates, we searched for an indication of high equivalent width Na I D absorption features which have been shown to correlate with total line-of-sight extinction (e.g., Munari & Zwitter 1997). Indeed, in the case of our highest extinction SNe, ( mag), strong Na I D features ( nm) at the redshift of the host galaxies were detected in the initial classification spectra: SNe 2004ge (Filippenko & Foley, 2004) and 2007D (Foley & Gal-Yam; private communication)777We caution, however, that the uncertainty in the extinction correction likely increases for the more highly extinguished SNe (e.g., Blondin et al. 2009). These independent extinction diagnostics support our photometry-based technique.
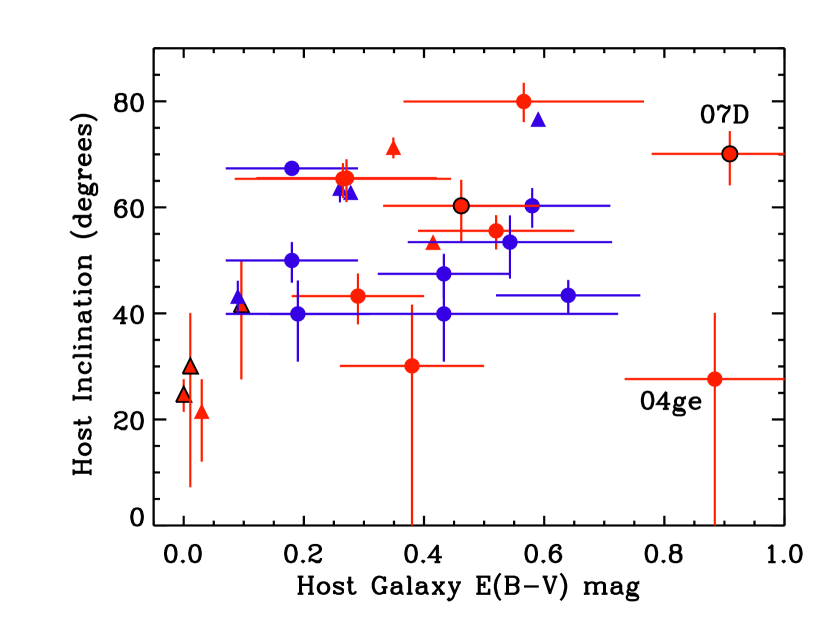
4.2. Host Galaxy Inclination
To investigate the proximity of the dust to the explosion site, we compare the host galaxy inclination and the values. We estimate the inclination for each host galaxy in the literature and P60 samples using the traditional formalism of Hubble (1926), adopting the major and minor host galaxy axes from de Vaucouleurs et al. (1991). In Figure 16 we compare the host inclinations with the derived values. A general trend is seen whereby the more heavily extinguished SNe reside within more highly inclined host galaxies. A similar result was recently reported by Li et al. (2010) based on the distribution of peak absolute magnitudes prior to host galaxy extinction corrections. We find evidence for a significant correlation (94% confidence level) between host inclination and extinction with a Spearman correlation coefficient of . As the Figure reveals, however, there is (at least) one notable exception to this trend, the highly extinguished Type Ic SN 2004ge and its nearly face-on galaxy, UGC 3555. There is also evidence that some SNe (e.g., Type Ibn) form significant dust through the dynamical interaction of the SN blastwave with the local environment (Smith, Foley & Filippenko, 2008). We conclude that dust within the host galaxy dominates the derived values for SNe Ibc, but local dust ( kpc) may contribute significantly in some cases.
5. Extinction Corrected Peak Luminosities
We next construct a sample of total extinction-corrected light curves by correcting for the values compiled in Tables 4 and 5. The corrected and band light curves are shown collectively in Figures 17 and 18. From this combined sample, we derive the mean, total extinction-corrected peak R-band magnitude of all SNe Ibc to be mag. Focusing on the SNe Ibc within Mpc, we find a value of mag. A direct comparison with the values discussed in §3.3 reveals the importance of including host galaxy extinction corrections in deriving the luminosity function for SNe Ibc (c.f., Li et al. 2010).
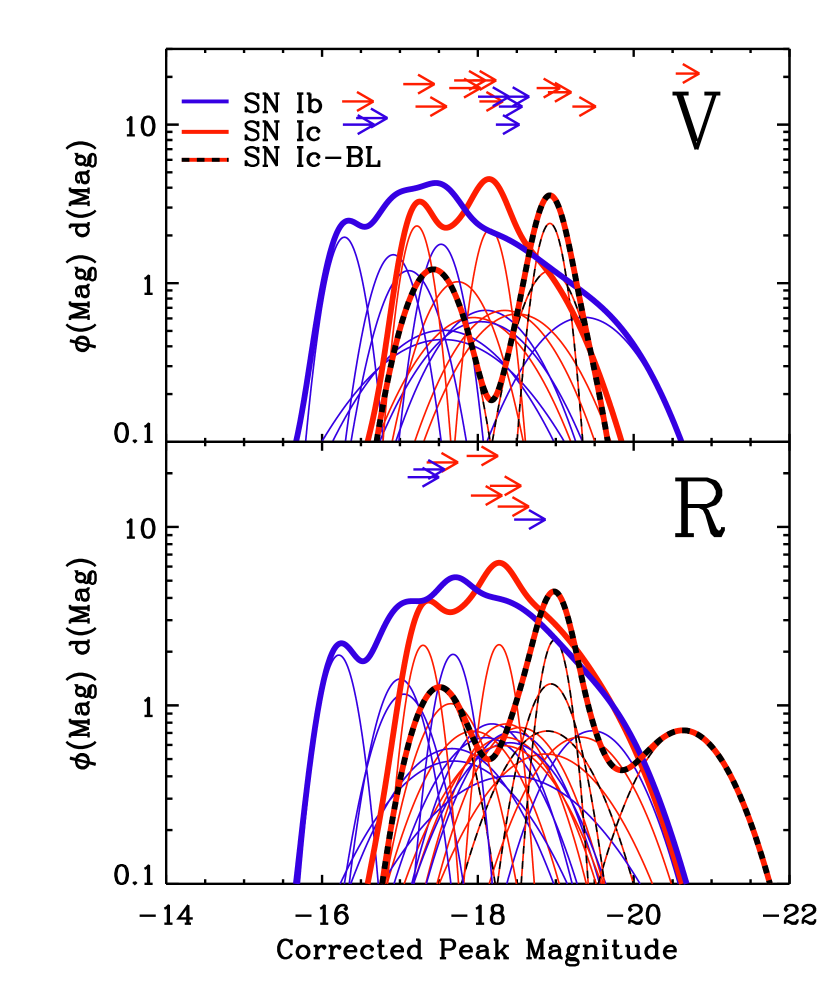
The differential distribution of corrected peak absolute magnitudes for the combined sample are shown in Figure 19. We note that the errors on these estimates are fairly large (e.g., mag) since we have properly accounted for the uncertainties in host galaxy distance, host galaxy extinction correction, and photometric measurement error. Dividing the sample into SNe Ib and ordinary SNe Ic, we find mag (Ib) and mag (Ic).
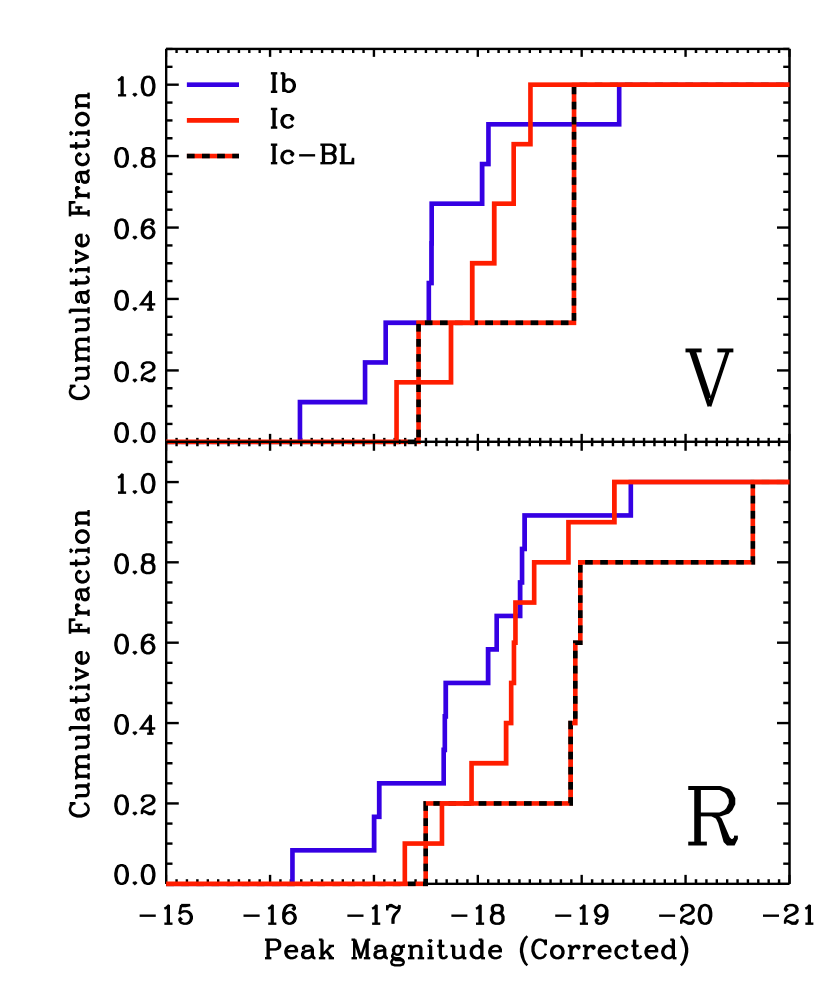
As shown in Figure 20, the cumulative distributions of total extinction-corrected values for SNe Ib and Ic indicate that they are similar; a K-S test reveals a 36% probability that these events are from the same parent population of explosions. Thus, we find no statistical evidence for a difference in the peak luminosities of He-rich and He-poor explosions. As discussed in §6, this suggests that SNe Ib and Ic synthesize a similar mass of 56Ni.
Separating out the broad-lined SNe Ic, we next compare their peak luminosities with ordinary SNe Ic and Ib. While the sample is small, a K-S test reveals only a 1.6% probability that they are drawn from the same population of explosions. We report a mean, total extinction corrected, peak absolute magnitude for SNe Ic-BL of mag, comparable to those of SNe Ia (Riess et al., 1999). We further note that none of these SNe show evidence for a central engine, which may be revealed through the detection of an associated GRB and/or strong non-thermal synchrotron emission (an afterglow) from a relativistic blastwave (see Soderberg et al. 2006 and references therein).
Our peak magnitudes are roughly consistent with the broad range of values reported by Richardson, Branch & Baron (2006) based on their compilation of SN Ibc light curves available in the literature. However, we do not confirm evidence for a bimodal distribution of peak absolute magnitudes and suggest that this may be due to a disproportionate representation of overluminous SNe in their literature compilation.
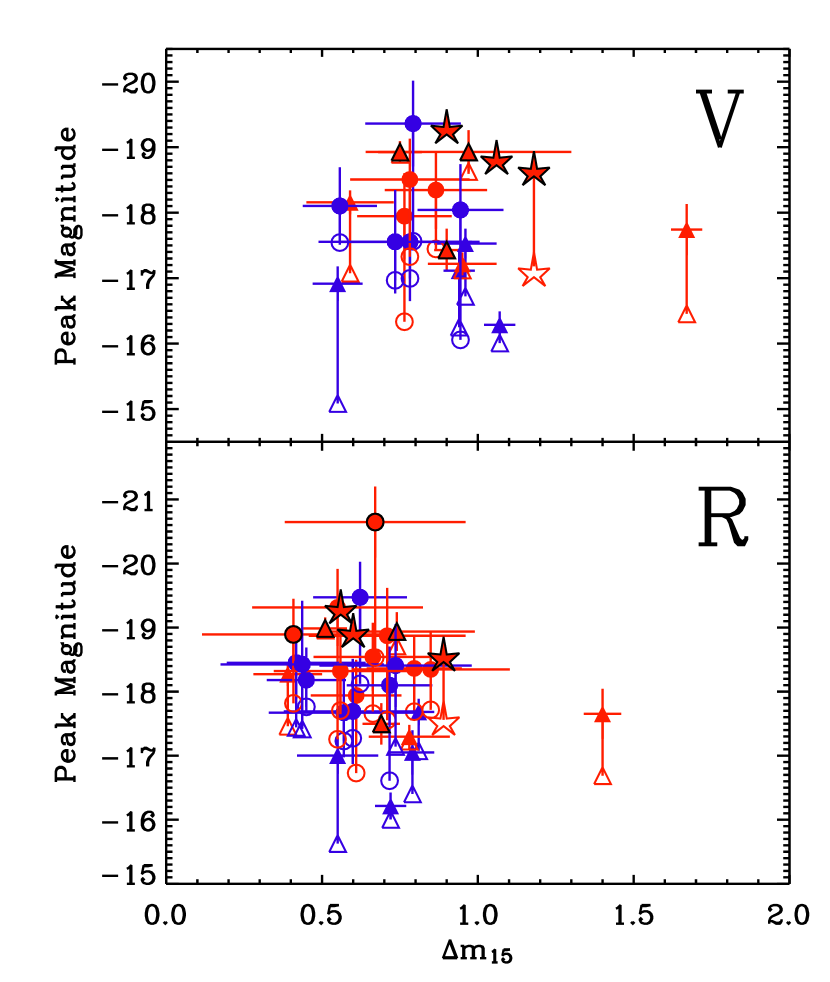
Finally, in Figure 21, we compare the peak absolute magnitudes in the and bands with their associated and estimates. In contrast to SNe Ia where is seen to correlate tightly with , we find no evidence for a “Phillips relation” in our sample of SNe Ibc. We calculate a Spearman correlation coefficient of with a confidence level of 23%. We therefore conclude that the decline rate of SNe Ibc light curves cannot be used as a reliable proxy for the peak absolute magnitude and discuss this point further in the context of analytical models in §6.
5.1. The Bronze Sample
We note that none of the SNe in our sample show unusual light curve shapes with the exception of two Bronze SNe, 2005la and 2006jc, whose unusual photometric and spectroscopic properties have already been discussed in detail in the literature (Foley et al., 2007; Pastorello et al., 2007, 2008). We consider the various effects plaguing the Bronze sample and leading to their poor light curve coverage. The Bronze SNe, on average, are not characterized by larger distances, higher values, or higher host galaxy inclinations than the other SNe in our sample. We also note that the Bronze group is not populated by intrinsically faint SNe since the lower limits on the peak absolute magnitudes imply mag (Figure 19). We conclude that the lack of early-time data for the Bronze sample is related to the insufficient cadence of many SN discovery surveys, which determines the epoch of first detection.
5.2. A Comparison to Engine-Driven SNe
We next compared the optical luminosities of our SN Ibc sample to those of GRB-SNe discovered within a similar volume, Mpc. While additional GRB-SNe are available in the literature we chose a distance-limited approach in an effort to minimize observational biases associated with the ray discovery of GRB-SNe. Our comparison GRB-SNe sample includes just two events: SN 1998bw (Galama et al., 1998) associated with GRB 980425 (Pian et al., 2000) at Mpc and SN 2006aj (Pian et al., 2006) associated with XRF 060218 at Mpc. To this small sample of central engine-drive explosions, we add the broad-lined Type Ic SN 2009bb at Mpc which was not associated with a detected gamma-ray burst but was shown to produce copious relativistic ejecta based on radio observations of the “orphaned” afterglow (Soderberg et al., 2010).
We compiled the optical SN photometry in the and bands for SNe 1998bw, 2006aj, and 2009bb from Galama et al. (1998), Mirabal et al. (2006), and Pignata et al. (2011), respectively. After correcting for Galactic extinction, the peak magnitudes for GRB-SNe 1998bw (2006aj) are () mag and () mag. No evidence for host galaxy extinction was reported for either SN 1998bw or SN 2006aj and we test this result using our () color diagnostic. Interpolating over the light curves, we find and mag for SNe 1998bw and 2006aj, respectively. Indeed, these values are consistent with the total extinction corrected colors for our literature sample. This exercise serves as independent confirmation for negligible host galaxy extinction in these two cases. The peak magnitudes for SN 2009bb are nearly identical to those of SN 2006aj after correcting for a host galaxy extinction of mag (Pignata et al., 2011). Finally, we note that the recent photometric study of SN 2010bh associated with XRF 100316D further supports the utility of our extinction correction technique for engine-driven SNe with moderate reddening (Cano et al., 2011).
A comparison of the extinction-corrected peak absolute magnitudes for engine-driven SNe and ordinary SNe reveals a handful of objects with luminosities comparable to and/or higher than SNe 1998bw, 2006aj, and 2009bb. We use a Monte Carlo test to determine whether the peak absolute luminosities of these three engine-driven and relativistic SNe are consistent with the distribution for SNe Ibc (Figure 19). We find a probability that the engine-driven SNe are drawn from the ordinary SNe Ibc population and a chance that they are consistent with the SNe Ic-BL sample.
6. Physical Parameters
In this paper, we derived the light curve properties (peak luminosity and decay rate) in a systematic fashion for the 17 Gold and Silver P60 SNe, the ten well-studied SNe Ibc currently available from the literature, and the three central engine-driven SNe identified to date within the same volume. As discussed in §3, these observed properties are directly determined by the three explosion parameters: , , and . Here we present a systematic method to map the observed light curve properties of SNe Ibc (, ) to the physical parameters of the explosion.
We adopt the analytic light curve models of Valenti et al. (2008) which are based on original formalism of Arnett (1982) for Type I SNe. The models account for the energy deposition of 56Co in addition to 56Ni. We assume a homogeneous density distribution within the SN ejecta and a fixed optical opacity () to produce a family of 1000 model light curves for a wide range of reasonable explosion parameters spanning erg, , and . We made the further requirement that and converted the resulting bolometric light curves to the band assuming a typical near-IR contribution of at maximum light (e.g., Stritzinger et al. 2009).
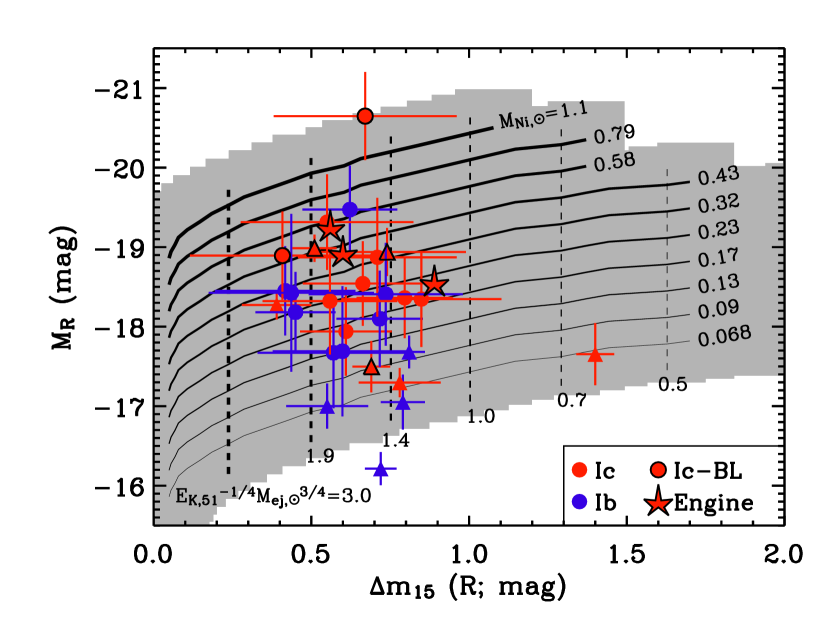
For each model light curve (associated with specific values of , , and ), we measure the and values. These two measurable quantities define a two-dimension region in the and parameter space since a normalization constant is all that distinguishes from the quantity, . Therefore, within this parameter space, the two observable light curve properties are mapped to the three physical explosion parameters (Figure 22). A photospheric velocity measurement is additionally required to break the degeneracy between and .
In Figure 22 we compare the and measurements for our sample of SNe Ibc with the grid of synthetic values measured for our family of model light curves. The utility of this Figure is that it enables the explosion parameters to be reasonably and systematically estimated using only the two observed quantities and sparing detailed modeling of the light curves and spectra. Extrapolating over the grid of synthetic parameters (, ) for the family of models, we convert our measurements to estimates for , , and for the SNe in our Gold and Silver P60 samples (Table 6). For a few of the literature SNe and engine-driven SNe, detailed modeling of the light curves and spectra have resulted in direct estimates for the , and , and values (e.g., 1994I; Nomoto et al. 2001, 2002ap; Mazzali et al. 2007, 1998bw; Iwamoto et al. 1998, 2006aj; Mazzali et al. 2006, and 2008D; Soderberg et al. 2008). In these cases, our inferred physical parameter estimates from Figure 22 are reasonably consistent with the values derived from detailed modeling thereby supporting our method.
6.1. Nickel Masses
We report mean 56Ni masses for SNe Ib of and for SNe Ic of while for SNe Ic-BL we find . For comparison, we note that the typical 56Ni masses measured for SNe Ia and IIP are (Mazzali et al., 2007) and , respectively (Nomoto et al., 2006).
A K-S test on the estimates reveals a 31% probability that SNe Ib and ordinary Ic are drawn from the same group of explosions. Meanwhile a K-S test on SNe Ic-BL and ordinary SNe Ic reveals only a 3.9% probability of originating from the same population. After grouping SNe Ib and ordinary Ic together, their difference from SNe Ic-BL is accentuated; a K-S test shows only a 1.6% probability that they represent the same explosions.
Focusing on the nearby engine-driven SNe, we find an average 56Ni mass of for the three local events. Based on these values, we calculate a 10% probability that engine-driven SNe are drawn from the overall SNe Ibc population and a 40% probability that they are drawn from the SNe Ic-BL population. We conclude that SNe Ib and Ic are characterized by similar 56Ni mass values while SNe Ic-BL appear more extreme, bearing more similarity to engine-driven explosions. In this context, we note that the especially bright Type Ic-BL SN 2007D synthesized an estimated 56Ni mass of , and the peak luminosity is comparable to the pair-instability candidate, SN 2007bi (Gal-Yam et al., 2009).
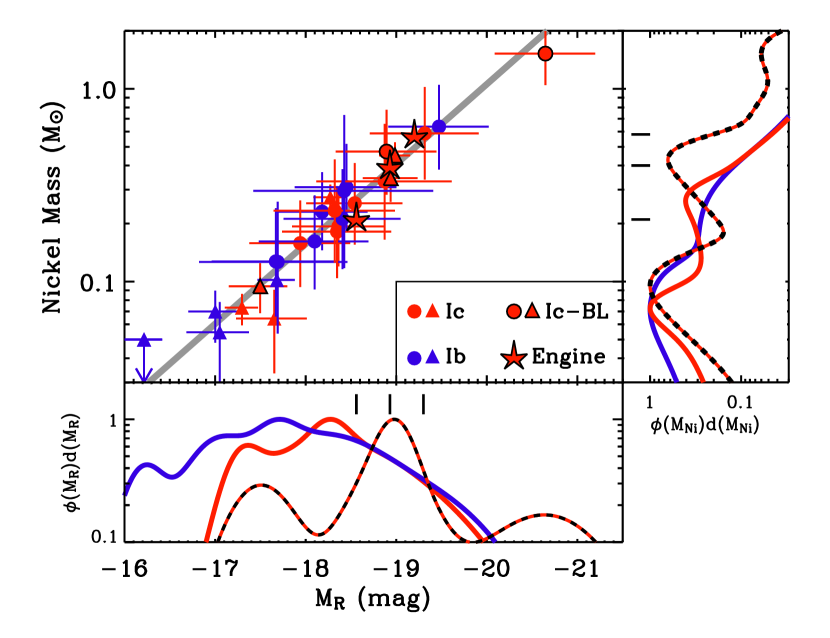
In Figure 23, we compare the derived estimates for with their observed values. A clear trend is seen with an intrinsic scatter due to the observed dispersion in light curve width. The relation can be fit by the function, . This function has roughly the same slope as the fit to a literature sample of core-collapse SNe by Perets et al. (2010) but it is somewhat brighter. For future studies of SNe Ibc in which only an extinction-corrected value is known, this relation can be used to estimate in a systematic way.
6.2. Light Curve Widths
We next extract estimates for each SN in our extended sample and find similar average values for the sub-types of d (Type Ib), d (Type Ic), and d (Type Ic-BL; see Table 7). A KS test on the sample values suggests a 90% probability that SNe Ib, Ic, and Ic-BL are drawn from the same parent population of explosions. For the engine-driven explosions, we find a similar average value of d. Thus, light curve width and/or early decline rate cannot be used to distinguish He-rich from He-poor events, nor does it serve as a proxy for which SNe Ic-BL harbor central engines. At the same time, the large dispersion in light curve widths points to a significant variation in the values and, in turn, the progenitor mass.
6.3. Estimates for and
With reasonable assumptions for the average photospheric velocities of SNe Ib, Ic and Ic-BL, we may break the degeneracy between and implied by our mean estimates derived from our measurements. Within the framework of the analytic light curve models, these two physical parameters depend on as follows:
| (1) | |||||
| (2) |
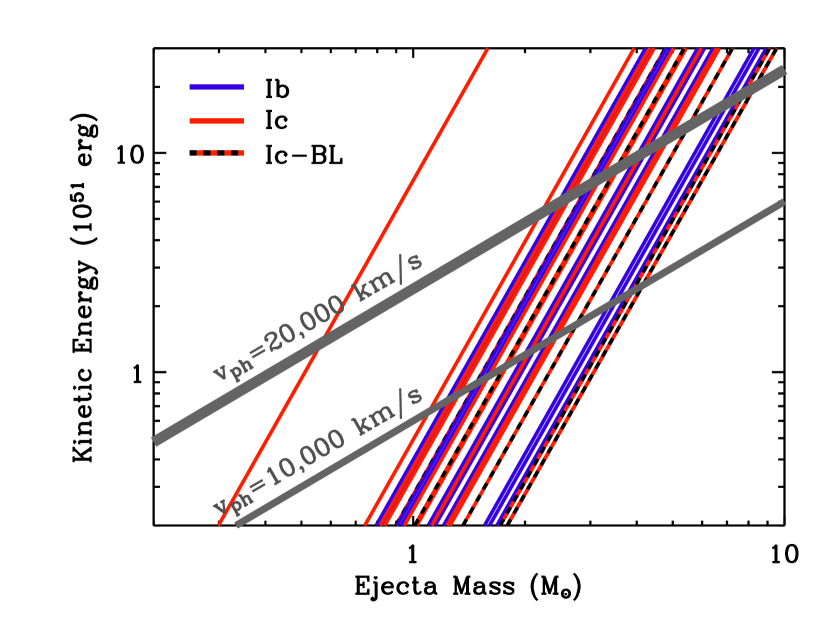
For SNe Ib and Ic we adopt at maximum light, in line with spectroscopic observations (Matheson et al., 2001). For SNe Ic-BL and engine-driven SNe, the observed range of values is broader; we adopt for the SNe Ic-BL at maximum light (e.g., Pian et al. 2006). Combining these assumptions with our average estimates for the combined sample (Table 6), we find typical values of and erg for SNe Ib and Ic while for SNe Ic-BL we find higher values, and erg (Figure 24). For the three local engine-driven explosions we estimate and erg (Table 7). Thus, based on these reasonable estimates of , we find no evidence for different explosion parameters among SNe Ib and Ic, while those of SNe Ic-BL are distinct and more closely resemble the values inferred for engine-driven explosions.
7. Implications for SNe Ibc Progenitors
Here we consider the implications for the progenitors of SNe Ibc based on their derived explosion parameters together with host galaxy and/or explosion site diagnostics. While we derive similar explosion properties for SNe Ib and Ic, their explosion site properties imply statistically significant dissimilarities. SNe Ic favor the more luminous and metal-rich regions of their host galaxies than SNe Ib (Kelly, Kirshner & Pahre 2008; Modjaz et al. 2010 but see Anderson et al. 2010). These explosion site diagnostics suggest that SNe Ic progenitors are more massive and/or younger and characterized by a slightly higher metal content than the progenitors of SNe Ib. More massive progenitors may produce explosions with larger values unless they are able to lose mass more efficiently throughout. Since the line-driven winds of Wolf-Rayet stars are enhanced at higher metallicity (; Vink & de Koter 2005), we speculate that SNe Ic progenitors are initially more massive than those of SNe Ib but lose mass more efficiently, resulting in explosion parameters that appear indistinguishable from their helium-rich cousins.
Next we consider the more extreme explosion parameters we infer for SNe Ic-BL in comparison to those of SNe Ibc. Explosion site metallicities for SNe Ic-BL do not reveal strong dissimilarities from those of SNe Ib and Ic (Anderson et al. 2010; Modjaz et al. 2010 but see Arcavi et al. 2010). However, a study of the explosion site luminosities indicate that SNe Ic-BL trace the star-forming light of their host galaxies at least as tightly as SNe Ic and perhaps as tightly as GRB-SNe (Kelly, Kirshner & Pahre, 2008). At the same time, the light curves of SNe Ic-BL show evidence for more powerful explosions, with somewhat larger values than ordinary SNe Ibc (Table 7). We therefore speculate that SNe Ic-BL may represent the explosion of more massive progenitor stars than other SNe Ibc across a broad range of metallicities. This may also explain the existence of broad-lined SNe of Types Ib and IIb that stem from metal-poor progenitors (e.g., SN 2003bg; Hamuy et al. 2009).
Finally we consider the relation of engine-driven SN progenitors to those of SNe Ic-BL. Based on their optical properties (light curves and spectra), SNe Ic-BL and engine-driven SNe appear statistically indistinguishable, however radio observations reveal relativistic outflows in only a small fraction (Soderberg et al., 2010). Meanwhile, explosion site metallicity measurements indicate that engine-driven explosions tend to populate the low end of the metallicity distribution for SNe Ibc (Modjaz et al., 2010), although there are some notable exceptions (see Levesque et al. 2010). In these cases, an additional key parameter may be at play and possibly related to the rotation, binarity, or the nature of the compact remnant of the progenitor system (black hole, neutron star or magnetar; Yoon, Woosley & Langer 2010).
8. Conclusions
We present the first uniform and statistical sample of SNe Ibc multi-band light curves available to date. We find a significant dispersion among the light curves both in peak luminosity and decay rate. Through a comparison with the existing small sample of well-observed SNe Ibc light curves from the literature, we find that a significant fraction of SNe Ibc are heavily extinguished with mag. After correcting our light curves for host galaxy extinction, we compare differential and cumulative distributions for the peak absolute magnitudes of SNe Ib, Ic, and Ic-BL. We find that the peak luminosity distributions for SNe Ib and Ic are statistically indistinguishable, with mag and are therefore not inconsistent with a single progenitor channel for helium-poor and helium-rich events. A comparison of their early decline rates supports this hypothesis and we note there is no evidence for a correlation with peak absolute magnitude as is seen for SNe Ia. However, we find that SNe Ic-BL are typically more luminous with mag. The probability that they belong to the same set of progenitors and/or explosions as ordinary SNe Ib and Ic is just 2%.
We compare these observed light curve properties with those of the three nearby engine-driven SNe discovered within the same volume and find a significant overlap with the SNe Ic-BL population. The probability that engine-driven SNe are drawn from the SNe Ic-BL population is 25%, based on these optical diagnostics alone. This result underscores the point that neither high luminosity nor fast photospheric velocity can be used as a robust indicator for an engine-driven explosion, and thus radio searches for a relativistic outflow are required to distinguish (e.g., Soderberg et al. 2010).
We model the optical light curves in a systematic fashion to extract estimates of the three physical parameters, , , and and find that the results reiterate those reviewed above. Namely, there is no significant difference between SNe Ib and Ic and we estimate their physical parameters to be , , and erg. Meanwhile, SNe Ic-BL and engine-driven events are similar to one another and distinct from ordinary SNe Ib and Ic; for them we estimate more extreme physical parameters of , , and erg. The statistically significant difference between ordinary SNe Ibc and SNe Ic-BL (including engine-driven events) suggests that the latter share a distinct 56Ni production mechanism and/or ejecta distribution (e.g., bipolar outflow).
Looking forward, the inclusion of spectroscopic diagnostics (e.g., measurements, He I feature intensities) would enable an extension of this systematic study to search for additional correlations and to properly break the model degeneracies between and . Along this line, we reiterate that ten of the SNe in our study were observed as part of the CCCP and thus spectroscopic observations (often extensive) exist for this sub-sample. This project will be the focus of a separate study. Furthermore, a direct comparison of host galaxy diagnostics with optical light curve properties (e.g., peak luminosity) may reveal further clues on the nature of SN Ibc progenitors and their relation to those of engine-driven explosions. Since our sample is drawn from targeted surveys, it is likely biased toward metal-rich host galaxies. Fortunately, new wide-field transient surveys such as Pan-STARRS (Kaiser et al., 2002) and the Palomar Transient Factory (Law et al., 2009) are discovering SNe in a broad range of host galaxy environments and will enable such comparisons to be made in an unbiased fashion. Moreover, thanks to the higher cadence of these optical surveys, SNe Ibc will be discovered earlier with respect to the explosion date, reducing the fraction of Bronze SNe in future follow-up samples. Finally we note that the significant values inferred here motivates the regular use of near-IR facilities in future studies of SNe Ibc.
M.R.D. and A.M.S. acknowledge support by the National Science Foundation Research Experiences for Undergraduates (REU) and Department of Defense Awards to Stimulate and Support Undergraduate Research Experiences (ASSURE) programs under Grant no. 0754568 and by the Smithsonian Institution. The work of A.G. is supported by grants from the Israeli Science Foundation (ISF), an EU/FP7 Marie Curie IRG Fellowship and a research grant from the Gruber Awards. S.B.C acknowledges generous support from Gary and Cynthia Bengier and the Richard and Rhoda Goldman Foundation. The work of D.C.L. is supported by National Science Foundation (NSF) grant AST-1009571. D.C.L. is grateful for an NSF Astronomy and Astrophysics Postdoctoral Fellowship under award AST-0401479, during which part of this work was completed.
References
- Aldering et al. (2005) Aldering, G. et al. 2005, The Astronomer’s Telegram, 451, 1.
- Anderson et al. (2010) Anderson, J. P., Covarrubias, R. A., James, P. A., Hamuy, M., and Habergham, S. M. 2010, MNRAS, 407, 2660.
- Antilogus et al. (2006) Antilogus, P. et al. 2006, The Astronomer’s Telegram, 854, 1.
- Arcavi et al. (2010) Arcavi, I. et al. 2010, ApJ, 721, 777.
- Arnett (1982) Arnett, W. D. 1982, ApJ, 253, 785.
- Baek et al. (2006) Baek, M., Li, W., Puckett, T., Sostero, G., and Garzia, S. 2006, IAU Circ., 8660, 1.
- Begelman & Sarazin (1986) Begelman, M. C. and Sarazin, C. L. 1986, ApJ, 302, L59.
- Berger et al. (2003) Berger, E., Kulkarni, S. R., Frail, D. A., and Soderberg, A. M. 2003, ApJ, 599, 408.
- Blondin et al. (2006) Blondin, S., Modjaz, M., Kirshner, R., Challis, P., and Calkins, M. 2006, Central Bureau Electronic Telegrams, 626, 1.
- Blondin et al. (2009) Blondin, S. et al. 2009, ApJ, 693, 207.
- Cano et al. (2011) Cano, Z. et al. 2011, arxiv:1104.5141.
- Cenko et al. (2006) Cenko, S. B. et al. 2006, PASP, 118, 1396.
- Chevalier (1998) Chevalier, R. A. 1998, ApJ, 499, 810.
- Chevalier & Fransson (2006) Chevalier, R. A. and Fransson, C. 2006, ApJ, 651, 381.
- Chevalier & Soderberg (2010) Chevalier, R. A. and Soderberg, A. M. 2010, ApJ, 711, L40.
- Clocchiatti et al. (1996) Clocchiatti, A., Wheeler, J. C., Benetti, S. and Frueh, M. 1996, ApJ, 459, 547.
- Clocchiatti & Wheeler (1997a) Clocchiatti, A. and Wheeler, J. C. 1997a, ApJ, 491, 375.
- Clocchiatti & Wheeler (1997b) Clocchiatti, A. and Wheeler, J. C. 1997b, astro-ph/9601023.
- Colesanti et al. (2006) Colesanti, C. et al. 2006a, IAU Circ., 8658, 2.
- Colesanti et al. (2006) Colesanti, C. et al. 2006b, IAU Circ., 8713, 1.
- Conley et al. (2006) Conley, A. et al. 2006, AJ, 132, 1707.
- de Vaucouleurs et al. (1991) de Vaucouleurs, G., de Vaucouleurs, A., Corwin, Jr., H. G., Buta, R. J., Paturel, G., and Fouque, P. 1991, Third Reference Catalogue of Bright Galaxies, ).
- Elias et al. (1985) Elias, J. H., Matthews, K., Neugebauer, G., and Persson, S. E. 1985, ApJ, 296, 379.
- Filippenko (1997) Filippenko, A. V. 1997, ARA&A, 35, 309.
- Filippenko & Foley (2004) Filippenko, A. V. and Foley, R. J. 2004a, IAU Circ., 8453, 3.
- Filippenko & Foley (2004) Filippenko, A. V. and Foley, R. J. 2004b, IAU Circ., 8453, 3.
- Filippenko, Foley & Matheson (2005) Filippenko, A. V., Foley, R. J., and Matheson, T. 2005, IAU Circ., 8639, 2.
- Filippenko et al. (2004) Filippenko, A. V., Ganeshalingam, M., Serduke, F. J. D., and Hoffman, J. L. 2004, IAU Circ., 8404, 1.
- Filippenko & Sargent (1985) Filippenko, A. V. and Sargent, W. L. W. 1985, Nature, 316, 407.
- Folatelli et al. (2006) Folatelli, G. et al. 2006, ApJ, 641, 1039.
- Foley & Gal-Yam (2007) Foley, R. J. and Gal-Yam, A. 2007, Central Bureau Electronic Telegrams, 805, 1.
- Foley et al. (2003) Foley, R. J. et al. 2003, PASP, 115, 1220.
- Foley et al. (2007) Foley, R. J., Smith, N., Ganeshalingam, M., Li, W., Chornock, R., and Filippenko, A. V. 2007, ApJ, 657, L105.
- Gal-Yam et al. (2007) Gal-Yam, A., Cenko, S. B., Fox, D. B., Leonard, D. C., Moon, D.-S., Sand, D. J., and Soderberg, A. M. 2007, in The Multicolored Landscape of Compact Objects and Their Explosive Origins, ed. T. di Salvo, G. L. Israel, L. Piersant, L. Burderi, G. Matt, A. Tornambe, and M. T. Menna, volume 924 of American Institute of Physics Conference Series, 297.
- Gal-Yam et al. (2005) Gal-Yam, A. et al. 2005, ApJ, 630, L29.
- Gal-Yam et al. (2009) Gal-Yam, A. et al. 2009, Nature, 462, 624.
- Galama et al. (1998) Galama, T. J. et al. 1998, Nature, 395, 670.
- Ganeshalingam et al. (2004) Ganeshalingam, M., Swift, B. J., Serduke, F. J. D., and Filippenko, A. V. 2004, IAU Circ., 8456, 4.
- Graham & Li (2004) Graham, J. and Li, W. 2004a, IAU Circ., 8377, 2.
- Graham & Li (2004) Graham, J. and Li, W. 2004b, IAU Circ., 8381, 1.
- Greiner et al. (2010) Greiner, J. et al. 2010, in American Institute of Physics Conference Series, ed. N. Kawai & S. Nagataki, volume 1279 of American Institute of Physics Conference Series, 144.
- Hamuy et al. (2009) Hamuy, M. et al. 2009, ApJ, 703, 1612.
- Hamuy et al. (2002) Hamuy, M. et al. 2002, AJ, 124, 417.
- Hayden et al. (2010) Hayden, B. T. et al. 2010, ApJ, 712, 350.
- Hubble (1926) Hubble, E. P. 1926, ApJ, 64, 321.
- Hunter et al. (2009) Hunter, D. J. et al. 2009, A&A, 508, 371.
- Itagaki et al. (2006) Itagaki, K. et al. 2006, IAU Circ., 8762, 1.
- Iwamoto et al. (1998) Iwamoto, K. et al. 1998, Nature, 395, 672.
- Iwamoto et al. (2003) Iwamoto, K., Nomoto, K., Mazzali, P. A., and et al. 2003, in Supernovae and Gamma-Ray Bursters, ed. K. Weiler, volume 598 of Lecture Notes in Physics, Berlin Springer Verlag, 243.
- Joubert et al. (2007) Joubert, N., Li, W., Puckett, T., Orff, T., Gagliano, R., and Sehgal, A. 2007, IAU Circ., 8794, 3.
- Kaiser et al. (2002) Kaiser, N. et al. 2002, in Society of Photo-Optical Instrumentation Engineers (SPIE) Conferen ce Series, ed. J. A. Tyson and S. Wolff, volume 4836 of Society of Photo-Optical Instrumentation Engineers (SPIE) Conferen ce Series, 154.
- Kelly, Kirshner & Pahre (2008) Kelly, P. L., Kirshner, R. P., and Pahre, M. 2008, ApJ, 687, 1201.
- Law et al. (2009) Law, N. M. et al. 2009, ArXiv e-prints.
- Lee, Baek & Li (2006) Lee, E., Baek, M., and Li, W. 2006, IAU Circ., 8669, 1.
- Levesque et al. (2010) Levesque, E. M. et al. 2010, ApJ, 709, L26.
- Li et al. (2010) Li, W. et al. 2010, ArXiv e-prints.
- MacFadyen, Woosley & Heger (2001) MacFadyen, A. I., Woosley, S. E., and Heger, A. 2001, ApJ, 550, 410.
- Matheson et al. (2001) Matheson, T., Filippenko, A. V., Li, W., Leonard, D. C., and Shields, J. C. 2001, AJ, 121, 1648.
- Mazzali et al. (2006) Mazzali, P. A. et al. 2006, Nature, 442, 1018.
- Mazzali et al. (2007) Mazzali, P. A. et al. 2007a, ApJ, 670, 592.
- Mazzali et al. (2007) Mazzali, P. A., Röpke, F. K., Benetti, S., and Hillebrandt, W. 2007b, Science, 315, 825.
- Mirabal et al. (2006) Mirabal, N., Halpern, J. P., An, D., Thorstensen, J. R., and Terndrup, D. M. 2006, ApJ, 643, L99.
- Modjaz et al. (2006) Modjaz, M., Blondin, S., Kirshner, R., Challis, P., Matheson, T., and Mamajek, E. 2006, Central Bureau Electronic Telegrams, 677, 1.
- Modjaz et al. (2010) Modjaz, M., Bloom, J. S., Filippenko, A. V., Kewley, L., Perley, D., and Silverman, J. M. 2010, ArXiv e-prints.
- Modjaz et al. (2004) Modjaz, M., Challis, P., Kirshner, R., Garg, A., Stubbs, C., and Matheson, T. 2004a, IAU Circ., 8428, 3.
- Modjaz et al. (2005) Modjaz, M., Challis, P., Kirshner, R., Matheson, T., and Berlind, P. 2005a, IAU Circ., 8605, 2.
- Modjaz et al. (2004) Modjaz, M., Challis, P., Kirshner, R., Matheson, T., Garg, A., and Stubbs, C. 2004b, IAU Circ., 8426, 3.
- Modjaz et al. (2005) Modjaz, M., Kirshner, R., Challis, P., Blondin, S., and Berlind, P. 2005b, IAU Circ., 8650, 2.
- Modjaz et al. (2005) Modjaz, M., Kirshner, R., Challis, P., Matheson, T., and Berlind, P. 2005c, Central Bureau Electronic Telegrams, 271, 1.
- Modjaz et al. (2005) Modjaz, M., Kirshner, R., Challis, P., Matheson, T., Falco, E., and Berlind, P. 2005d, IAU Circ., 8461, 2.
- Monard et al. (2004) Monard, L. A. G., Quimby, R., Gerardy, C., Hoeflich, P., Wheeler, J. C., Chen, Y., Smith, H. J., and Bauer, A. 2004, IAU Circ., 8454, 1.
- Moore, Shimasaki & Li (2004) Moore, M., Shimasaki, K., and Li, W. 2004, IAU Circ., 8443, 3.
- Mould et al. (2000) Mould, J. R. et al. 2000, ApJ, 529, 786.
- Munari & Zwitter (1997) Munari, U. and Zwitter, T. 1997, A&A, 318, 269.
- Newton & Puckett (2005) Newton, J. and Puckett, T. 2005, IAU Circ., 8648, 2.
- Nomoto et al. (2001) Nomoto, K., Maeda, K., Mochizuki, Y., Kumagai, S., Umeda, H., Nakamura, T., and Tanihata, I. 2001, in Gamma 2001: Gamma-Ray Astrophysics, ed. S. Ritz, N. Gehrels, & C. R. Shrader, volume 587 of American Institute of Physics Conference Series, 487.
- Nomoto et al. (2006) Nomoto, K., Tominaga, N., Umeda, H., Kobayashi, C., and Maeda, K. 2006, Nuclear Physics A, 777, 424.
- Pastorello et al. (2008) Pastorello, A. et al. 2008a, MNRAS, 389, 955.
- Pastorello et al. (2008) Pastorello, A. et al. 2008b, MNRAS, 389, 131.
- Pastorello et al. (2007) Pastorello, A. et al. 2007, Nature, 447, 829.
- Perets et al. (2010) Perets, H. B. et al. 2010, Nature, 465, 322.
- Perley et al. (2009) Perley, D. A. et al. 2009, ArXiv e-prints.
- Phillips (1993) Phillips, M. M. 1993, ApJ, 413, L105.
- Phillips et al. (1999) Phillips, M. M., Lira, P., Suntzeff, N. B., Schommer, R. A., Hamuy, M., and Maza, J. 1999, AJ, 118, 1766.
- Pian et al. (2000) Pian, E. et al. 2000, ApJ, 536, 778.
- Pian et al. (2006) Pian, E. et al. 2006, Nature, 442, 1011.
- Pignata et al. (2011) Pignata, G. et. al. 2011, ApJ, 728, 14.
- Podsiadlowski, Joss & Hsu (1992) Podsiadlowski, P., Joss, P. C., and Hsu, J. J. L. 1992, ApJ, 391, 246.
- Podsiadlowski et al. (2004) Podsiadlowski, P., Mazzali, P. A., Nomoto, K., Lazzati, D., and Cappellaro, E. 2004, ApJ, 607, L17.
- Porter & Filippenko (1987) Porter, A. C. and Filippenko, A. V. 1987, AJ, 93, 1372.
- Prasad et al. (2006) Prasad, R. R., Joubert, N., Baek, M., Li, W., Krzeminsky, W., and Contreras, C. 2006, IAU Circ., 8770, 1.
- Prieto, Stanek & Beacom (2008) Prieto, J. L., Stanek, K. Z., and Beacom, J. F. 2008, ApJ, 673, 999.
- Puckett et al. (2006) Puckett, T., Gagliano, R., Mostardi, R., Li, W., Frieman, J., and Grcevich, J. 2006a, IAU Circ., 8750, 2.
- Puckett et al. (2007) Puckett, T., Orff, T., Madison, D., Li, W., Itagaki, K., Nakano, S., Newton, J., and Kadota, K. 2007, IAU Circ., 8792, 2.
- Puckett et al. (2006) Puckett, T., Peoples, M., Joubert, N., Madison, D. R., Mostardi, R., Khandrika, H., Li, W., and Foley, R. J. 2006b, IAU Circ., 8741, 1.
- Puckett et al. (2005) Puckett, T., Peoples, M., Prasad, R. R., Li, W., Lee, E., Berlind, P., and Faworski, S. 2005a, IAU Circ., 8605, 1.
- Puckett et al. (2005) Puckett, T., Sostero, G., Quimby, R., and Mondol, P. 2005b, IAU Circ., 8639, 1.
- Pugh et al. (2004) Pugh, H., Li, W., Manzini, F., and Behrend, R. 2004, IAU Circ., 8452, 2.
- Pugh, Park & Li (2004) Pugh, H., Park, S., and Li, W. 2004, IAU Circ., 8425, 1.
- Quimby et al. (2004) Quimby, R. et al. 2004, IAU Circ., 8446, 1.
- Quimby et al. (2006) Quimby, R., Mondol, P., Castro, F., Roman, B., and Rostopchin, S. 2006, IAU Circ., 8657, 1.
- Quimby et al. (2005) Quimby, R., Mondol, P., Hoeflich, P., Wheeler, J. C., and Gerardy, C. 2005, IAU Circ., 8503, 1.
- Quimby et al. (2009) Quimby, R. M. et al. 2009, ArXiv e-prints.
- Richardson (2009) Richardson, D. 2009, AJ, 137, 347.
- Richardson, Branch & Baron (2006) Richardson, D., Branch, D., and Baron, E. 2006, AJ, 131, 2233.
- Richmond et al. (1996) Richmond, M. W. et al. 1996, AJ, 111, 327.
- Riess et al. (1999) Riess, A. G. et al. 1999, AJ, 118, 2675.
- Sahu et al. (2009) Sahu, D. K., Tanaka, M., Anupama, G. C., Gurugubelli, U. K., and Nomoto, K. 2009, ApJ, 697, 676.
- Saviane, Hibbard & Rich (2004) Saviane, I., Hibbard, J. E., and Rich, R. M. 2004, AJ, 127, 660.
- Schlegel, Finkbeiner & Davis (1998) Schlegel, D. J., Finkbeiner, D. P., and Davis, M. 1998a, ApJ, 500, 525.
- Schlegel, Finkbeiner & Davis (1998) Schlegel, D. J., Finkbeiner, D. P., and Davis, M. 1998b, ApJ, 500, 525.
- Schwehr & Li (2006) Schwehr, J. and Li, W. 2006, IAU Circ., 8728, 2.
- Shimasaki & Li (2005) Shimasaki, K. and Li, W. 2005, IAU Circ., 8623, 2.
- Silbermann et al. (1996) Silbermann, N. A. et al. 1996, ApJ, 470, 1.
- Smartt (2009) Smartt, S. J. 2009, ARA&A, 47, 63.
- Smartt et al. (2009) Smartt, S. J., Eldridge, J. J., Crockett, R. M., and Maund, J. R. 2009, MNRAS, 395, 1409.
- Smith et al. (2002) Smith, J. A. et al. 2002, AJ, 123, 2121.
- Smith, Foley & Filippenko (2008) Smith, N., Foley, R. J., and Filippenko, A. V. 2008, ApJ, 680, 568.
- Soderberg (2007) Soderberg, A. M. 2007, Caltech PhD Thesis.
- Soderberg et al. (2008) Soderberg, A. M. et al. 2008, Nature, 453, 469.
- Soderberg et al. (2010) Soderberg, A. M. et al. 2010, Nature, 463, 513.
- Soderberg et al. (2006) Soderberg, A. M. et al. 2006a, ApJ, 636, 391.
- Soderberg et al. (2006) Soderberg, A. M., Nakar, E., Berger, E., and Kulkarni, S. R. 2006b, ApJ, 638, 930.
- Stritzinger et al. (2002) Stritzinger, M. et al. 2002, AJ, 124, 2100.
- Stritzinger et al. (2009) Stritzinger, M. et al. 2009, ApJ, 696, 713.
- Takáts & Vinkó (2006) Takáts, K. and Vinkó, J. 2006, MNRAS, 372, 1735.
- Taubenberger et al. (2006) Taubenberger, S. et al. 2006, MNRAS, 371, 1459.
- Thompson, Chang & Quataert (2004) Thompson, T. A., Chang, P., and Quataert, E. 2004, ApJ, 611, 380.
- Uomoto, & Kirshner (1985) Uomoto, A. & Kirshner, R. P. 1985, A&A, 149, L7.
- Valenti et al. (2008) Valenti, S. et al. 2008, MNRAS, 383, 1485.
- van Dyk, Hamuy & Filippenko (1996) van Dyk, S. D., Hamuy, M., and Filippenko, A. V. 1996, AJ, 111, 2017.
- Vink & de Koter (2005) Vink, J. S. and de Koter, A. 2005, A&A, 442, 587.
- Weiler et al. (1986) Weiler, K. W., Sramek, R. A., Panagia, N., van der Hulst, J. M., and Salvati, M. 1986, ApJ, 301, 790.
- Wheeler & Levreault (1985) Wheeler, J. C. and Levreault, R. 1985, ApJ, 294, L17.
- Wong et al. (2006) Wong, D. S., Silverman, J. M., Pooley, D., and Filippenko, A. V. 2006, IAU Circ., 8677, 3.
- Woosley & Bloom (2006) Woosley, S. E. and Bloom, J. S. 2006, ARA&A, 44, 507.
- Woosley, Heger & Weaver (2002) Woosley, S. E., Heger, A., and Weaver, T. A. 2002, Reviews of Modern Physics, 74, 1015.
- Woosley, Langer & Weaver (1995) Woosley, S. E., Langer, N., and Weaver, T. A. 1995, ApJ, 448, 315.
- Yoon, Woosley & Langer (2010) Yoon, S., Woosley, S. E., and Langer, N. 2010, ArXiv e-prints.
.
| SN | Host Galaxy | Distance | Inclination | Discovery | Spectral | Classification | |
|---|---|---|---|---|---|---|---|
| (Mpc) | (degrees) | Galactic (mag)11Milky Way extinction estimates adopted from Schlegel, Finkbeiner & Davis (1998). | Circular22Entries refer to electronic circular numbers prefaced by “I” (IAUC), “C” (CBET), or “A” (ATEL) and the full references are listed below. | Type | Circular22Entries refer to electronic circular numbers prefaced by “I” (IAUC), “C” (CBET), or “A” (ATEL) and the full references are listed below. | ||
| 2004dk**P60 observations conducted under the Caltech Core-Collapse Supernova Program. | NGC 6118 | ††Redshift independent distance. | 0.157 | I8377 | Ib | I8404 | |
| 2004dn**P60 observations conducted under the Caltech Core-Collapse Supernova Program. | UGC 2069 | 0.048 | I8381 | Ic | I8381 | ||
| 2004fe**P60 observations conducted under the Caltech Core-Collapse Supernova Program. | NGC 132 | 0.025 | I8425 | Ic | I8426 | ||
| 2004ff**P60 observations conducted under the Caltech Core-Collapse Supernova Program. | ESO 552-G40 | 0.032 | I8425 | Ic | I8428 | ||
| 2004ge**P60 observations conducted under the Caltech Core-Collapse Supernova Program. | UGC 3555 | 0.087 | I8443 | Ic | I8453 | ||
| 2004gk**P60 observations conducted under the Caltech Core-Collapse Supernova Program. | IC 3311 | †,a†,afootnotemark: | 0.030 | I8446 | Ic | I8446 | |
| 2004gq**P60 observations conducted under the Caltech Core-Collapse Supernova Program. | NGC 1832 | ††Redshift independent distance. | 0.073 | I8452 | Ib | I8461 | |
| 2004gt**P60 observations conducted under the Caltech Core-Collapse Supernova Program.,3 | NGC 4038 | 0.046 | I8454 | Ic | I8456 | ||
| 2004gv**P60 observations conducted under the Caltech Core-Collapse Supernova Program. | NGC 856 | 0.033 | I8454 | Ib | I8456 | ||
| 2005az**P60 observations conducted under the Caltech Core-Collapse Supernova Program. | NGC 4961 | ††Redshift independent distance. | 0.011 | I8503 | Ib | A451 | |
| 2005eo | UGC 4132 | ††Redshift independent distance. | 0.067 | I8605 | Ic | I8605 | |
| 2005hg | UGC 1394 | 0.105 | I8623 | Ib | C271 | ||
| 2005kz | MCG +08-34-32 | 0.054 | I8639 | Ic-BL | I8639 | ||
| 2005la44Previous photometry has been published by Pastorello et al. (2008). | Anon. | ddDistance is derived from the host galaxy redshift reported in ATEL 854. | 0.011 | I8639 | IIb | I8639 | |
| 2005mf | UGC 4798 | 0.018 | I8648 | Ic | I8650 | ||
| 2005nb | UGC 7230 | 0.037 | I8657 | Ic-BL | I8657 | ||
| 2006F | NGC 935 | 0.190 | I8658 | Ib | I8660 | ||
| 2006ab | PGC 10652 | 0.489 | I8669 | Ic | I8677 | ||
| 2006ck | UGC 8238 | ††Redshift independent distance. | 0.028 | I8713 | Ic | I8713 | |
| 2006dn | UGC 12188 | ddDistance is derived from the host galaxy redshift reported in ATEL 854. | 0.113 | I8728 | Ib | A854 | |
| 2006el | UGC 12188 | ddDistance is derived from the host galaxy redshift reported in ATEL 854. | 0.113 | I8741 | IIb | C626 | |
| 2006fo | UGC 2019 | 0.029 | I8570 | Ic | I8770 | ||
| 2006jc55Previous photometry has been published by Foley et al. (2007); Pastorello et al. (2007). | UGC 4904 | 0.020 | I8762 | Ibn | C677 | ||
| 2007C | NGC 4981 | ††Redshift independent distance. | 0.042 | I8792 | Ib | I8792 | |
| 2007D | UGC 2653 | 0.335 | I8794 | Ic-BL | C805 |
| SN | Filter | JD | magnitude |
|---|---|---|---|
| SN 2004dk | V | 2453219.8 | 16.99 0.03 |
| 2453220.7 | 16.69 0.03 | ||
| 2453223.8 | 15.88 0.02 | ||
| 2453233.7 | 14.74 0.02 | ||
| 2453234.7 | 14.69 0.02 | ||
| 2453237.8 | 14.55 0.02 | ||
| 2453242.7 | 14.50 0.02 | ||
| 2453252.6 | 14.72 0.02 | ||
| 2453258.6 | 14.91 0.03 | ||
| 2453261.6 | 15.01 0.02 | ||
| 2453266.6 | 15.17 0.02 |
| SN | Host | Distance | Inclination | Spectral | Ref.††References for photometry: 1=Richmond et al. (1996); 2=Stritzinger et al. (2002); 3=Foley et al. (2003); 4=Valenti et al. (2008); 5=Taubenberger et al. (2006); 6=Stritzinger et al. (2009); 7=Hunter et al. (2009); 8=Sahu et al. (2009); 9=Soderberg et al. (2008); 10=Pastorello et al. (2008) | |
|---|---|---|---|---|---|---|
| Galaxy | (Mpc) | (degrees) | Galactic (mag)11Milky Way extinction estimates adopted from Schlegel, Finkbeiner & Davis (1998). | Type | ||
| 1994I | NGC 5194 | aaHost galaxy is a member of the Virgo cluster. Distance is adopted from Mould et al. (2000). | 0.035 | Ic | 1 | |
| 1999ex | IC 5179 | ††References for photometry: 1=Richmond et al. (1996); 2=Stritzinger et al. (2002); 3=Foley et al. (2003); 4=Valenti et al. (2008); 5=Taubenberger et al. (2006); 6=Stritzinger et al. (2009); 7=Hunter et al. (2009); 8=Sahu et al. (2009); 9=Soderberg et al. (2008); 10=Pastorello et al. (2008) | 0.020 | Ib | 2 | |
| 2002ap | NGC 628 | ††References for photometry: 1=Richmond et al. (1996); 2=Stritzinger et al. (2002); 3=Foley et al. (2003); 4=Valenti et al. (2008); 5=Taubenberger et al. (2006); 6=Stritzinger et al. (2009); 7=Hunter et al. (2009); 8=Sahu et al. (2009); 9=Soderberg et al. (2008); 10=Pastorello et al. (2008) | 0.071 | Ic-BL | 3 | |
| 2003jd | MCG -01-59-21 | 0.044 | Ic-BL | 4 | ||
| 2004aw | NGC 3997 | 0.021 | Ic | 5 | ||
| 2007Y | NGC 1187 | ††References for photometry: 1=Richmond et al. (1996); 2=Stritzinger et al. (2002); 3=Foley et al. (2003); 4=Valenti et al. (2008); 5=Taubenberger et al. (2006); 6=Stritzinger et al. (2009); 7=Hunter et al. (2009); 8=Sahu et al. (2009); 9=Soderberg et al. (2008); 10=Pastorello et al. (2008) | 0.022 | Ib | 6 | |
| 2007gr | NGC 1058 | bbDistance is from Silbermann et al. (1996) | 0.062 | Ic | 7 | |
| 2007ru | UGC 12381 | 0.259 | Ic-BL | 8 | ||
| 2008D | NGC 2770 | ††References for photometry: 1=Richmond et al. (1996); 2=Stritzinger et al. (2002); 3=Foley et al. (2003); 4=Valenti et al. (2008); 5=Taubenberger et al. (2006); 6=Stritzinger et al. (2009); 7=Hunter et al. (2009); 8=Sahu et al. (2009); 9=Soderberg et al. (2008); 10=Pastorello et al. (2008) | 0.023 | Ib | 9 | |
| 2008ax | NGC 4490 | ††References for photometry: 1=Richmond et al. (1996); 2=Stritzinger et al. (2002); 3=Foley et al. (2003); 4=Valenti et al. (2008); 5=Taubenberger et al. (2006); 6=Stritzinger et al. (2009); 7=Hunter et al. (2009); 8=Sahu et al. (2009); 9=Soderberg et al. (2008); 10=Pastorello et al. (2008) | 0.022 | IIb | 10 |
| SN††Redshift independent distance. | Band | Peak Time | Peak Apparent | Peak Absolute | |||
|---|---|---|---|---|---|---|---|
| (JD) | Magnitude | (mag) | Host (mag)11In all cases, the host galaxy extinction was inferred using a Milky Way extinction law. | (mag)22The values are estimated from the observed light curves after correcting for the total line-of-sight extinction. | Magnitude | ||
| 1994I | 2449451.440.03 | 12.910.02 | 1.670.05 | 0.42 | 0.19 | ||
| 2449451.920.04 | 12.650.02 | 1.400.06 | 0.20 | ||||
| 1999ex | 2451501.20.5 | 16.630.04 | 0.960.10 | 0.26 | 0.33 | ||
| 2451502.70.5 | 16.260.02 | 0.810.05 | 0.37 | ||||
| 2002ap | 2452313.420.16 | 12.3600.006 | 0.900.04 | 0.0 | 0.31 | ||
| 2452315.740.18 | 12.2670.003 | 0.690.06 | 0.35 | ||||
| 2003jd | 2452944.11.0 | 15.940.18 | 0.970.33 | 0.10 | 0.24 | ||
| 2452944.71.0 | 15.820.15 | 0.740.25 | 0.26 | ||||
| 2004aw | 2453091.10.6 | 17.300.03 | 0.590.14 | 0.35 | 0.30 | ||
| 2453095.00.6 | 16.900.03 | 0.390.11 | 0.44 | ||||
| 2007Y | 2454165.60.5 | 15.3360.011 | 1.070.05 | 0.09 | 0.24 | ||
| 2454166.50.5 | 15.3220.015 | 0.720.05 | 0.25 | ||||
| 2007gr | 2454338.51.1 | 12.910.01 | 0.950.11 | 0.03 | 0.34 | ||
| 2454341.01.7 | 12.760.02 | 0.780.13 | 0.31 | ||||
| 2007ru | 2454439.20.5 | 15.950.015 | 0.750.07 | 0.01 | 0.22 | ||
| 2454439.20.5 | 15.680.019 | 0.510.07 | 0.22 | ||||
| 2008D | 2454491.70.5 | 17.400.02 | 0.550.08 | 0.59 | 0.22 | ||
| 2454491.70.5 | 16.840.04 | 0.550.13 | 0.30 | ||||
| 2008ax | 2454549.50.5 | 13.510.02 | 0.940.05 | 0.28 | 0.22 | ||
| 2454341.01.7 | 12.760.02 | 0.78 0.13 | 0.23 |
| SN | Band | Peak Time | Peak Apparent | Peak Absolute | Group | ||
|---|---|---|---|---|---|---|---|
| (JD) | Magnitude††The total extinction estimates, peak times and peak apparent magnitudes in the and bands were compiled from the following references: 1994I=Richmond et al. (1996); 1999ex=Stritzinger et al. (2002); 2002ap=Foley et al. (2003); 2003jd=Valenti et al. (2008); 2004aw=Taubenberger et al. (2006); 2007Y=Stritzinger et al. (2009); 2007gr=Hunter et al. (2009); 2007ru=Sahu et al. (2009); 2008D=Soderberg et al. (2008); 2008ax=Pastorello et al. (2008). | (mag) | Host (mag) | Magnitude | |||
| 2004dk | 2453238.00.5 | 14.760.1 | 0.560.12 | 0.180.11 | G | ||
| 2453242.50.5 | 14.420.1 | 0.450.13 | |||||
| 2004dn | 2453230.50.5 | 17.350.1 | 0.760.15 | 0.520.13 | G | ||
| 2453232.00.5 | 16.920.1 | 0.610.14 | |||||
| 2004fe | 2453318.00.5 | 16.910.1 | 0.870.16 | 0.290.11 | G | ||
| 2453320.50.5 | 16.660.1 | 0.800.15 | |||||
| 2004ff | 17.57 | 0.270.15 | -18.02 | S | |||
| 2453316.01.0 | 17.180.2 | 0.850.25 | |||||
| 2004ge | 17.69 | 0.880.15 | -19.21 | S | |||
| 2453341.51.0 | 17.090.2 | 0.550.27 | |||||
| 2004gk | 13.98 | 0.030 | -17.20 | B | |||
| 13.62 | -17.86 | ||||||
| 2004gq | 2453361.00.5 | 15.320.1 | 0.780.22 | 0.180.11 | G | ||
| 2453361.50.5 | 14.990.1 | 0.600.22 | |||||
| 2004gt | 15.77 | 0.046 | -16.26 | B | |||
| 15.34 | -17.34 | ||||||
| 2004gv | 18.33 | 0.033 | -16.27 | B | |||
| 17.86 | -17.17 | ||||||
| 2005az | 16.11 | 0.430.11 | -18.23 | S | |||
| 2453476.01.0 | 15.550.2 | 0.420.22 | |||||
| 2005eo | 17.71 | 0.570.20 | -18.90 | S | |||
| 2453648.01.0 | 17.250.2 | 0.710.25 | |||||
| 2005hg | 2453684.00.5 | 17.440.1 | 0.790.15 | 0.580.13 | G | ||
| 2453686.00.5 | 16.800.1 | 0.620.15 | |||||
| 2005kz | 18.15 | 0.460.13 | -18.75 | S | |||
| 2453715.01.0 | 17.610.2 | 0.410.29 | |||||
| 2005la | 18.00 | 0.011 | -16.44 | B | |||
| 17.64 | -17.10 | ||||||
| 2005mf | 2453736.00.5 | 18.000.1 | 0.780.19 | 0.380.12 | G | ||
| 2453737.50.5 | 17.650.1 | 0.660.19 | |||||
| 2005nb | 17.60 | 0.037 | -17.63 | B | |||
| 17.05 | -18.15 | ||||||
| 2006F | 17.70 | 0.540.17 | -18.27 | S | |||
| 2453754.01.0 | 17.000.2 | 0.740.24 | |||||
| 2006ab | 18.55 | 0.270.18 | -17.93 | S | |||
| 2453784.52.0 | 17.580.2 | 0.560.21 | |||||
| 2006ck | 18.29 | 0.028 | -17.04 | B | |||
| 17.68 | -17.91 | ||||||
| 2006dn | 17.56 | 0.430.29 | -18.36 | S | |||
| 2453932.01.0 | 17.070.2 | 0.440.26 | |||||
| 2006el | 2453982.51.0 | 17.610.2 | 0.730.25 | 0.190.12 | G | ||
| 2453984.51.0 | 17.260.2 | 0.570.24 | |||||
| 2006fo | 17.07 | 0.029 | -17.70 | B | |||
| 16.65 | -18.25 | ||||||
| 2006jc | 14.74 | 0.020 | -18.00 | B | |||
| 14.70 | -18.47 | ||||||
| 2007C | 2454116.50.5 | 16.070.1 | 0.940.14 | 0.640.12 | G | ||
| 2454118.00.5 | 15.490.1 | 0.720.14 | |||||
| 2007D | 18.15 | 0.910.13 | -20.54 | S | |||
| 2454120.01.0 | 17.090.2 | 0.670.29 |
| SN | |||
|---|---|---|---|
| (days) | () | ||
| 1994I | |||
| 1999ex | |||
| 2002ap | |||
| 2003jd | |||
| 2004aw | |||
| 2004dk | |||
| 2004dn | |||
| 2004fe | |||
| 2004ff | |||
| 2004ge | |||
| 2004gq | |||
| 2005az | |||
| 2005eo | |||
| 2005hg | |||
| 2005kz | |||
| 2006F | |||
| 2006ab | |||
| 2006dn | |||
| 2006el | |||
| 2007C | |||
| 2007D | |||
| 2007Y††Peak apparent magnitude errors are dominated by the uncertainty associated with template fitting for the epoch and magnitude at maximum. | |||
| 2007gr | |||
| 2007ru | |||
| 2008D | |||
| 2008ax |
| SN Type | ††The observed properties for SN 2007Y reside at the edge of our model parameter grid so our derived physical parameters are uncertain; we quote an upper limit for . | ††Typical photospheric velocities of are assumed for SNe Ib and Ic and for SNe Ic-BL and engine-driven SNe. | |||||
|---|---|---|---|---|---|---|---|
| (mag) | (mag) | () | (days) | (() | () | () | |
| SNe Ib | |||||||
| SNe Ic | |||||||
| SNe Ic-BL | |||||||
| Engine-driven SNe |