2010 \SetConfTitleXIII Latin American Regional IAU Meeting \suppressfulladdresses \addkeywordGalaxies: active \addkeywordGalaxies: statistics
Relation between activity, morphology and environment for a large sample of SDSS galaxies.
We apply a stellar population synthesis code to the spectra of a large sample of SDSS galaxies to classify these according to their activity (using emission-line diagnostic diagrams), environment (using catalogues of isolated and cluster galaxies), and using parameters that correlate with their morphology.
From the SDSS-DR7 (Abazajian et al., 2009), a flux-limited sample of galaxies was selected following selection criteria used by Cid Fernandes et al. (2005, – Cid05). We apply a stellar population synthesis code known as Starlight (Cid05) to the spectra of the resulting sample (175111 galaxies), obtaining the the intensity of the emission lines of each galaxy (from the residual spectra).
Using emission-line diagnostic diagrams (Baldwin, Phillips & Terlevich, 1981, – BPT; Coziol et al., 1998, – Coz98), and the diagnostic lines of Kewley et al. (2001) and Kauffmann et al. (2003), we classified the sample in three classes: Star Forming galaxies (SFs), AGN-hosts (AGNs) and Transition Objects (TOs), classifying only galaxies with in the relevant lines of each diagram. Using the standard BPT diagram – vs. , the fractions of galaxies in each class are 66% SFs, 10% AGNs and 24% TOs, out of 91254 galaxies classifiable with this diagram. Combining this diagram with the “NII Diagram” (Coz98) – vs. , the fractions are 55% SFs, 23% AGNs and 22% TOs, out of 127827 galaxies classifiable with this diagram.
Fukugita et al. (2007) found a correlation between the morphology and the K-corrected photometric colours (, , , and , defined in the SDSS photometric system), and also between the morphology and the concentration index (defined as the ratio of the 50% and 90% Petrosian radii). Using these relations, we classified all the galaxies in our sample adopting a “morphological index” T, ranging from 0 to 6 (0 = E, 1 = S0, 2 = Sa, 3 = Sb, 4 = Sc, 5 = Sd/Sm, 6 = Irr; Fukugita et al., 2007, see).
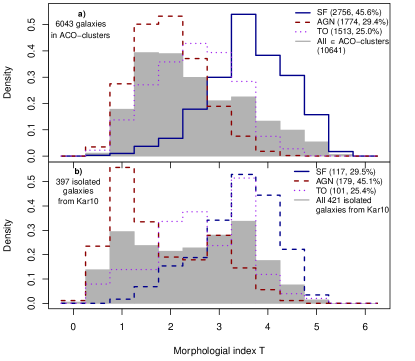
We constructed a subsample of galaxies that live in a cluster environment, using the compilation of redshifts of ACO (Abell, Corwin & Olowin, 1989) cluster member galaxies maintained by one of us (see Andernach et al., 2005). The figure shows the distribution of morphological index T of galaxies in this subsample with different activity types according to the NII Diagram. As a comparison, we show the same distribution for 421 narrow-emission-line isolated galaxies from Karachentseva et al. (2010). A strong morphological segregation between different activity types can be seen in both environments.
References
- Abazajian et al. (2009) Abazajian, K. N., et al., 2009, ApJS, 182, 543.
- Abell, Corwin & Olowin (1989) Abell, G., Corwin, H., & Olowin, R., 1989, ApJS, 70, 1.
- Andernach et al. (2005) Andernach H., et al., 2005, ASP Conf. Series, 329, 283.
- Baldwin, Phillips & Terlevich (1981) Baldwin, J. A., Phillips, M. M., & Terlevich, R., 1981, PASP, 93, 5.
- Cid Fernandes et al. (2005) Cid Fernandes, et al., 2005, MNRAS, 358, 363.
- Coziol et al. (1998) Coziol, R., et al., 1998, ApJ, 493, 563.
- Fukugita et al. (2007) Fukugita, M., et al., 2007, AJ, 134, 579.
- Karachentseva et al. (2010) Karachentseva, V. E., et al., 2010, AstBu, 65, 1.
- Kauffmann et al. (2003) Kauffmann, G., et al., 2003, MNRAS, 346, 1055.
- Kewley et al. (2001) Kewley, L. J., et al., 2001, ApJ, 556, 121.