CHANDRA OBSERVATIONS OF THE HIGH-MAGNETIC-FIELD RADIO PULSAR J17183718
Abstract
High-magnetic-field pulsars represent an important class of objects for studying the relationship between magnetars and radio pulsars. Here we report on four Chandra observations of the high-magnetic-field pulsar J17183718 ( G) taken in 2009 as well as on a re-analysis of 2002 Chandra observations of the region. We also report an improved radio position for this pulsar based on ATCA observations. We detect X-ray pulsations at the pulsar’s period in the 2009 data, with pulsed fraction 52%13% in the 0.8–2.0 keV band. We find that the X-ray pulse is aligned with the radio pulse. The data from 2002 and 2009 show consistent spectra and fluxes; a merged overall spectrum is well fit by a blackbody of temperature eV, slightly higher than predicted by standard cooling models, however, the best-fit neutron star atmosphere model is consistent with standard cooling. We find the bolometric luminosity erg s, for a distance of 4.5 kpc. We compile measurements of the temperatures of all X-ray detected high- pulsars as well as those of low- radio pulsars and find evidence for the former being on average hotter than the latter.
Subject headings:
pulsars: individual (PSR J17183718 (catalog )) — X-rays: stars — stars: neutron1. Introduction
Over the past few decades, our knowledge about the neutron star family has increased significantly. Previously, only one kind of isolated neutron star was known, the radio pulsars. Powered by their rotational energy, they are also called rotation-powered pulsars (RPPs). Their luminosities are generally much lower than the rotation energy loss rate, . X-ray observations have led to the discovery of several new classes of isolated neutron stars; these include magnetars and X-ray isolated neutron stars (XINSs111Also known as X-ray dim isolated neutron stars (XDINSs).); see Kaspi (2010) for a recent review. They all exhibit distinctive properties different from those of conventional RPPs.
Magnetars are isolated, slowly rotating (known periods in the range of 2–12 s) X-ray pulsars, having thermal and non-thermal X-ray luminosities that are in many cases much higher than their spin-down luminosities. Some are characterized by repeating X-ray/-ray bursting activity and therefore are called soft gamma repeaters (SGRs). Others are less active and are characterized by their persistent X-ray pulsations; these are classified as anomalous X-ray pulsars (AXPs). However, the distinction between these two classes has been increasingly blurred, as some sources show properties of both (e.g. Gavriil et al. 2002; Kaspi et al. 2003; Woods et al. 2004; Rea et al. 2009b; Kaneko et al. 2010; Israel et al. 2010; Ng et al. 2011). They generally have very high magnetic fields (– G), inferred assuming that their spin-down rates are solely a result of magnetic dipole radiation. It is generally believed that their X-ray luminosities are powered by the decay of the ultra-high magnetic fields (Duncan & Thompson 1992; Thompson & Duncan 1995, 1996; Thompson et al. 2002). For reviews of magnetars, see Woods & Thompson (2006); Kaspi (2007) or Mereghetti (2008).
XINSs are a small group of slowly rotating (known periods in the range of 3–11 s), nearby (distance 500 pc) neutron stars (see Kaspi et al. 2006, Haberl 2007, Turolla 2009 for reviews). Emitting apparently thermal X-ray spectra, they show no hard X-ray emission. No radio counterparts have been found for these neutron stars. Given their long periods and expected small beaming fractions, it is possible that their radio beams are misaligned with our line of sight (Kondratiev et al. 2009). Therefore, it is not clear whether or not they are intrinsically radio quiet. Timing observations of XINSs have revealed relatively high inferred magnetic fields (1–3 G), and spin-down ages of the order of years (Kaplan & van Kerkwijk 2005; Zane et al. 2005; van Kerkwijk & Kaplan 2008; Kaplan & van Kerkwijk 2009a) for some of them. Unlike magnetars, they show no bursting activity and are much less luminous. However, their X-ray luminosities are comparable with their spin-down power and significantly higher than those of normal RPPs of similar ages (Kaplan & van Kerkwijk 2009a). Therefore, Kaplan & van Kerkwijk (2009a) suggest that the cooling of XINSs is likely affected by magnetic field decay heating as predicted in theory by Arras et al. (2004), Pons et al. (2007) and Aguilera et al. (2008). An alternative explanation is that the XINSs are surrounded by fall-back disks and are heated due to accretion (Alpar 2007).
One likely crucial group of pulsars for understanding the relationships between RPPs, magnetars and XINSs is the high-magnetic-field RPPs. There are now several known RPPs that have spin-down magnetic fields close to or higher than those of magnetars. Some of them are radio pulsars. Sharing properties with both classes, these high- pulsars could be transition objects between RPPs and magnetars. Indeed, some magnetars are now known to emit at radio wavelengths, and magnetar-like bursting behavior has been seen in one high- pulsar. XTE J1810197 is a transient AXP, first detected in outburst (Ibrahim et al. 2004). This magnetar, originally not emitting in the radio band, was observed to have radio pulsations one year after its X-ray outburst (Camilo et al. 2006). Also, the magnetar 1E 1547.05408 shows radio pulsations (Camilo et al. 2007). Though not a radio pulsar, the high- rotation-powered ( G) X-ray PSR J18460258 exhibited a sudden, magnetar-like X-ray outburst that lasted for a few weeks in 2006 (Gavriil et al. 2008; Kumar & Safi-Harb 2008; Ng et al. 2008). Thus, it is possible that the high- RPPs are magnetars in quiescence. Recently, a new magnetar, PSR J16224950, was discovered via its active radio emission, yet is relatively X-ray-faint (Levin et al. 2010). Another magnetar, SGR 0418+5729, detected via its bursting activities, was found to have magnetic field G, well below that of the other magnetars, suggesting that a strong surface dipole magnetic field might not be necessary for magnetar-like behavior (van der Horst et al. 2010; Rea et al. 2010; Esposito et al. 2010). These discoveries further suggest that there could be a large, unseen population of quiescent magnetars, some of which may be ‘disguised’ as radio pulsars.
PSR J17183718 is a radio pulsar discovered in the Parkes Multi-beam Survey (Hobbs et al. 2004). It has period s and spin-down rate . These imply a characteristic age kyr, spin-down power erg s-1 where g cm2 is a fiducial moment of inertia of the pulsar, and surface dipole magnetic field G G, which is the second highest of all known RPPs and is higher than that of AXP 1E 2259586222http://www.physics.mcgill.ca/$∼$pulsar/magnetar/main.html ( G). PSR J17183718 has a dispersion measure (DM) of 373 cm-3pc (Hobbs et al. 2004). Based on the DM and the NE2001 model (Cordes & Lazio 2002), the best-estimated distance to the pulsar is 4.5 kpc. However, the NE2001 model provides a poor estimate of pulsars’ distances when they are near the Galactic center (Gaensler et al. 2004). Indeed the distances estimated based on NE2001 for pulsars in the nearby clusters NGC 6221 and NGC 6403 are a factor of 2–3 smaller than their true distances (Gaensler et al. 2008). Therefore, we suggest that the true distance of PSR J17183718 is probably in the range 4.5–10 kpc.
An X-ray source was serendipitously detected at the radio position of PSR J17183718 in a 2002 Chandra observation. Kaspi & McLaughlin (2005) found that this X-ray source had a soft, thermal-like spectrum, and therefore is the likely X-ray counterpart of the radio pulsar. However, due to the limited photon statistics (see Table 1), the spectral results were not very constraining. Also the coarse time resolution (3.24 s) in the timed exposure mode observation prevented any pulsations from being detected. Deeper Chandra observations with higher time resolution were proposed and conducted in 2009. Interestingly, a large period glitch occurred between 2007 September and 2009 January (Manchester & Hobbs, 2011 in preparation). Four Chandra X-ray observations, each separated by months, were taken in the hope of detecting X-ray variability, possibly associated with the glitch, as occurred in the 2006 outburst of PSR J18460258 (Kuiper & Hermsen 2009; Livingstone et al. 2010, e.g.).
Here we report on a temporal analysis of the four new Chandra observations of PSR J17183718 , as well as on a spectral analysis which also includes the archival 2002 observation.
2. Observations and Results
| ObsID | Date | MJD | aaFrame time of the read out mode. (s) | OffsetbbThe pointing offset from PSR J17183718 . | ccTotal live exposure time. (ks) | R.A., Decl.ddPosition of the X-ray counterpart of PSR J17183718 reported by the CIAO celldetect tool. Numbers in parentheses are 1 uncertainties in the last quoted digit. The uncertainties listed in this column were calculated using the source detection code, and are much smaller than the pointing uncertainty of Chandra . (deg) | , eeTotal counts and estimated background counts in the source region in 0.8–2.0 keV. | Count Rate (s | Fluxff0.8–2.0 keV absorbed flux in units of erg s-1cm-2, measured from a joint fit of the spectra with and fixed at their best-fit values. |
|---|---|---|---|---|---|---|---|---|---|
| 2785 | 2002 May 13 | 52407 | 3.24 | 55.7 | 259.54098(8),37.31437(6) | 99, 5 | 0.0017(2) | 9(2) | |
| 10131 | 2009 Feb 19 | 54881 | 0.44 | 32.0 | 259.54098(1),37.31419(1) | 81, 0.8 | 0.0025(3) | 8(3) | |
| 10766 | 2009 May 15 | 54966 | 0.44 | 33.3 | 259.54096(1),37.31439(1) | 82, 0.6 | 0.0024(3) | 9(2) | |
| 10767 | 2009 Jul 28 | 55040 | 0.44 | 34.2 | 259.54088(1),37.31432(1) | 66, 0.9 | 0.0019(2) | 5(2) | |
| 10768 | 2009 Oct 23 | 55127 | 0.44 | 34.1 | 259.54093(1),37.31432(1) | 73, 1 | 0.0021(3) | 7(2) |
Four observations of PSR J17183718 were taken with the Chandra X-ray Observatory in 2009. Each had 33 ks of live time (see Table 1 for details). In these observations, the pulsar was positioned on the Advanced CCD Imaging Spectrometer (ACIS, Garmire et al. 2003) S3 chip with -offset of and -offset of from the aim point. The other ACIS chips were turned off. The data were taken in 1/8 subarray mode (only photon events from 1/8 of the CCD were read out in this mode), in order to achieve time resolution of 0.44 s, sufficient for timing this 3.3-s pulsar. In the 2002 observation, the pulsar was detected on the S2 chip of ACIS off the aim point, with a total of 99 counts in the 0.8–2.0 keV band (Table 1; Kaspi & McLaughlin 2005).
We started our analysis with the level 2 event files, which are the products of the standard reprocessing III 333http://cxc.harvard.edu/ciao/repro_iii.html, and analyzed the data using the tools provided in CIAO444http://cxc.harvard.edu/ciao/ version 4.2 (CALDB version 4.2.0).
2.1. Imaging and Source Position
PSR J17183718 was detected in all five observations using the celldetect tool in CIAO. The best source positions as reported by celldetect were slightly different from one observation to another (Table 1). This is the result of the small pointing uncertainty of the Chandra satellite. We found the average source position to be R.A.17:18:09.83(1) and decl.37:18:51.5(2) (J2000), where the uncertainties are the standard deviation of the detected positions.
To look for extended emission, we compared the image of PSR J17183718 from each observation with a simulated point-source image generated by the Chandra ray tracer555http://cxc.harvard.edu/chart/ (ChaRT, a.k.a the Chandra point-spread-function[PSF] simulator) and the MARX666http://space.mit.edu/CXC/MARX/ tool in CIAO 4.2. We used ChaRT to produce a collection of rays that come from a point source of the same spectrum as PSR J17183718 (see §2.2). Then we employed MARX to project the rays onto the detector where PSR J17183718 was located. For the above-mentioned images, we removed the effect of pixel randomization777http://cxc.harvard.edu/ciao/why/acispixrand.html to improve their sharpness. The PSF broadening caused by the aspect reconstruction errors and ACIS pixelization were modeled by setting the DitherBlur parameter to in MARX. We did not find any significant difference in the radial profile between the actual images of PSR J17183718 and the simulated images. We also aligned and merged all four PSR J17183718 images from the 2009 observations to a single image, using the reproject_events and dmmerge tools in CIAO 4.2. Again, no significant difference was found between the point source’s radial profile in the merged image and in the simulated image. In summary, we found no evidence of extended emission in the 2009 Chandra observations of PSR J17183718 .
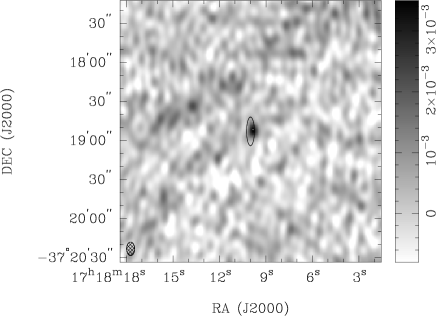
In order to obtain a precise radio position of PSR J17183718 , we carried out a radio imaging campaign using the Australia Telescope Compact Array (ATCA) at 20 and 13 cm. A 12-hr observation was made on 2007 July 9 at center frequencies of 1384 MHz and 2368 MHz, with the 6C array configuration that gives the longest baseline of 6 km. During the observation, pulsar gating was employed to record the pulsar phase information. We performed the data reduction using standard techniques in the MIRIAD package. After the calibration process, a usable bandwidth of 104 MHz was left for each frequency band, which was split into MHz channels. We then employed the task psrfix to de-disperse the pulsar signals and divided the data into 16 pulsar phase bins to form individual intensity maps separately. Our final maps have restoring beams of FWHMs and in the 20 cm and 13 cm wavebands, with corresponding rms noise of 0.5 mJy beam-1 and 0.6 mJy beam-1, respectively. These are higher than the theoretical noise levels due to the sidelobes of a bright supernova remnant G349.7+0.2 at 8′ to the South. The pulsar is clearly detected at the level in the 20 cm waveband (Figure 1), but not at 13 cm. Finally, we employed the task imfit to determined the pulsar position, and found R.A.17:18:09.84(5) and decl.37:18:52.3(1.4) (J2000), with a flux density mJy in one phase bin (corresponding to a mean flux density of 0.220.05 mJy). This flux density is consistent with that in the ATNF catalog888http://www.atnf.csiro.au/research/pulsar/psrcat/ for pulsars. This new radio position and the average Chandra X-ray position are only apart, i.e. consistent with each other.
2.2. Spectroscopy

We extracted the spectrum of the pulsar from all five observations using the psextract script of CIAO 4.2. For the 2009 observations, we used a source region of radius . A source region of radius was used for the 2002 observation because the source was offset from the center of the field of view, where the PSF is broader. The background spectra were extracted from four circular regions of radius centered around the pulsar for all the observations. The resulting source and background spectra were then combined with RMF and ARF files generated using psextract and grouped with a minimum of 15 counts per bin. We found that the spectra of the pulsar are soft, with very few counts above 2.0 keV. Thus for the following spectral analysis we used only the 0.8–2.0 keV band.
We fitted the five spectra separately with an absorbed blackbody model using XSPEC999http://heasarc.nasa.gov/docs/xanadu/xspec/ version 12.5.0. In each source spectrum, there are 66–99 total counts in 0.8–2.0 keV (Table 1), so the best-fit model parameters could not be well constrained when fitting one spectrum at a time. We fitted all five spectra jointly with a single blackbody model, and found a good fit with a reduced of 0.97 for 16 degrees of freedom. In a second joint fit, we allowed the normalization parameter to vary from observation to observation while fixing and at their best-fit values, and found that the inferred 0.8–2.0 keV absorbed fluxes were consistent with being constant (Table 1). This suggests that there are no statistically significant spectral or flux variations from observation to observation. Based on the 0.8–2 keV absorbed fluxes, we estimate a 3 upper limit of 60% on any flux variations.
Because the individual spectra have very few spectral bins after grouping, hence poor spectral resolution, they cannot constrain the model parameters well. In order to mitigate this problem, we summed the five spectra into a single spectrum. The resulting summed spectrum was grouped with a minimum of 20 photons per bin, and had 18 spectral bins in 0.8–2.0 keV. The spectral resolution of the summed spectrum is much better than those of the individual spectra.
| Parameters | Blackbody | NSAaaThe Hydrogen Atmosphere model for pulsar with G and a pure hydrogen atmosphere. The values of neutron star surface temperature and radius km were redshifted for observers at infinite distance according to and with fixed at 1.4. |
|---|---|---|
| ( cm-2) | ||
| (eV) | ||
| (km) | 13 (fixed) | |
| DistancebbIn the blackbody fit, a fiducial distance of 4.5 kpc is used as a scaling factor for the best-fit parameters. In the NSA fit, distance is fitted. (kpc) | ||
| ccAbsorbed X-ray flux in 0.8–2.0 keV. (10-13 erg s-1 cm-2) | ||
| ddUnabsorbed X-ray flux in 0.8–2.0 keV. (10-13 erg s-1 cm-2) | ||
| eeBolometric luminosity. For the NSA model, it is calculated based only on the pulsar’s best-fit surface temperature, and does not depend on distance. However, the best-fit distance in this fit is unreasonably small. If a more reasonable distance were assumed, the resulting best-fit temperature would likely become larger and thus imply a higher bolometric luminosity. ( erg s-1) | ||
| 0.7(15) | 0.7(15) |
We fitted the summed spectrum with a blackbody model, neutron star atmosphere model (NSA; Zavlin et al. 1996; Pavlov et al. 1995) and a power-law model, using the wabs model for interstellar absorption. Figure 2 shows a plot of the summed spectrum with the best-fit absorbed blackbody model.
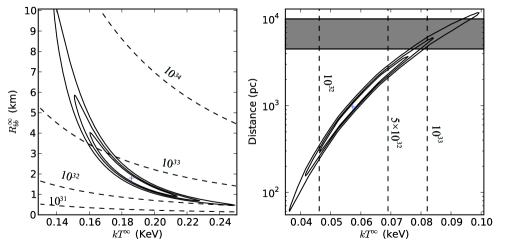
We found a best-fit blackbody temperature of eV, corresponding to a blackbody radius of km and a bolometric luminosity of erg s-1 (assuming a fiducial distance of 4.5 kpc). In order to explore the confidence range of the redshifted temperature and radius for the blackbody model, we plotted their confidence contours in the left panel of Figure 3. This indicates the lowest possible of 140 eV, corresponding to 10 km and erg s-1 (higher than erg s-1 of the pulsar).
The NSA model assumes that the X-ray emission of the pulsar comes from its entire surface. The best-fit local surface temperature is only eV ( eV as seen from Earth), with a best-fit distance of 1.2 kpc (much smaller than the estimated range of 4.5–10 kpc) assuming that the neutron star has mass 1.4 and local radius 10 km. The best-fit parameters of the blackbody and NSA models are listed in Table 2. The highly magnetized NSA model assumes a field of G, less than the inferred of G for PSR J17183718 . We allowed the normalization parameter, which corresponds to , where is the distance of the neutron star, to vary when fitting the spectrum. We plot the confidence contours of the redshifted effective surface temperature and distance in Figure 3, right panel. Assuming the pulsar is at a distance between 4.5 kpc and 10 kpc, it should have a surface temperature between 75 eV and 97 eV and a bolometric luminosity erg s-1.
The best-fit absorbed power-law model has an unreasonably large photon index (); therefore, we consider it no further. We also tried to fit the 0.8–10.0 keV summed spectrum with a resonant cyclotron scattering model (RCS) (Rea et al. 2008), but did not find a good fit (best reduced for 15 degrees of freedom); this is likely due to the lack of hard photon events in the source spectrum.
2.3. Variability and Pulse Profile
We adjusted the time stamps of the source events from all five observations to the solar system barycenter time using the axbary tool in CIAO. We binned the photon events of energy between 0.8 and 2.0 keV from the five observations evenly in time with 3.4 hr per bin. The resulting count rates were consistent with being constant with a 3 upper limit of 48% on variations, therefore showing no evidence of significantly variability on timescales of 3–9 hr. In order to look for variability on shorter timescales, we measured the intervals between the arrival times of every two photons in each observation. We found that they are consistent with the exponential distribution expected from a constant count rate, and therefore, show no evidence of flux variations.
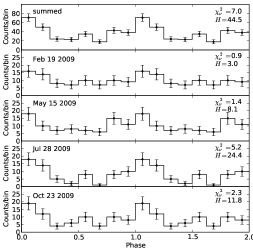
Unlike the 2002 normal timed exposure mode observation that has time resolution 3.24 s, the later four 1/8 subarray observations have 0.44 s time resolution (Table 1) and therefore could be used to search for pulsations from this 3.3-s pulsar. We folded the events with energies between 0.8 and 2.0 keV from the 2009 observations into 8 phase bins based on a timing ephemeris obtained using the Parkes telescope (Manchester & Hobbs, 2011 in preparation). The resulting pulse profile is shown in Figure 4. Significant pulsations are detected. We found the H test (de Jager 1994) value of the summed profile is 44.5 and the best-fit reduced is 7.0 for 7 degrees of freedom. Both correspond to null-hypothesis possibilities of , clearly excluding the null hypothesis . We also measured an area pulsed fraction (the fractional counts above the minimum; Gonzalez et al. 2010) of %% in the 0.8–2.0 keV band and a max-min pulsed fraction of 60%%.
| Observation | H value | |||
|---|---|---|---|---|
| Summed | 49.0 | 44.5 | ||
| 2009 Feb 19 | 6.2 | 3.0 | ||
| 2009 May 15 | 10.1 | 8.1 | ||
| 2009 Jul 28 | 36.6 | 24.4 | ||
| 2009 Oct 23 | 16.2 | 11.8 |
In Figure 4, we also plot the folded pulse profiles from individual observations. Not all of them were significantly pulsed. For instance, when fitted with a constant, the pulse profile of the 2009 February 19 observation gives a best-fit reduced of 0.9 for 7 degrees of freedom and a value of 3, which do not exclude the null hypothesis (Table 3). Through numerical simulations, we have verified that with only 81 counts and assuming Poisson noise, it is possible for a source having 52% pulsed fraction to produce a pulse profile of such low significance. We simulated 10000 pulse profiles with a source with area pulsed fraction of 52%, and found that 209 of them show lower pulse significance than in the February 19 observation. Thus, even if the pulsar’s profile did not change between 2009 February 19 and July 28, there is 2% chance of observing a pulse profile similar to the February 19 one. Taking the number of trials into account, the low pulse significance of this observation does not provide strong evidence for a change in the pulsed fraction.
We fitted the X-ray pulse profile with a sinusoidal function to find its peak phase and compared it with that of the radio pulse after correcting for the effect of dispersion due to the interstellar medium. The radio pulse leads X-ray pulse by in phase. Thus, they are consistent with being aligned.
3. Discussion
We have reported on four new Chandra observations, plus a reanalysis of one archival observation, of the young, high- RPP J17183718. We found no evidence of magnetar-like flux variability in PSR J17183718 from our Chandra observations, and set a 3 upper limit on any flux variability of 60% in the 0.8–2 keV band. However, the possibility that a magnetar-like outburst, such as that observed from PSR J18460258 in 2006 which lasted for only few weeks, happened in the span of our observations could not be ruled out.
| PSR | (kyr) | (G) | (eV) | (km)[(kpc)] | aaThe ratio of the pulsar’s bolometric luminosity (erg s-1) to spin down power (). | references |
|---|---|---|---|---|---|---|
| B0950+08 | [0.3] | Becker et al. (2004) | ||||
| B1929+10ccThese pulsars have very small blackbody radius km and . Their thermal radiation is likely coming from hot spots caused by return current heating. Therefore they are not included in Figure 5. | [0.4] | Misanovic et al. (2008) | ||||
| J0538+2817 | [1.5] | Ng et al. (2007) | ||||
| B0355+54ccThese pulsars have very small blackbody radius km and . Their thermal radiation is likely coming from hot spots caused by return current heating. Therefore they are not included in Figure 5. | [1.0] | McGowan et al. (2007) | ||||
| B0823+26 | [0.3] | Becker et al. (2004) | ||||
| B105552 | [0.8] | De Luca et al. (2005) | ||||
| J0633+1746 | [0.2] | De Luca et al. (2005) | ||||
| J18111925 | [5.0] | Kaspi et al. (2006) | ||||
| J1740+1000 | [1.4] | Z. Misanovic et al. (2011, in prep.) | ||||
| B182313 | [4.0] | Pavlov et al. (2008) | ||||
| B170644 | [2.5] | Gotthelf et al. (2002) | ||||
| B083345 | [0.3] | Manzali et al. (2007) | ||||
| B104658 | [2.7] | Gonzalez et al. (2006) | ||||
| J0205+6449 | [3.2] | Slane et al. (2004) | ||||
| B0531+21 | [1.7] | Weisskopf et al. (2004) | ||||
| B0656+14 | [0.3] | De Luca et al. (2005) | ||||
| J13576429ccThese pulsars have very small blackbody radius km and . Their thermal radiation is likely coming from hot spots caused by return current heating. Therefore they are not included in Figure 5. | [4.1] | C.Chang et al. (2011, in prep.) | ||||
| B2334+61 | [3.1] | McGowan et al. (2006) | ||||
| J18563754bbXINSs. | [0.2] | Burwitz et al. (2003) | ||||
| B1916+14 | [2.1] | Zhu et al. (2009) | ||||
| J2143+0654bbXINSs. | [0.4] | Kaplan & van Kerkwijk (2009b) | ||||
| B0154+61 | [1.7] | Gonzalez et al. (2004) | ||||
| J07203125bbXINSs. | [0.4] | Haberl et al. (2006) | ||||
| J08064123bbXINSs. | [0.2] | Kaplan & van Kerkwijk (2009a) | ||||
| J08474316 | [3.4] | Kaplan et al. (2009) | ||||
| J18460257 | [5.2] | Kaplan et al. (2009) | ||||
| J1308+2127bbXINSs. | [0.5] | Schwope et al. (2007) | ||||
| J11196127 | [8.4] | Safi-Harb & Kumar (2008) | ||||
| J04205022bbXINSs. | [0.3] | Haberl et al. (2004) | ||||
| J18460258 | [6.0] | Livingstone et al. (2011) | ||||
| J18191458 | [3.6] | Rea et al. (2009a) | ||||
| J17343333 | [6.1] | Olausen et al. (2010) | ||||
| J18141744 | Pivovaroff et al. (2000) | |||||
| J17183718 | [4.5] | This work | ||||
| J18470130 | McLaughlin et al. (2003) |
PSR J17183718 ’s X-ray spectrum is soft and thermal, and is well fit by a blackbody model. Fitting its summed spectrum with a blackbody model, we found a high blackbody temperature of eV (Table 2), and a corresponding best-fit blackbody radius of km. Such an emission radius is consistent with radiation from hot spots. However, it is not consistent with polar caps heated by return currents because of the unusually high X-ray efficiency (). By contrast, models for polar-cap heating predict that no more than of the spin-down luminosity should be converted to thermal radiation (Harding & Muslimov 2001). Note that if the distance is larger than 4.5 kpc, this conclusion is only strengthened. Indeed at 10 kpc, . Based on the confidence contours of and (left panel of Figure 3), we cannot completely exclude a blackbody fit of eV and km. However, the measured 52%13% area pulsed fraction suggests that the surface temperature of the pulsar cannot be uniform. Given the pulsar’s spin-down age of 34 kyr, a surface temperature of 140 eV is still higher than what one would expect (60–90 eV, Page et al. 2006) from a minimum cooling model for the neutron star surface without considering the effects of the magnetic field. Interestingly, the 186 eV best-fit blackbody temperature is similar to those found for the high- PSRs J11196127, J17343333, J18191458 (see Table 4 for details and references) and the transient AXP XTE J1810197 when it was in quiescence between 1980 and 1993 (Gotthelf et al. 2004, eV).
On the other hand, fitting the spectrum with a NSA model leads to a best-estimated surface temperature of 75–97 eV (assuming a neutron star mass of 1.4, a local radius of 10 km, and a pulsar distance of 4.5–10 kpc), consistent with standard cooling. We note, however, that the magnetic field strength assumed in the NSA model is G, almost one order of magnitude smaller than the spin-down-inferred value. Therefore, the results of the NSA model fit should be taken with caution.
Attempting to explain the X-ray thermal emission observed from magnetars, XINSs and some high- pulsars, Arras et al. (2004), Pons et al. (2007) and Aguilera et al. (2008) constructed neutron-star cooling models in which pulsars with magnetic fields higher than G are significantly heated by field decay. The key evidence to support this theory is an intriguing possible correlation found between the pulsar’s blackbody temperature and spin-down magnetic field () based on a sample of magnetars, XINSs and some RPPs (Pons et al. 2007). However, their analysis did not consider high- RPPs. Searches for evidence of magnetic-field-decay heating have been conducted on several high- pulsars, e.g., PSRs J18141744 (Pivovaroff et al. 2000), J18470130 (McLaughlin et al. 2003), B0154+61 (Gonzalez et al. 2004), J11196127 (Gonzalez et al. 2005), J17183718 (Kaspi & McLaughlin 2005), B1916+14 (Zhu et al. 2009) and J17343333 (Olausen et al. 2010), and X-ray counterparts were found in some cases. Their spectra, however, have not yet been sufficiently well constrained to prove the existence of significant magnetic-field-decay heating. For a recent review on high-magnetic-field pulsars, see Ng & Kaspi (2010).
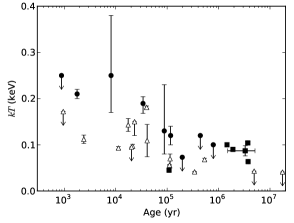
With our new data and spectral analysis of PSR J17183718 , we are unable to confirm that it is heated by magnetic field decay. This is mainly because the non-magnetized neutron star cooling models predict a large range of surface temperatures for a given pulsar age. However, we can compare the surface temperatures of several high- RPPs with those of normal RPPs, provided that the temperatures were measured using the same spectral model. In Figure 5, we plot blackbody versus age for a collection of pulsars including some high- pulsars (see Table 4). From this plot, one can see that the blackbody temperatures of the high- pulsars appear to be in general higher than those of the normal pulsars.
We also looked for the same - correlation showed by Pons et al. (2007) in a versus plot, but the temperatures of the pulsars are too scattered to discern a trend. This could be because our sample has a small range of but a large range of ages.
Note that three pulsars listed in Table 4 (PSRs B1929+10, B0355+54 and J13576449) are not plotted in Figure 4. This is because they all exhibit a large with very small blackbody radius, km, consistent with return-current heating. For the other RPPs, we cannot rule out the possibility that their blackbody temperatures are also higher because of return currents, but these sources nevertheless provide interesting upper limits on any non-return current thermal emission. On the other hand, return-current heating is unlikely to be present from the high- PSRs and XINSs. This is because most of them, including PSR J17183718 , ( G, see Table 4) have an X-ray efficiency . Such a high X-ray efficiency is clearly inconsistent with return-current heating (Harding & Muslimov 2001). Also note that the X-ray spectra of some pulsars, such as PSRs B105552, B0656+14 and J0633+1746, show evidence of thermal emission from both a hot spot and a much cooler neutron star surface; in these cases, only the of the cool surface was used.
In summary, our Chandra observations of PSR J17183718 have revealed, for the first time, X-ray pulsations at the pulse period, as well as a thermal spectrum of blackbody temperature somewhat higher than for other RPPs having the same age. We have found a high bolometric to spin-down luminosity ratio, 0.3 for a distance of 4.5 kpc, and higher for more realistic, larger distances. Although we cannot rule out standard passive cooling, as a model fit with an NSA model yields a lower surface temperature, we have considered the possibility that PSR J17183718 exhibits enhanced thermal emission due to magnetic-field decay, as predicted by models of magneto-thermal evolution (Arras et al. 2004; Pons et al. 2007; Aguilera et al. 2008). We have compiled such measurements for the other high- and low- RPPs, and find a hint that those of higher are generally hotter than low- pulsars of the same age. However deeper observations of high- and low- pulsars are required to confirm this possibility.
References
- Aguilera et al. (2008) Aguilera, D. N., Pons, J. A., & Miralles, J. A. 2008, ApJ, 673, L167
- Alpar (2007) Alpar, M. A. 2007, Ap&SS, 308, 133
- Arras et al. (2004) Arras, P., Cumming, A., & Thompson, C. 2004, ApJ, 608, L49
- Becker et al. (2004) Becker, W., Weisskopf, M. C., Tennant, A. F., Jessner, A., Dyks, J., Harding, A. K., & Zhang, S. N. 2004, ApJ, 615, 908
- Burwitz et al. (2003) Burwitz, V., Haberl, F., Neuhäuser, R., Predehl, P., Trümper, J., & Zavlin, V. E. 2003, A&A, 399, 1109
- Camilo et al. (2006) Camilo, F., Ransom, S., Halpern, J., Reynolds, J., Helfand, D., Zimmerman, N., & Sarkissian, J. 2006, Nature, 442, 892
- Camilo et al. (2007) Camilo, F., Ransom, S. M., Halpern, J. P., & Reynolds, J. 2007, ApJ, 666, L93
- Cordes & Lazio (2002) Cordes, J. M., & Lazio, T. J. W. 2002, astro-ph/0207156
- de Jager (1994) de Jager, O. C. 1994, ApJ, 436, 239
- De Luca et al. (2005) De Luca, A., Caraveo, P. A., Mereghetti, S., Negroni, M., & Bignami, G. F. 2005, ApJ, 623, 1051
- Duncan & Thompson (1992) Duncan, R. C., & Thompson, C. 1992, ApJ, 392, L9
- Esposito et al. (2010) Esposito, P., et al. 2010, MNRAS, 405, 1787
- Gaensler et al. (2008) Gaensler, B. M., Madsen, G. J., Chatterjee, S., & Mao, S. A. 2008, PASA, 25, 184
- Gaensler et al. (2004) Gaensler, B. M., van der Swaluw, E., Camilo, F., Kaspi, V. M., Baganoff, F. K., Yusef-Zadeh, F., & Manchester, R. N. 2004, ApJ, 616, 383
- Garmire et al. (2003) Garmire, G. P., Bautz, M. W., Ford, P. G., Nousek, J. A., & Ricker, G. R. 2003, Proc. SPIE, 4851, 28
- Gavriil et al. (2008) Gavriil, F. P., Gonzalez, M. E., Gotthelf, E. V., Kaspi, V. M., Livingstone, M. A., & Woods, P. M. 2008, Science, 319, 1802
- Gavriil et al. (2002) Gavriil, F. P., Kaspi, V. M., & Woods, P. M. 2002, Nature, 419, 142
- Gonzalez et al. (2010) Gonzalez, M. E., Dib, R., Kaspi, V. M., Woods, P. M., Tam, C. R., & Gavriil, F. P. 2010, ApJ, 716, 1345
- Gonzalez et al. (2005) Gonzalez, M. E., Kaspi, V. M., Camilo, F., Gaensler, B. M., & Pivovaroff, M. J. 2005, ApJ, 630, 489
- Gonzalez et al. (2004) Gonzalez, M. E., Kaspi, V. M., Lyne, A. G., & Pivovaroff, M. J. 2004, ApJ, 610, L37
- Gonzalez et al. (2006) Gonzalez, M. E., Kaspi, V. M., Pivovaroff, M. J., & Gaensler, B. M. 2006, ApJ, 652, 569
- Gotthelf et al. (2004) Gotthelf, E. V., Halpern, J. P., Buxton, M., & Bailyn, C. 2004, ApJ, 605, 368
- Gotthelf et al. (2002) Gotthelf, E. V., Halpern, J. P., & Dodson, R. 2002, ApJ, 567, L125
- Haberl (2007) Haberl, F. 2007, Ap&SS, 181
- Haberl et al. (2006) Haberl, F., Turolla, R., de Vries, C. P., Zane, S., Vink, J., Méndez, M., & Verbunt, F. 2006, A&A, 451, L17
- Haberl et al. (2004) Haberl, F., et al. 2004, A&A, 424, 635
- Harding & Muslimov (2001) Harding, A. K., & Muslimov, A. G. 2001, ApJ, 556, 987
- Hobbs et al. (2004) Hobbs, G., Lyne, A. G., Kramer, M., Martin, C. E., & Jordan, C. 2004, MNRAS, 353, 1311
- Ibrahim et al. (2004) Ibrahim, A. I., et al. 2004, ApJ, 609, L21
- Israel et al. (2010) Israel, G. L., et al. 2010, MNRAS, 408, 1387
- Kaneko et al. (2010) Kaneko, Y., et al. 2010, ApJ, 710, 1335
- Kaplan et al. (2009) Kaplan, D. L., Esposito, P., Chatterjee, S., Possenti, A., McLaughlin, M. A., Camilo, F., Chakrabarty, D., & Slane, P. O. 2009, MNRAS, 400, 1445
- Kaplan & van Kerkwijk (2005) Kaplan, D. L., & van Kerkwijk, M. H. 2005, ApJ, 628, L45
- Kaplan & van Kerkwijk (2009a) Kaplan, D. L., & van Kerkwijk, M. H. 2009a, ApJ, 705, 798
- Kaplan & van Kerkwijk (2009b) —. 2009b, ApJ, 692, L62
- Kaspi (2007) Kaspi, V. M. 2007, Ap&SS, 308, 1
- Kaspi (2010) Kaspi, V. M. 2010, Proceedings of the National Academy of Science, 107, 7147
- Kaspi et al. (2003) Kaspi, V. M., Gavriil, F. P., Woods, P. M., Jensen, J. B., Roberts, M. S. E., & Chakrabarty, D. 2003, ApJ, 588, L93
- Kaspi & McLaughlin (2005) Kaspi, V. M., & McLaughlin, M. A. 2005, ApJ, 618
- Kaspi et al. (2006) Kaspi, V. M., Roberts, M. S. E., & Harding, A. K. 2006, in Compact Stellar X-ray Sources, ed. W. H. G. Lewin & M. van der Klis (Cambridge: Cambridge Univ. Press)
- Kondratiev et al. (2009) Kondratiev, V. I., McLaughlin, M. A., Lorimer, D. R., Burgay, M., Possenti, A., Turolla, R., Popov, S. B., & Zane, S. 2009, ApJ, 702, 692
- Kuiper & Hermsen (2009) Kuiper, L., & Hermsen, W. 2009, A&A, 501, 1031
- Kumar & Safi-Harb (2008) Kumar, H. S., & Safi-Harb, S. 2008, ApJ, 678, L43
- Levin et al. (2010) Levin, L., et al. 2010, ApJ, 721, L33
- Livingstone et al. (2010) Livingstone, M. A., Kaspi, V. M., & Gavriil, F. P. 2010, ApJ, 710, 1710
- Livingstone et al. (2011) Livingstone, M. A., Ng, C.-Y., Kaspi, V. M., Gavriil, F. P., & Gotthelf, E. V. 2011, ApJ, 730, 66
- Manzali et al. (2007) Manzali, A., De Luca, A., & Caraveo, P. A. 2007, ApJ, 669, 570
- McGowan et al. (2007) McGowan, K. E., Vestrand, W. T., Kennea, J. A., Zane, S., Cropper, M., & Córdova, F. A. 2007, Ap&SS, 308, 309
- McGowan et al. (2006) McGowan, K. E., Zane, S., Cropper, M., Vestrand, W. T., & Ho, C. 2006, ApJ, 639, 377
- McLaughlin et al. (2003) McLaughlin, M. A., et al. 2003, ApJ, 591, L135
- Mereghetti (2008) Mereghetti, S. 2008, A&A Rev., 15, 225
- Misanovic et al. (2008) Misanovic, Z., Pavlov, G. G., & Garmire, G. P. 2008, ApJ, 685, 1129
- Ng et al. (2008) Ng, C.-Y., Slane, P. O., Gaensler, B. M., & Hughes, J. P. 2008, ApJ, 686, 508
- Ng & Kaspi (2010) Ng, C.-Y., & Kaspi, V. M. 2010, ArXiv:1010.4592
- Ng et al. (2007) Ng, C.-Y., Romani, R. W., Brisken, W. F., Chatterjee, S., & Kramer, M. 2007, ApJ, 654, 487
- Ng et al. (2011) Ng, C.-Y., et al. 2011, ApJ, 729, 131
- Olausen et al. (2010) Olausen, S. A., Kaspi, V. M., Lyne, A. G., & Kramer, M. 2010, ApJ, 725, 985
- Page et al. (2006) Page, D., Geppert, U., & Weber, F. 2006, Nuclear Physics A, 777, 497
- Pavlov et al. (2008) Pavlov, G. G., Kargaltsev, O., & Brisken, W. F. 2008, ApJ, 675, 683
- Pavlov et al. (1995) Pavlov, G. G., Shibanov, Y. A., Zavlin, V. E., & Meyer, R. D. 1995, in The Lives of the Neutron Stars (NATO ASI Series), ed. A. Alpar, Ü. Kiziloğlu, & J. van Paradis (Dordrecht: Kluwer), 71–90
- Pivovaroff et al. (2000) Pivovaroff, M., Kaspi, V. M., & Camilo, F. 2000, ApJ, 535, 379
- Pons et al. (2007) Pons, J. A., Link, B., Miralles, J. A., & Geppert, U. 2007, Physical Review Letters, 98, 071101
- Rea et al. (2008) Rea, N., Zane, S., Turolla, R., Lyutikov, M., & Götz, D. 2008, ApJ, 686, 1245
- Rea et al. (2009a) Rea, N., et al. 2009a, ApJ, 703, L41
- Rea et al. (2009b) —. 2009b, MNRAS, 396, 2419
- Rea et al. (2010) —. 2010, Science, 330, 944
- Safi-Harb & Kumar (2008) Safi-Harb, S., & Kumar, H. S. 2008, ApJ, 684, 532
- Schwope et al. (2007) Schwope, A. D., Hambaryan, V., Haberl, F., & Motch, C. 2007, Ap&SS, 308, 619
- Slane et al. (2004) Slane, P., Helfand, D. J., van der Swaluw, E., & Murray, S. S. 2004, ApJ, 616, 403
- Thompson & Duncan (1995) Thompson, C., & Duncan, R. C. 1995, MNRAS, 275, 255
- Thompson & Duncan (1996) Thompson, C., & Duncan, R. C. 1996, ApJ, 473, 322
- Thompson et al. (2002) Thompson, C., Lyutikov, M., & Kulkarni, S. R. 2002, ApJ, 574, 332
- Turolla (2009) Turolla, R. 2009, in Astrophysics and Space Science Library, ed. W. Becker, Vol. 357, 141
- van der Horst et al. (2010) van der Horst, A. J., et al. 2010, ApJ, 711, L1
- van Kerkwijk & Kaplan (2008) van Kerkwijk, M. H., & Kaplan, D. L. 2008, ApJ, 673, L163
- Weisskopf et al. (2004) Weisskopf, M. C., O’Dell, S. L., Paerels, F., Elsner, R. F., Becker, W., Tennant, A. F., & Schwarz, D. A. 2004, ApJ, 601, 1050
- Woods & Thompson (2006) Woods, P. M., & Thompson, C. 2006, in Compact Stellar X-ray Sources, ed. W. H. G. Lewin & M. van der Klis (Cambridge : Cambridge Univ. Press)
- Woods et al. (2004) Woods, P. M., et al. 2004, ApJ, 605, 378
- Zane et al. (2005) Zane, S., Cropper, M., Turolla, R., Zampieri, L., Chieregato, M., Drake, J. J., & Treves, A. 2005, ApJ, 627, 397
- Zavlin et al. (1996) Zavlin, V. E., Pavlov, G. G., & Shibanov, Y. A. 1996, A&A, 315, 141
- Zhu et al. (2009) Zhu, W., Kaspi, V. M., Gonzalez, M. E., & Lyne, A. G. 2009, ApJ, 704, 1321