High-energy break-up of 6Li as a tool to study the Big-Bang nucleosynthesis reaction 2H(,)6Li
Abstract
The recently claimed observations of non-negligible amounts of 6Li in old halo stars have renewed interest in the Big-Bang Nucleosynthesis (BBN) of 6Li. One important ingredient in the predicted BBN abundance of 6Li is the low-energy 2H(,)6Li cross section. Up to now, the only available experimental result for this cross section showed an almost constant astrophysical -factor below 400 keV, contrary to theoretical expectations. We report on a new measurement of the 2H(,)6Li reaction using the break-up of 6Li at 150 MeV. Even though we cannot separate experimentally the Coulomb contribution from the nuclear one, we find clear evidence for Coulomb-nuclear interference by analyzing the scattering-angular distributions. This is in-line with our theoretical description which indicates a drop of the -factor at low energies as predicted also by most other models. Consequently, we find even lower upper limits for the calculated primordial 6Li abundance than before.
pacs:
25.40.Lw,25.60.-t, 25.70.De, 26.65.+tI Introduction
The Big–Bang model of the Universe is mainly supported by three observational evidences: the expansion of the Universe, the Cosmic Microwave Background (CMB), and the primordial or Big-Bang Nucleosynthesis (BBN) of light nuclei like 2H, 3,4He, and 7Li with one free parameter, the baryonic density of the Universe, . Recently, a precise value for this free parameter (h2=0.022600.00053) has been deduced from the analysis of the anisotropies in the CMB as observed by the WMAP satellite WMAP . Using the best available nuclear reaction rates, this now allows to make precise predictions for the primordial abundances of these light nuclei. A comparison between calculations and observations reveals good agreement for helium, excellent agreement for deuterium, and a discrepancy (by a factor of ) for 7Li Coc04 ; Cyb08 ; Coc10 . Possible reasons for this discrepancy for 7Li have recently been discussed e.g. by Spite and Spite Spi10 .
In 2006, high-resolution observations of Li absorption lines in some very old halo stars have led the authors to claim evidence for large primordial abundances also of the weakly-bound isotope 6Li Asp06 . The 6Li/7Li ratios of were found to be about three orders of magnitude larger than the BBN-calculated value of 6Li/7Li . This observation has triggered many studies to resolve the discrepancy either by considering an early 6Li formation in primitive dwarf galaxies at high redshift in a hierarchical-structure formation context Rol06 , in situ by solar-like flares TT07 , or in terms of physics beyond the standard model of particle physics (see, e.g., Refs. Kus07 ; Eli05 ; Jed06 ). More recently, however, Cayrel et al. Cay07 and Steffen et al. Ste10 have pointed out that line asymmetries similar to those created by a 6Li blend could also be produced by convective Doppler shifts in stellar atmospheres. Similarly, a recent study of Garcia Perez et al. Gar09 could not claim any significant detection of 6Li in metal-poor stars. So, presently the debate is open. More stellar observations are required to solve this question (see Asplund and Lind Asp10 ).
Predictions for the production of 6Li in BBN require precise measurements of the 2H(,)6Li reaction rate, the key production mechanism. In BBN, this reaction occurs at energies in the range 50 keV 400 keV Ser04 . At higher energies, this reaction has been studied carefully in direct kinematics: at energies above 1 MeV by Robertson et al. Rob81 , and by Mohr et al. Moh94 in the energy range around the dominant resonance at MeV. At BBN energies, however, direct measurements are difficult due to extremely low cross sections (about 29 pb at keV). An attempt by Cecil et al. Cec96 at MeV yielded only an upper limit for the -factor of MeV b which is more than an order of magnitude higher than present estimates. A straightforward solution to overcome this problem is offered by the indirect method of Coulomb dissociation (CD). As will be shown below, the dominant multipolarity involved is 2. When bombarding a high- target like 208Pb with a medium-energy ( 150 MeV) 6Li beam, an intense flux of virtual 2 photons is created that dissociates 6Li into 2H and with a greatly enhanced cross section. From the energy-differential CD cross section, the radiative-capture one can be calculated easily Bau86 provided that the multipolarity of the respective transition is known and that higher-order electromagnetic or nuclear contributions can be either ignored or taken into account quantitatively.
Kiener et al. Kie91 have investigated the 2HLi reaction by means of the CD method employing 26 MeV 6Li projectiles breaking up into D+ in the Coulomb field of a 208Pb nucleus. Referring to a theoretical paper by Shyam et al. Shy91 , Kiener et al. have claimed that their measurement is largely free from nuclear background (the same assumption was made in a later reevaluation of the same dataset Iga00 ). While the astrophysical -factor derived in Ref. Kie91 seems to agree well with theoretical predictions at and above the resonance, a puzzling result emerged below the resonance: the experimental data suggest a rather constant -factor in the astrophysically interesting region below 400 keV; most theoretical curves, however, drop with decreasing energy Kha98 . As we will show in the present paper, it is likely that this constant -factor is due to nuclear processes that cannot be ignored.
We report in this article on a new break-up measurement performed at the SIS-18 heavy-ion synchrotron at GSI (Helmholtzzentrum für Schwerionenforschung in Darmstadt, Germany) using a higher-energy (150 MeV) 6Li beam. This higher beam energy should have several advantages compared to the one used by Kiener et al.: (i) the stronger forward focusing allows for a more complete angular coverage; (ii) CD should be enhanced relative to the nuclear contribution. In addition, we have developed a comprehensive theoretical model of electromagnetic and nuclear break-up processes that allows to interprete the measured data in detail. We will show below, however, that it is unfortunately not possible to separate experimentally electromagnetic and nuclear contributions. Nevertheless, most of the features of the measured data can be well explained by our model, thus giving our calculated 2H()6Li cross sections a firm experimental basis.
II Theoretical predictions
II.1 Radiative-capture reaction
The cross section of the 2H()6Li reaction at energies MeV is dominated by radiative 2 capture from waves in the H channel into the ground state of 6Li via a prominent resonance at MeV. In comparison, 1 transitions from waves to the 6Li ground state are strongly suppressed by the isospin selection rule for nuclei due to the almost equal charge-to-mass ratio of the deuteron and the particle. Only at very low energies ( keV), the 1 contribution is expected to become larger than the 2 capture since the penetrabilities in and waves exhibit a different energy dependence Rob81 .
In the past, a number of different theoretical approaches were considered for the calculation of the low-energy 2H()6Li capture cross section, see Kha98 and references therein. They comprise, e.g., simple potential models and microscopic cluster models using the resonating group method (RGM) or the generator coordinate method (GCM). Provided that the parameters of these models are well fitted to observable quantities like the binding and resonance energies in the 6Li system and that the asymptotic form of the bound state wave function is correctly taken into account, good agreement between the predictions for the low-energy cross section is found. This shows that the radiative capture at energies below the resonance is essentially an extranuclear process and that details of the interior wave function are less important.
In the present work we employ a potential model for the 6Li system that provides the -factor for the 2H()6Li reaction and, at the same time, can be used in modelling the breakup reaction when 6Li is scattered on a Pb nucleus at MeV. This model assumes that 6Li is described by two interacting clusters, and 2H, without internal structure. Bound and scattering wave functions in the relevant partial waves, characterized by orbital angular momentum and total angular momentum , are obtained by solving the appropriate radial Schrödinger equation with -2H potentials that contain a central part of Woods-Saxon form
| (1) |
and a spin-orbit part of derivative Woods-Saxon form
| (2) |
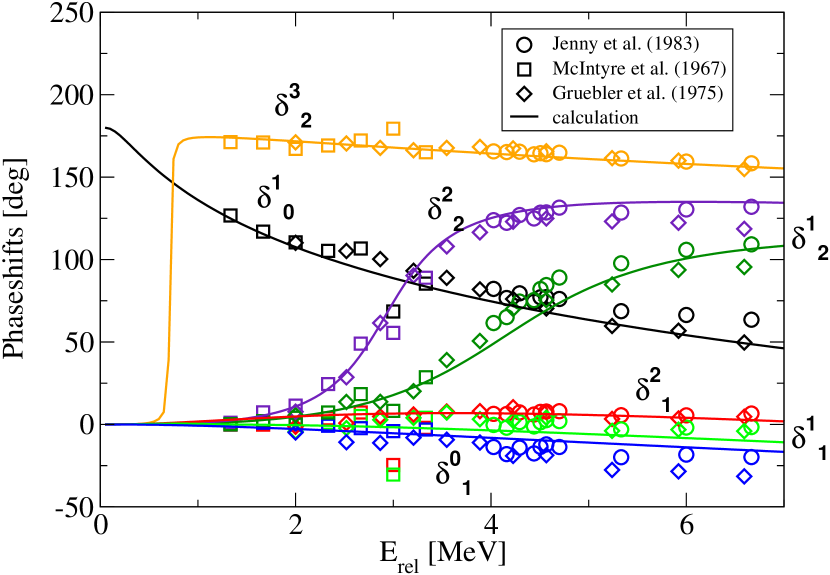
with fm. The radius is given by fm with ; fm denotes the diffuseness parameter. The depths were set to 60.712 MeV for the ground state () and 56.7 MeV for all other partial waves (). For the spin-orbit part a depth of 2.4 MeV was used for the relevant partial waves . These values were obtained by adjusting the parameters as to reproduce the experimental values for the binding energy MeV of 6Li and the resonance energy with respect to the +2H threshold. This choice of parameters also describes the low-energy -2H experimental scattering phase shifts very well, see Fig. 1.
The cross section of the radiative capture reaction is calculated in the present model with the usual long-wavelength approximation of the 1 and 2 multipole operators where denotes the electron charge and is the radius vector between and deuteron. The effective charge numbers
| (3) |
depend on the charge numbers and masses of the two clusters. The 1 effective charge number does not vanish since experimental values for the masses are used. However, the 2 contribution dominates over most of the range of energies with a pronounced peak at the position of the resonance. Only at energies below 110 keV the 1 contribution exceeds the 2 contribution. We display the energy dependences of the two relevant multipole contributions to the -factor below in Fig. 9 of Sect.IV.
II.2 Breakup reaction
The theoretical description of the breakup reaction 208Pb(6Li,H)208Pb is considerably more involved than that of the radiative capture reaction, in particular if both electromagnetic and nuclear breakup have to be included. The differential breakup cross section in the 6Li-208Pb c.m. system can be written in the general form
with reduced masses and relative momenta . denotes the solid angle for the scattering of particles and in their c.m. system and is the c.m. energy in the fragment system after the breakup. In the initial state, 6Li is in the ground state with total angular momentum and . In the final state, the deuteron carries spin with projections . The cross section (II.2) determines the relative probability to find the two fragments with given momenta in the final state und thus can be used directly in a Monte-Carlo simulation of the breakup reaction.
The main task is to calculate the T-matrix element that contains all the relevant information on the breakup process. In distorted wave Born approximation (DWBA) it is given by
with the 6Li ground state wave function and the wave function for the relative motion of the fragments in the continuum. These two functions are given by the solutions of the Schrödinger equation as in the calculation of the radiative-capture cross section. The distorted waves describe the scattering of the projectile on the target. They can be found by solving the Schrödinger equation for the Li-Pb scattering with the optical potential that only depends on the distance between Li and Pb. In contrast, is the full many-body interaction potential. It is approximated by
separating Coulomb and nuclear contributions and introducing nuclear optical potentials and for the -Pb and 2H-Pb interaction, respectively. Similarly we have
| (7) |
with . Since both potentials contain Coulomb and nuclear contributions additively, it is possible to separate the T-matrix element into a Coulomb and a nuclear part as
| (8) |
In general, Coulomb and nuclear contributions to the breakup amplitude can interfere.
In the breakup experiment, the projectile velocity relative to the target is large and the fragments are observed at small forward scattering angles with respect to the beam axis. Thus it is sufficient to replace the distorted waves appearing in Eq. (II.2) by their eikonal approximation, i.e.
with the momentum transfer
| (10) |
and the phase function
| (11) |
where the coordinate vector has been decomposed as
| (12) |
and denotes the beam direction. The Coulomb part of the phase function can be calculated analytically. In order to avoid a divergent result at small impact parameters, , the Coulomb potential of a point-like target charge in Eq. (7) is replaced by that of a homogeneous sphere. In the eikonal approximation, the Coulomb and nuclear T-matrix elements can be written as
| (13) |
with the Coulomb form factor
and the nuclear form factor
that can be both decomposed into multipoles . Using the method of steepest descent, the multipole components of the Coulomb form factor (II.2) are easily calculated. Neglecting the nuclear contribution in the phase function one obtains in lowest order the well-known Coulomb excitation functions in the semiclassical approximation. The nuclear optical potential in (11) leads to corrections that take, e.g., the absorption by the target nucleus into account; also, relativistic corrections are easily included, see Ref. Typ07 for details.
Since the 2 virtual photons are orders of magnitude more abundant than the 1 ones, the Coulomb contribution to the breakup is essentially sensitive only to the quadrupole contribution. (There is no monopole contribution in this case.) Contrary to electromagnetic 1 excitations, nuclear excitations are not suppressed by isospin selection rules. Nuclear processes for all multipolarities have, therefore, to be taken into account when modelling the break-up of 6Li into H at about 150 MeV. In the present work, we included nuclear excitations because higher multipoles are expected to give only small contributions to the total breakup amplitude.
In order to obtain numerical results for the T-matrix elements, one has to specify the nuclear optical potentials that enter into the calculation. Unfortunately, there are no systematic optical- model potentials available describing the elastic scattering of , 2H and 6Li on a Pb target at MeV. Therefore, we generated the optical potentials from systematic optical-model potentials for nucleon-Pb elastic scattering and folded them with the matter distribution of the projectile and the fragments, respectively. These potentials were tuned to reproduce published elastic-scattering data at incident energies as close to 150 MeV as possible by multiplying the real and imaginary parts by scaling factors not too far from unity. Literature data have been used for the elastic scattering of 2H + 208Pb at 55 and 70 MeV Bet93 ; Oka98 , of + 208Pb at 120 MeV and 175 MeV Bon85 , and of 6Li + 208Pb at 100 MeV Schw00 .
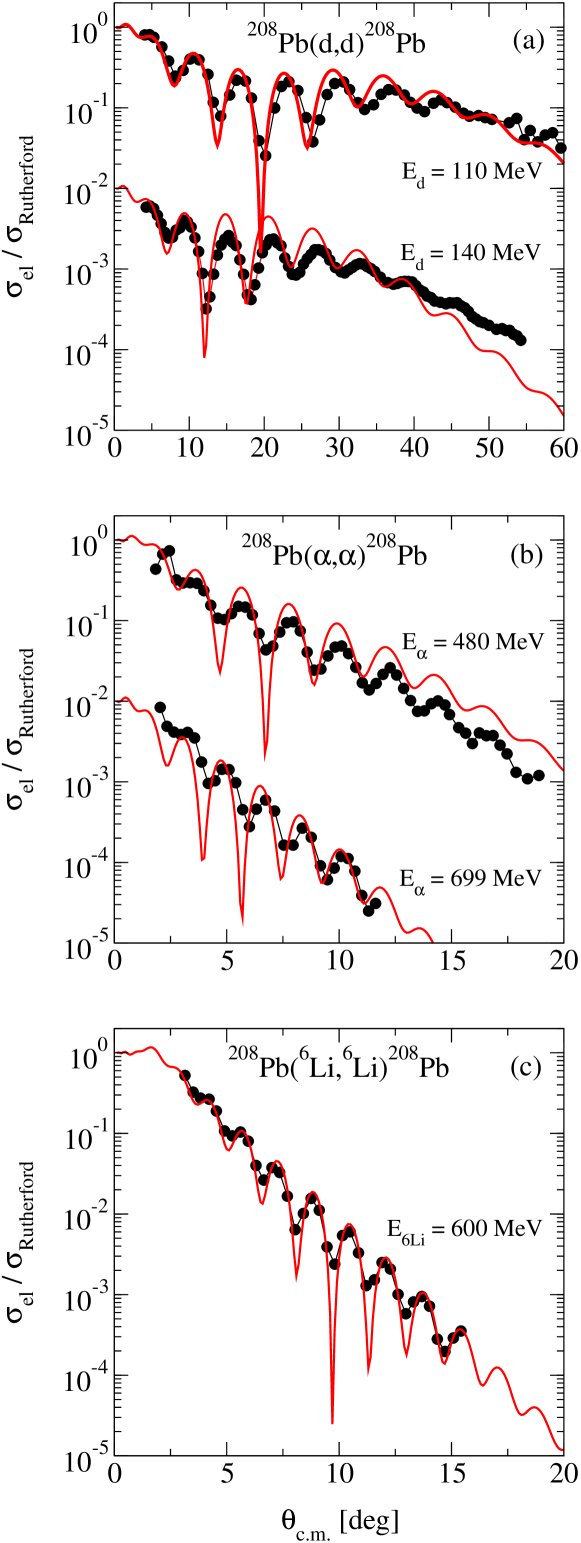
We found that deuteron and scattering on Pb were best described starting with the relativistic nucleon-nucleus potentials of Ref. CHC93 . In the case of 6Li-Pb scattering the non-relativistic optical-model potential from Ref. BDG98 for nucleon-nucleus scattering worked best. Fig. 2 shows measured and fitted elastic-scattering data for the three cases. The optical-model potentials, obtained by the procedure described above for the actual energy of the breakup experiment, are well fitted by a Woods-Saxon shape. Since mostly the outer region of the potential is important the fits were started at a radius of 7 fm. In Table 1 we give the numerical values of the depth, radius and diffuseness parameters for the real and imaginary parts.
| System | 6Li+208Pb | +208Pb | 2H+208Pb | |
|---|---|---|---|---|
| Vreal | [MeV] | 55.0407 | 48.0315 | 23.6250 |
| Rreal | [fm] | 7.4979 | 7.9014 | 7.9057 |
| areal | [fm] | 0.8665 | 0.8542 | 0.8984 |
| Vimag | [MeV] | 84.1720 | 45.4504 | 28.3867 |
| Rimag | [fm] | 7.3633 | 7.3763 | 7.3712 |
| aimag | [fm] | 0.8693 | 0.9020 | 0.9391 |
II.3 Predicted observables
The most meaningful observable that can illustrate the predictions from the above-sketched model of 6Li break-up is the scattering angle, , of the excited 6Li∗ before break-up, relative to the incoming 6Li beam. Fig. 3 depicts the expected distribution.
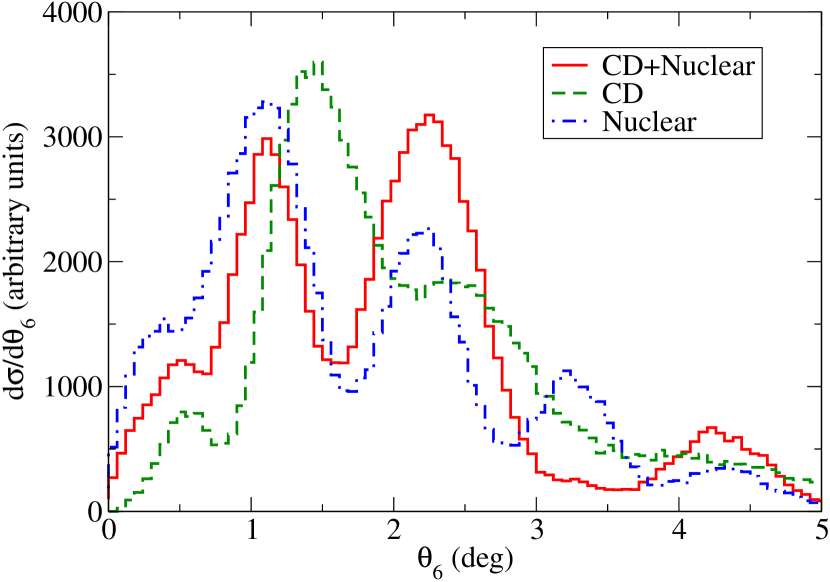
The figure clearly shows that pure nuclear, pure Coulomb, and total (CD+nuclear) distributions exhibit distinctly different peak structures. Pure Coulomb interaction has its most prominent peak where the other contributions show a minimum. Likewise, the total (CD+nuclear) distribution can be distinguished from a nuclear-only theory by the large amplitude of the most prominent peak (due to constructive CD-nuclear interference), and by the disappearance of the third maximum (due to destructive interference). In principle, these features should allow to separate the contributions from the individual interactions. However, the theoretical predictions have to be folded with the resolution and the acceptance of the experimental apparatus using the Monte-Carlo simulations described below in subsection III.2.
III Experimental procedure
III.1 Apparatus
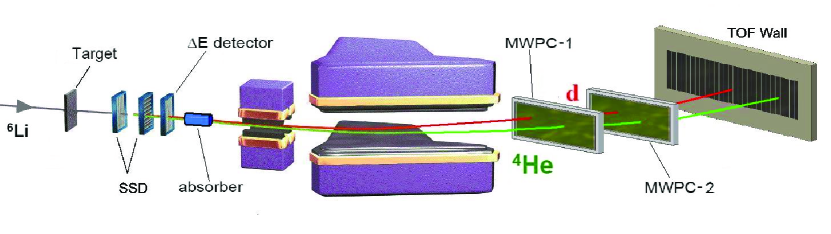
A schematic view of the set-up used is given in Fig. 4. A 208Pb target with 200 mg/cm2 thickness was bombarded by a primary 6Li beam of 150 MeV energy. The 6Li beam was produced by the SIS-18 synchrotron at GSI, separated from possible contaminant ions by using the FRS FRagment Separator Gei92 and transported to the standard target position of the kaon spectrometer KaoS Sen93 . The average 6Li beam intensity at the break-up target was of the order of 5x10⁴ per 4 sec spill. The beam had a width of 0.17(0.12) cm and an angular divergence of 4.4(4.4) mrad in x(y) direction at the target (1 widths).
The angles and positions as well as the energy losses of the outgoing particles, 2H and , were measured by two pairs of single-sided silicon strip detectors (SSD, 300 m thick, 100 m pitch) Iwa99 placed at distances of 15 and 30 cm, respectively, downstream from the target. From the detector pitch one can calculate a resolution of the 2H- opening angle in the laboratory, , of about 1%. Non-interacting 6Li beam particles were identified event by event with a 16-strip E detector located directly behind the SSD and stopped in a cylindrical Ta absorber (12 mm diameter, 20 mm length) placed behind the detector. Break-up events were discriminated from non-interacting 6Li-beam events by their energy-loss signals in the 16-strip E detector; an energy loss corresponding to 6Li was used as a trigger veto signal. Deuteron and momenta were analyzed with the large-acceptance KaoS spectrometer and were detected in two consecutive multi-wire proportional chambers (MWPC Iwa99 ) followed by a plastic-scintillator TOF wall consisting of 30 elements (each 7 cm wide and 2 cm thick). This plastic wall was used as a trigger detector for the data acquisition system. The KaoS magnets’ volume was filled with He gas at atmospheric pressure to reduce multiple scattering.
The coincident 2H and fragments resulting from break-up in the 208Pb target were identified by reconstructing their vertex at the target. This removed all break-up events in layers of matter other than the target. The 2H and momenta were determined from tracking them with GEANT through the MWPC and TOF wall behind KaoS. The incident angles in front of the magnets were known unambiguously from the SSD hits. While in the SSD each hit could be attributed to either 2H or by its energy deposition, the corresponding hits in the MWPC were attributed to the respective particle type by finding the optimum trajectory through the MWPC and the TOF wall. This was done in an iterative procedure that started with a test assignment of each hit to either or 2H and a test momentum for each of them. Both the momentum values and the assignments were then iteratively changed until the minimum squared deviation from the observed hits in all detectors downstream from the KaoS magnet were reached. This momentum reconstruction could be shown to be accurate within about . From the opening angles between the fragments and from their momenta, the relative energies, , between the 2H and particles in the c.m. system could be reconstructed.
III.2 Monte-Carlo simulations
It is obvious that the experimental apparatus imposes strong restrictions on the detection of the break-up particles, and 2H. This applies in particular to the angular acceptance, the energy and position resolution, and the detection efficiency. As a consequence, a meaningful comparison between theoretical predictions and experimental data can only be made using theoretical data filtered by the experimental set-up. To this end, we have modelled the entire set-up, starting in front of the 208Pb break-up target, in GEANT3 geant3 . As an event generator, the theoretical model described in the previous section was used. Input data were generated as statistically-distributed ensembles of 100,000 break-up“events” each that were distributed according to the calculated differential cross sections. The emittance of the 6Li beam (as measured without break-up target and without absorber) was imposed. Each break-up particle, and 2H, was followed through the remainder of the Pb target after the reaction vertex, the SSD detectors, the beamline exit window, the He-filled interior of the magnets with the magnetic field and the air behind KaoS before hitting the MWPC volumes and the TOF wall.
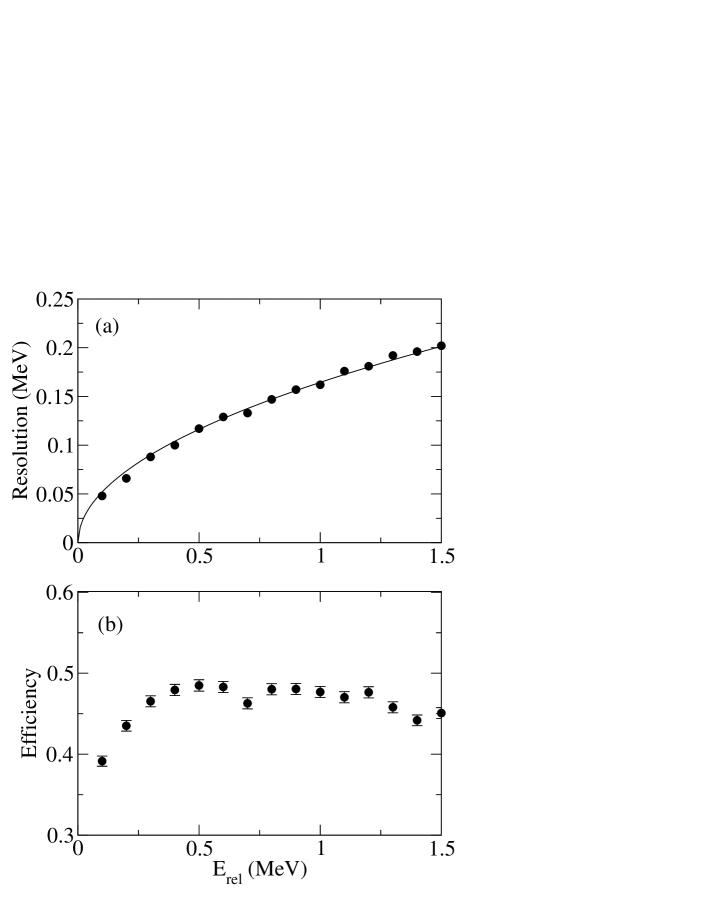
The Monte-Carlo simulations were used to obtain estimates of the resolution and the efficiency of our setup. As an example, we plot in Fig.5(a) the 1-resolution of . The data points were obtained by sending 10,000 events each with different values of (within a narrow bin of 0.1 MeV width for each case) into our setup and analyzing the outgoing particles with the same routines as in the experiment. From the same data sets, the number of counts gave an approximate estimate of the detection efficiency, shown in Fig.5(b). In the experiment, however, the detection efficiency is additionally limited by the small and strongly fluctuating energy deposition of deuterons in the MWPC. This latter quantity cannot be simulated easily, such that we had to normalize the number of observed and simulated counts. Therefore, our experiment does not allow to determine absolute cross sections, despite the fact that all incident 6Li ions were counted.
IV Experimental results
A relatively unbiased observable, based only on high-resolution SSD measurements, is the opening angle, , between the outgoing fragments 2H and . Fig. 6 shows this distribution, summed over values up to 1.5 MeV; this condition was also set for all other spectra shown below. The experimental data points are compared with the corresponding Monte-Carlo simulations for pure Coulomb (CD) and pure nuclear interactions as well as combined (CD+nuclear) interactions. Each simulated histogram was normalized to contain the same number of counts as the experimental spectrum, thus providing the single scaling factor used to normalize all simulated distributions.
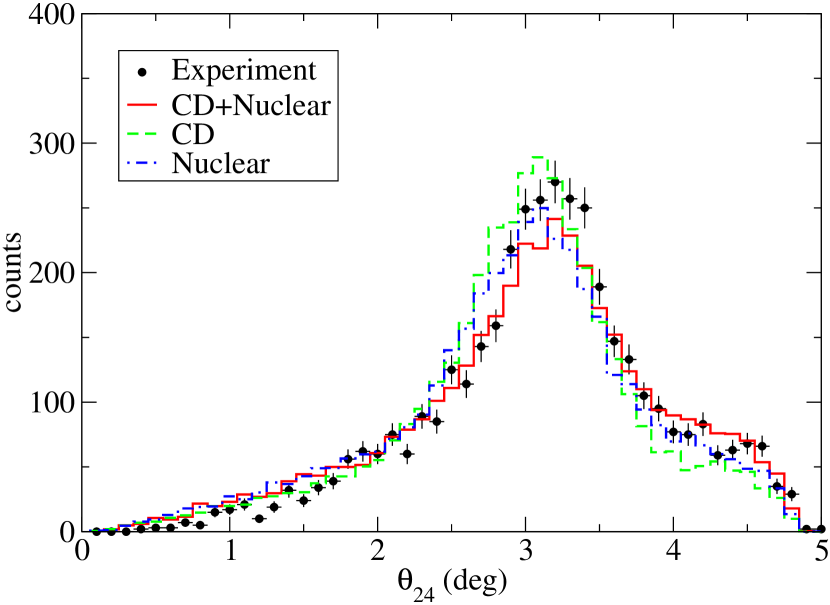
As seen in Fig. 6, the data are reasonably well reproduced by the simulations over their entire range. The 3+ resonance peak is clearly visible around 3 degrees; its angular width is well reproduced indicating that the simulation takes both the scattering and the finite angular resolution well into account. It is obvious, however, that one cannot distinguish between the different interactions on the basis of this angular distribution. We have therefore to search for an observable that is more sensitive to the type of interaction. In Fig. 3 above, we have shown that the observable should be very sensitive to the type of interaction.
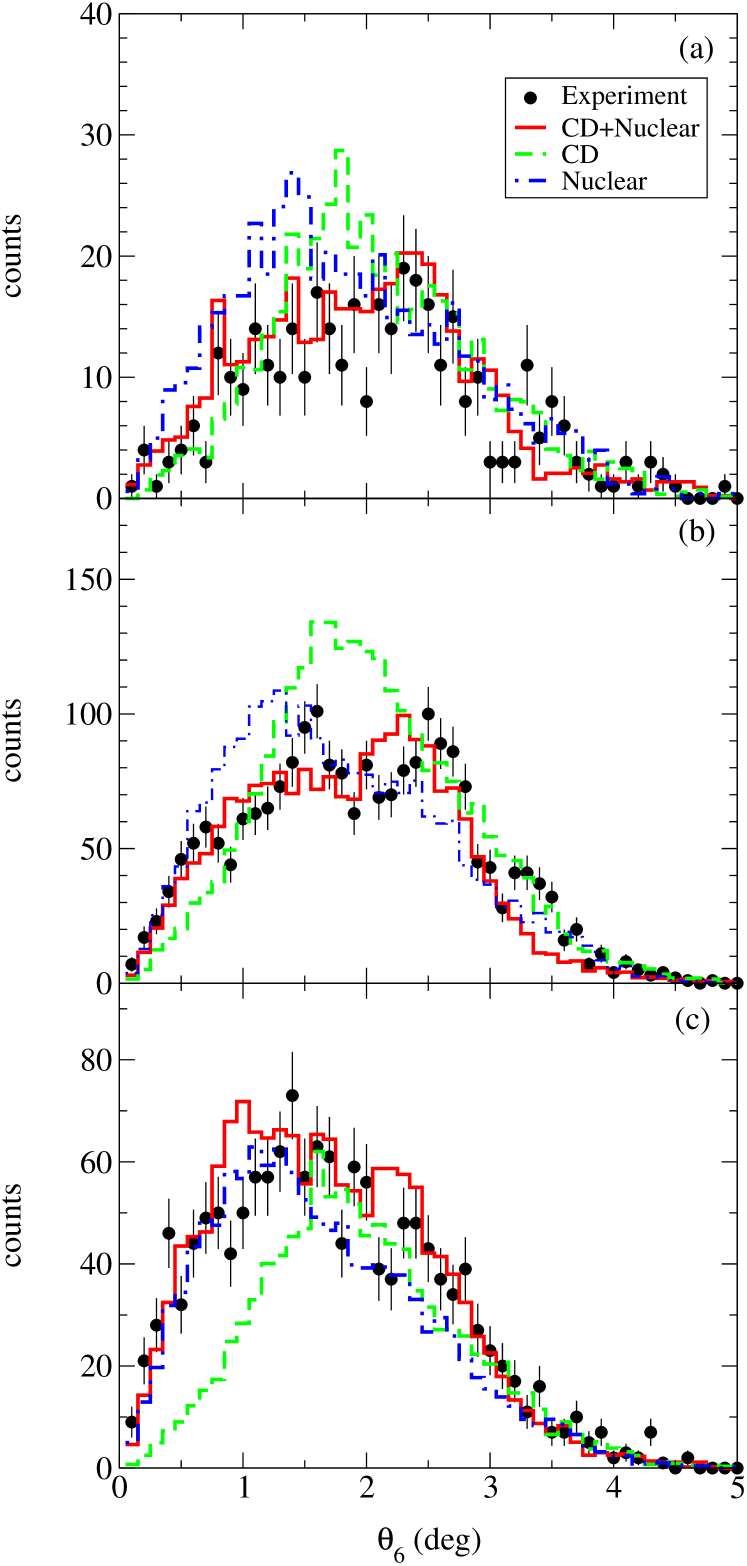
The experimental data for this observable are presented in Fig. 7. Panel (a) of Fig. 7 shows data for values below the resonance; panel (b) covers the resonance region, whereas panel (c) has been plotted for MeV. The finite KaoS acceptance cuts the distributions at about 4 degrees. The figure shows clearly that the observable is sensitive to the type of interaction. In all panels, the combined (CD+nuclear) interaction, including interference, reproduces most of the structures observed in the data points (red histograms). This is particularly true for the sub-resonance region, panel (a). The green histograms (CD-only) show single peaks at larger angles. The pure nuclear interaction (blue histograms) rises rapidly at small values of , in agreement with the measured data, but lacks the structures visible in the data points. The narrow peaks visible in the on-resonance data, panel (b), at values of of and degrees, are not perfectly reproduced by the (CD+nuclear) model and point to small deficiencies of the theoretical model. Nevertheless, Fig. 7 demonstrates that Coulomb-nuclear interference is at work and that the signs of the interference terms are correct. We also conclude that even at our incident energy of 150 MeV the nuclear break-up is dominant.
The angle-integrated energy-differential cross sections as a function of are shown in Fig. 8.
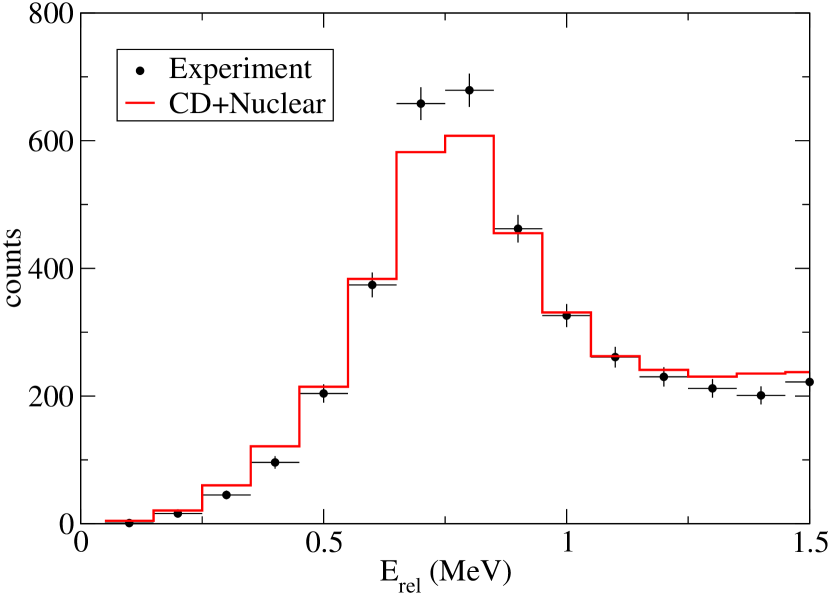
The full histogram was obtained from the (CD+nuclear) calculation convoluted by our GEANT simulation and normalised to the experimental yield. The points and the histogram represent the measured and predicted differential cross sections, respectively, as a function of . Our distribution is in very good agreement with the simulation in particular in the energy region below 400 keV. As we will show below (see Fig.10), the differential cross sections in this energy regime result mostly from nuclear interactions.
The astrophysically important quantity is the astrophysical -factor, , for the 2HLireaction. Since nuclear processes dominate, in particular for low , the determination of this quantity via an evaluation of the CD component in our break-up data is not feasible since. However, we have demonstrated above that our theoretical model describes well the measured cross sections, hence the astrophysical -factors from the present work are those from our theoretical model.
The resulting 1-, 2-, and total -factors are visualized in the upper part of Fig. 9 together with the previous CD data of Kiener et al. Kie91 and the direct data of Mohr et al. Moh94 and Robertson et al. Rob81 .
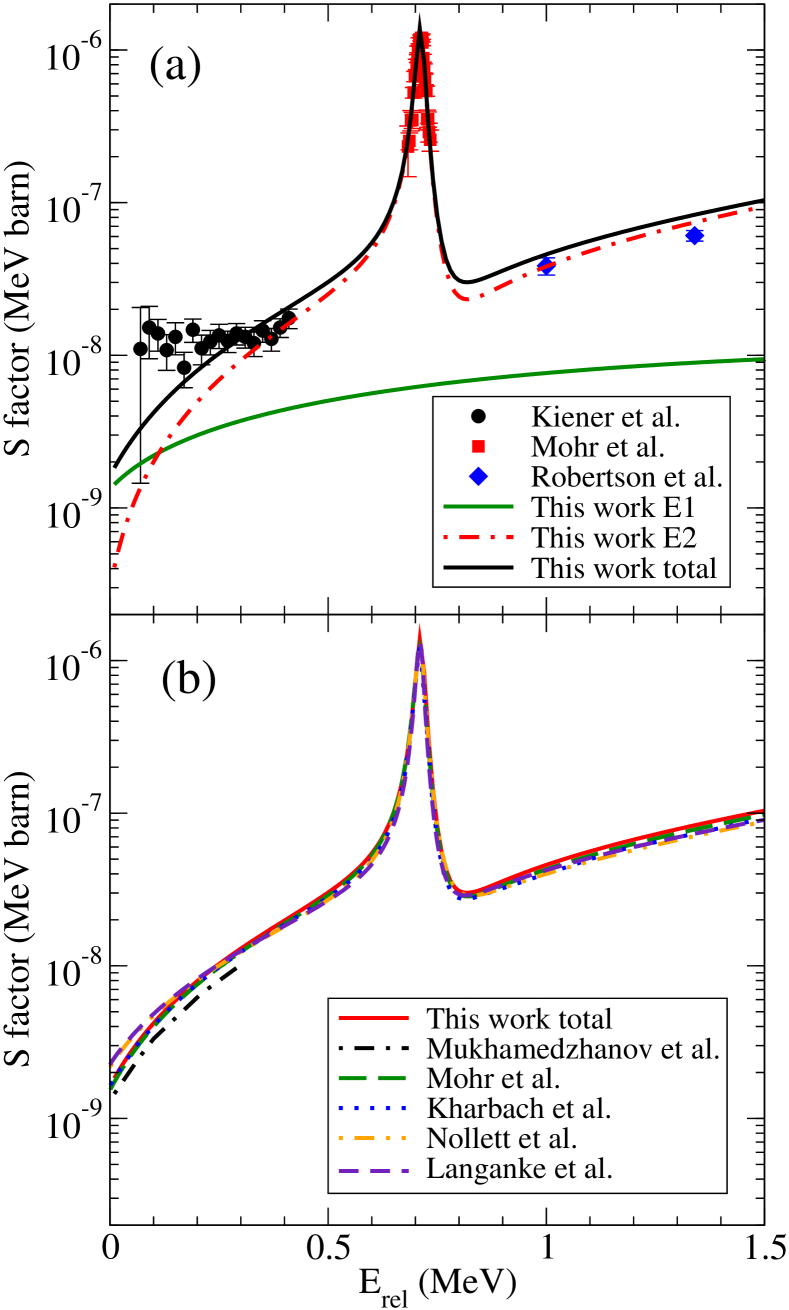
The present results for the 2-component are in good agreement with the direct measurements of Refs. Moh94 ; Rob81 in the resonance region and above which gives confidence in our model.
Another check of the validity of our treatment of the Coulomb part of the break-up reaction, described in Sect.II.1, can be done by comparing our calculated resonance parameters for the resonance with the experimental ones. In order to determine those parameters, we have calculated the theoretical capture cross section around the resonance in 1 keV steps and fitted a Breit-Wigner parametrization to the resonance. We obtain -widths of keV and meV, in good agreement with the literature values of keV and meV as cited by Mohr et al. Moh94 . Note that we have used a spectroscopic factor of unity. We will comment on the data points from the previous CD experiment Kie91 in the following section.
The direct 2HLireaction at very low energies is sensitive also to the 1 amplitude. In our experiment, this component cannot be constrained experimentally due to the weak flux of virtual 1 photons. We have therefore to rely exclusively on the theoretical model. At higher energies, however, Robertson et al. Rob81 could separate 1- and 2-components on the basis of measured angular distributions. Fig.1 in Rob81 shows that their theory seems to overestimate the 1 component. Our 1 curve is very close to Robertson’s so that we also seem to overestimate this component.
Several theoretical models for 6Li have been proposed to determine the shape and the magnitude of the energy dependence, such as potential models Lan86 ; Moh94 ; Typ07 , cluster-model calculations Kha98 , or ab-initio calculations Nol01 . Those predicted curves for S24 which include both 1- and 2-contributions are displayed together with the theoretical curve from this work in the lower panel of Fig. 9. As one can see in this figure, all the calculations shown –independent of their very different model assumptions– yield very similar curves. We have not included the theory of Blokhintsev et al. Blo06 ) because it was specifically tuned to approach the experimental data of Ref. Kie91 .
V Comparison with other CD experiments
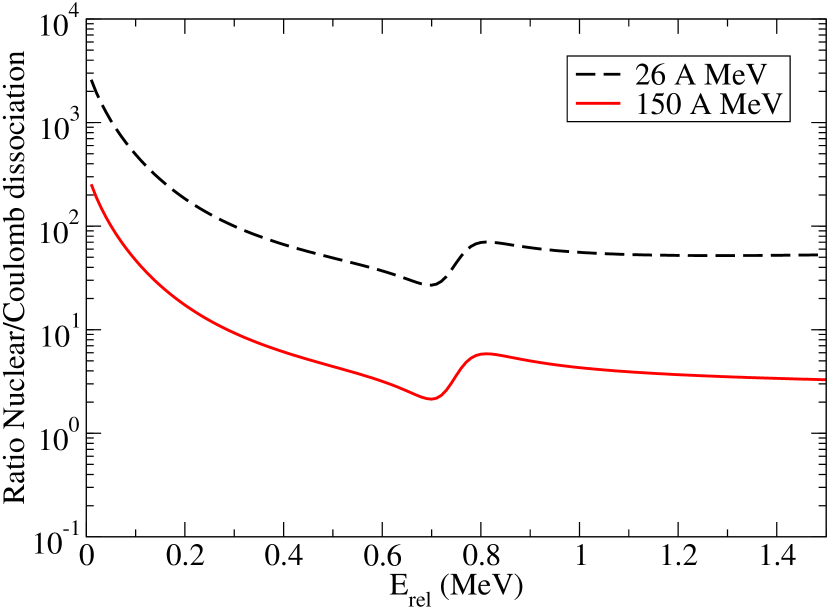
As visible in the upper panel of Fig. 9, the low-energy data points derived for the -factor from the work of Kiener et al. Kie91 disagree with the theoretical curve that we have deduced from the present work. We believe that this is most likely due to a strong nuclear contribution at the lower incident energy of 26 MeV, which was not considered in their analysis in view of the theoretical prediction Shy91 . We have performed a calculation with the theoretical model of this work at an incident energy of 26 MeV and have calculated CD and nuclear cross sections for the laboratory-angular range between 1.5 and 6 degrees, which should correspond approximately to the acceptance of the setup of Ref. Kie91 . Fig. 10 displays the ratio of nuclear to Coulomb break-up cross sections as a function of for the two bombarding energies. Our theory predicts that at 150 MeV the nuclear cross sections are about a factor of 3 larger than the CD ones at and above the resonance, whereas the nuclear component dominates strongly at the lowest energies. At 26 MeV, the ratio of nuclear to CD cross sections is predicted to be about a factor of ten larger than at 150 MeV over the entire range of . This suggests that the data points shown in Ref. Kie91 result almost exclusively from nuclear interactions, contrary to the assumptions underlying their analysis. It is therefore not very meaningful to tune theoretical models in order to improve their agreement with the 26 MeV data as was done in Ref. Blo06 .
VI Production of 6Li in the Big Bang
The 2HLi reaction is the main path for 6Li BBN production while destruction proceeds via the 6Li(p,He one. Both rates are available in the NACRE (NACRE, ) compilation. While the latter reaction rate is reasonably well known at BBN energies, prior to this experiment the former suffered from a large uncertainty. This was mainly due to the fact that the published error margins were aimed at including the Kiener et al. Kie91 measurement carmen . As a result from the present study, we can now propose a more reliable central value based on a successful theoretical model, and a safe upper limit that is even somewhat smaller than the previous NACRE upper limit.
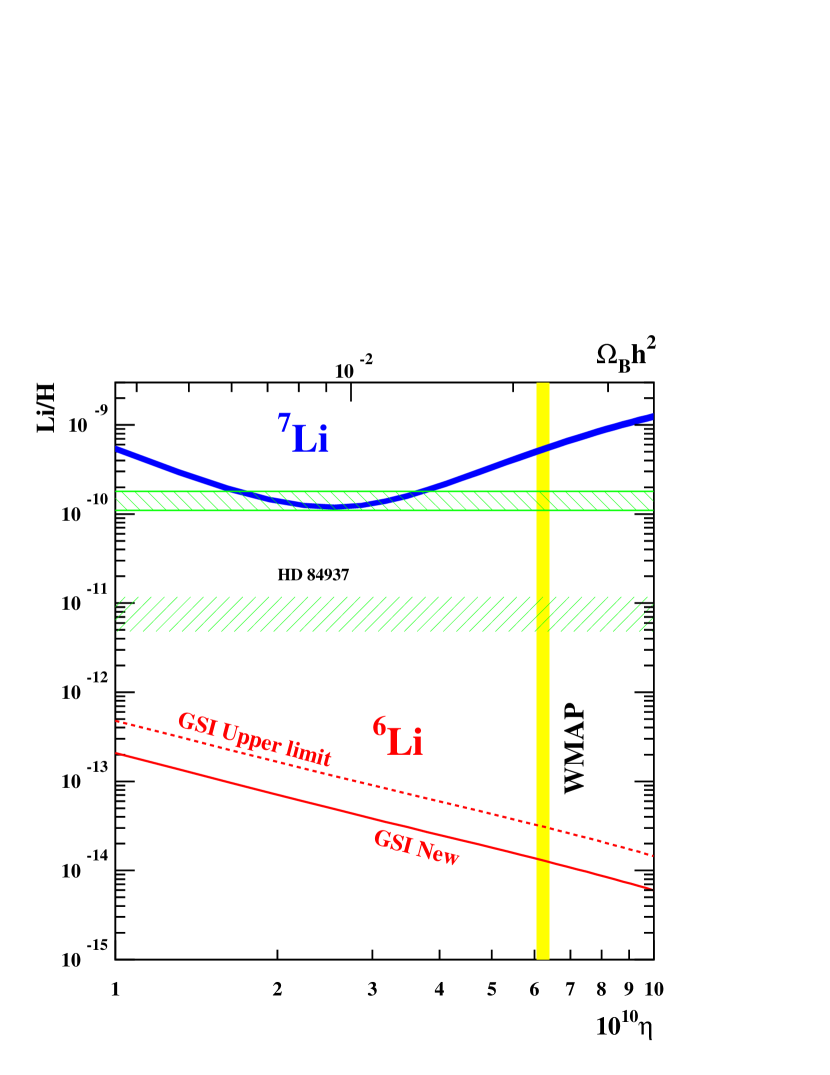
In Fig. 11, the BBN abundances of 7Li and 6Li are displayed as a function of the baryonic density. (It is usual to introduce another parameter, , the ratio of the number of baryons over the number of photons which remains constant during the expansion, and which is directly related to by =3.65). The blue 7Li band is the result of a Monte Carlo calculation taking into account nuclear uncertainties as described in Ref. Coc10 . The upper hatched horizontal area in the figure shows the primordial lithium (6Li+7Li) abundance derived from the “Spite plateau”, i.e. from the practically metallicity-independent Li observations in metal-poor stars Spi10 .
The solid red line for 6Li has been calculated within the same physical model, using the theoretical reaction rate from this work for 2HLi. Both 1 and 2 contributions have been included. At WMAP baryonic density, a value for the 6Li/H production ratio of results. The dashed red line represents a very conservative upper limit for 2HLi that would hold if the low-energy data points from this work would result from CD only. Fig. 7 demonstrates clearly that this is not the case. But even this extremely conservative limit is about two orders of magnitude smaller than the only positive observation of 6Li surviving after the reanalysis of Li lines by Steffen et al. Ste10 , indicated in Fig. 11 by the lower hatched horizontal band. This finding corroborates earlier statements (e.g. Coc10 ; Spi10 ) that observations –if confirmed– of 6Li primordial yields around a few percent of the Spite plateau would require astrophysical sources other than BBN.
In order to facilitate astrophysical calculations of stellar 6Li synthesis with our new theoretical 1 and 2 -factors, we list in Table 2 the reaction rates for the temperature range .
| T9 | N | T9 | N |
|---|---|---|---|
| cm3mol-1s-1 | cm3mol-1s-1 | ||
| 0.001 | 0.9153 10-29 | 0.140 | 0.6967 10-04 |
| 0.002 | 0.2610 10-22 | 0.150 | 0.9495 10-04 |
| 0.003 | 0.3458 10-19 | 0.160 | 0.1261 10-03 |
| 0.004 | 0.3190 10-17 | 0.180 | 0.2090 10-03 |
| 0.005 | 0.7929 10-16 | 0.200 | 0.3237 10-03 |
| 0.006 | 0.9163 10-15 | 0.250 | 0.7846 10-03 |
| 0.007 | 0.7672 10-14 | 0.300 | 0.1557 10-02 |
| 0.008 | 0.4990 10-13 | 0.350 | 0.2715 10-02 |
| 0.009 | 0.2100 10-12 | 0.400 | 0.4325 10-02 |
| 0.010 | 0.6547 10-12 | 0.450 | 0.6453 10-02 |
| 0.011 | 0.1655 10-11 | 0.500 | 0.9169 10-02 |
| 0.012 | 0.3612 10-11 | 0.600 | 0.1674 10-01 |
| 0.013 | 0.7142 10-11 | 0.700 | 0.2813 10-01 |
| 0.014 | 0.1325 10-10 | 0.800 | 0.4502 10-01 |
| 0.015 | 0.2363 10-10 | 0.900 | 0.6944 10-01 |
| 0.016 | 0.4103 10-10 | 1.000 | 0.1033 10+00 |
| 0.018 | 0.1157 10-09 | 1.250 | 0.2359 10+00 |
| 0.020 | 0.2965 10-09 | 1.500 | 0.4350 10+00 |
| 0.025 | 0.2014 10-08 | 1.750 | 0.6839 10+00 |
| 0.030 | 0.8452 10-08 | 2.000 | 0.9623 10+00 |
| 0.040 | 0.6594 10-07 | 2.500 | 0.1549 10+01 |
| 0.050 | 0.2827 10-06 | 3.000 | 0.2132 10+01 |
| 0.060 | 0.8598 10-06 | 3.500 | 0.2705 10+01 |
| 0.070 | 0.2094 10-05 | 4.000 | 0.3280 10+01 |
| 0.080 | 0.4372 10-05 | 5.000 | 0.4476 10+01 |
| 0.090 | 0.8156 10-05 | 6.000 | 0.5754 10+01 |
| 0.100 | 0.1397 10-04 | 7.000 | 0.7088 10+01 |
| 0.110 | 0.2240 10-04 | 8.000 | 0.8438 10+01 |
| 0.120 | 0.3406 10-04 | 9.000 | 0.9773 10+01 |
| 0.130 | 0.4959 10-04 | 10.00 | 0.1107 10+02 |
VII Conclusions
A kinematically complete measurement of the high-energy break-up of 6Li at 150 MeV has shown that Coulomb and nuclear contributions and their interferences have to be taken into account when interpreting the measured angular distributions. Though it was not possible to extract the Coulomb part experimentally, we were able to infer the 2 component of the astrophysical -factor for the 2H(,)6Li reaction from a theoretical reaction model that describes well in particular the low-energy break-up data. The model predicts a drop of with decreasing relative 2H- energy, , as predicted also by most other nuclear models for 6Li, contrary to conclusions from an earlier CD experiment performed at the lower energy of 26 MeV. We have presented evidence that this earlier experiment probably has measured mostly nuclear break-up of 6Li. Our findings allow to make new predictions for the 6Li/H production ratio in Big-Bang nucleosynthesis (BBN) which is orders of magnitudes smaller than the one derived from claimed observations of 6Li in old metal-poor stars. Sources other than BBN have therefore to be invoked for 6Li production if those observations are confirmed.
Acknowledgements.
We thank N. Kurz for his tireless help with the data acquisition. Thanks go to P. Descouvemont and K. Nollett for kindly providing numerical results from their theoretical calculations. This research was supported by the DFG Cluster of Excellence “Origin and Structure of the Universe”.References
- (1) E. Komatsu et al., (WMAP) arXiv:1001.4538 (2010); Astrophys. J. Suppl. Ser. 5, in press.
- (2) A. Coc, E. Vangioni-Flam, P. Descouvemont, A. Adahchour, and C. Angulo, Astrophys. J., 600 544 (2004).
- (3) R.H. Cyburt, B.O. Fulop, and K.A. Olive, J. Cosmology and Astroparticle Phys. 11, 12 (2008).
- (4) A. Coc and E. Vangioni, Proc. Int. Conf. on Nucl. Phys. in Astrophysics, J. Phys. Conf. Ser. 202, 012001 (2010).
- (5) M. Spite and F. Spite, Proc. IAU Symposium 268 Light elements in the Universe, arXiv:1002.1004 (2010).
- (6) M. Asplund, D. Lambert, P.E. Nissen, F. Primas, and V. Smith, Astrophys. J. 644, 229 (2006).
- (7) E. Rollinde, E. Vangioni, and K.A. Olive, Astrophys. J. 651, 658 (2006).
- (8) V. Tatischeff and J.P. Thibaud, Astron. Astrophys. 469, 265 (2007).
- (9) M. Kusakabe, T. Kajino, R.N. Boyd, T. Yoshida, and G.J. Matthews, Ap. J. 680, 846 (2008).
- (10) J. Ellis, K.A. Olive, and E. Vangioni, Phys. Lett. B. 619, 30 (2005).
- (11) K. Jedamzik, Phys. Rev. D 74, 103509 (2006).
- (12) R. Cayrel et al., Astron. Astrophys., 473, L37 (2007); Proc. 10th Symposium on Nuclei in the Cosmos, Mackinac Island, Michigan (USA), arXiv:0810.4290 (2008).
- (13) M. Steffen, R. Cayrel, P. Bonifacio, H.-G. Ludwig, and E. Caffau, Proc. IAU Symposium 268 Light elements in the Universe, arXiv:1001.3274 (2010).
- (14) A.E. Garcia Perez, W. Aoki, S. Inoue, S.G. Ryan, T.K. Suzuki, and M. Chiba, Astron. Astrophys. 504, 213 (2009).
- (15) M. Asplund and K. Lind, Proc. IAU Symposium 268 Light elements in the Universe, arXiv:1002.1993 (2010).
- (16) P.D. Serpico, S. Esposito, F. Iocco, G. Mangano, G. Miele, and O. Pisanti, J. Cosmology and Astroparticle Phys. 12, 10 (2004).
- (17) R.G.H. Robertson, P. Dyer, R.A. Warner, R.C. Melin, T.J. Bowles, A.B. McDonald, G.C. Ball, W.G. Davies, and E.D. Earle, Phys. Rev. Lett. 47, 1867 (1981).
- (18) P. Mohr, V. Kölle, S. Wilmes, U. Atzrott, G. Staudt, J.W. Hammer, H. Krauss, and H. Oberhummer, Phys. Rev. C 50, 1543 (1994).
- (19) F.E. Cecil, J. Yan, and C.S. Galovich, Phys. Rev. C 53, 1967 (1996).
- (20) G. Baur, C.A. Bertulani, and H. Rebel, Nucl. Phys. A458, 188 (1986).
- (21) J. Kiener, H.J. Gils, H. Rebel, S. Zagromski, G. Gsottschneider, N. Heide, H. Jelitto, J. Wentz, and G. Baur, Phys. Rev. C 44, 2195 (1991).
- (22) R. Shyam, G. Baur, and P. Banerjee, Phys. Rev. C 44, 915 (1991).
- (23) S.B. Igamov and R. Yarmukhamedov, Nucl. Phys. A673, 509 (2000).
- (24) A. Kharbach and P. Descouvemont, Phys. Rev. C 58, 1066 (1998).
- (25) B. Jenny, W. Grüebler, V. König, P.A. Schmelzbach, and C. Schweizer, Nucl. Phys. A397, 61 (1983).
- (26) L.C. McIntyre and W. Haeberli, Nucl. Phys. A91, 382 (1967).
- (27) W. Grüebler, P.A. Schmelzbach, V. König, P. Risler, and D. Boerma, Nucl. Phys. A242, 265 (1975).
- (28) S. Typel, H.H Wolter, and G. Baur, Nucl. Phys. A613, 147 (1997), code CDXS+ (2007).
- (29) A.C. Betker, C.A. Gagliardi, D.R. Semon, R.E. Tribble, H.M. Xu, and A.F.Zaruba, Phys. Rev. C 48, 2085 (1993).
- (30) H. Okamura, S. Ishida, N. Sakamoto, H. Otsu, T. Uesaka, T. Wakasa, H. Sakai, T. Niizeki, H. Toyokawa, Y. Tajima, H. Ohnuma, M. Yosoi, K. Hatanaka, and T. Ichihara, Phys. Rev. C 58, 2180 (1998).
- (31) B. Bonin, N. Alamanos, B. Berthier, G. Bruge, H. Faraggi, J.C. Lugol, W. Mittig, L. Papineau, A.I. Yavin, J. Arvieux, L. Farvacque, and M. Buenerd, Nucl. Phys. A445, 381 (1985).
- (32) K. Schwarz et al., Eur. Phys. J. A 7, 367 (2000).
- (33) E.D. Cooper, S. Hama, B.C. Clark, and R.L. Mercer, Phys. Rev. C 47, 297 (1993).
- (34) E. Bauge, J.P. Delaroche, and M. Girod, Phys. Rev. C 58, 1118 (1998).
- (35) H. Geissel et al., Nucl. Instrum. Methods in Phys. Res. B 70, 286 (1992).
- (36) P. Senger et al., Nucl. Instrum. Methods in Phys. Res. A 327, 393 (1993).
- (37) N. Iwasa et al., Phys. Rev. Lett. 83, 2910 (1999); F. Schümann et al., Phys. Rev. C 73, 015806 (2006).
- (38) GEANT Detector Description and Simulation Tool, CERN Program Library Long Writeup W5013 (1993).
- (39) K. Langanke, Nucl. Phys.A457, 351 (1986).
- (40) K.M. Nollett, R.B. Wiringa, and R. Schiavilla, Phys. Rev. C 63, 024003 (2001).
- (41) A.M. Mukhamedzhanov, R.P. Schmitt, R.E. Tribble, and A. Sattarov, Phys. Rev. C 52, 3483 (1995).
- (42) L.D. Blokhintsev, S.B. Igamov, M.M. Nishinov, and R. Yarmukhamedov, Yad. Fiz. 69, 456 (2006), published in Phys. At. Nucl. 69, 433 (2006).
- (43) C. Angulo et al. (NACRE compilation) Nucl. Phys., A656, 3 (1999).
- (44) C. Angulo, private communication.